Valuation
Measuring and Managing the Value of Companies
5th Edition
Chapter 11 Solutions
Estimating the Cost of Capital
Version 1.0
April 1, 2010
Chapter 11
Questions 1 & 2
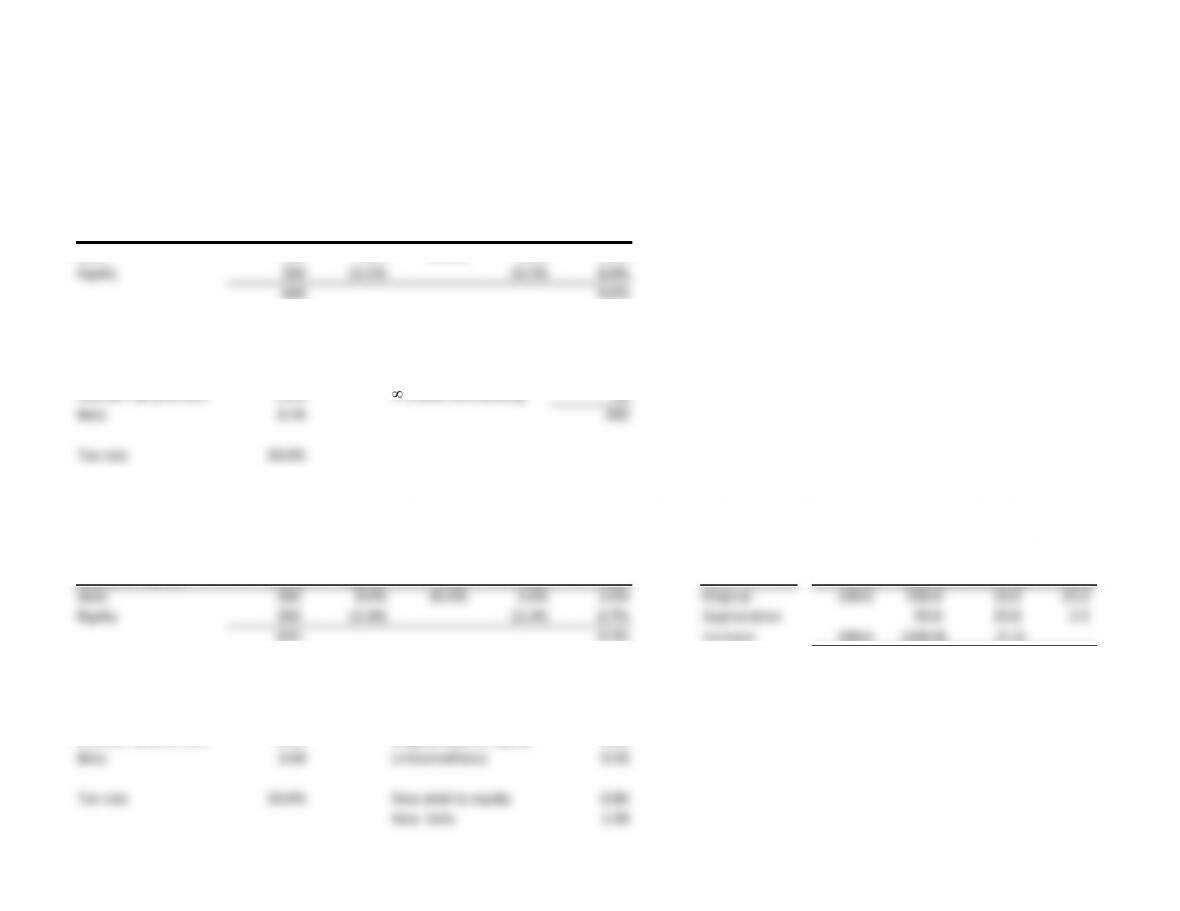
Question 1
Market Cost of Tax After-tax Weighted
Source of capital value capital rate cost cost
Debt 100 7.5% 30.0% 5.3% 0.9%
Equity 500 10.5% 10.5% 8.8%
600 9.6%
Key inputs Market capitalization
Risk-free rate 7.0% Share price 25
Market risk premium 5.0% Shares outstanding 20
Beta 0.70 500
Tax rate 30.0%
Question 2 Capital structure changes
.Market Cost of Tax After-tax Weighted Shares
Source of capital value capital rate cost cost Debt Equity
Outstanding
Price
Debt 300 8.0% 30.0% 5.6% 2.6% Original 100.0 500.0 20.0 25.0
Equity 350 12.4% 12.4% 6.7% Appreciation 50.0 20.0 2.5
650 9.3% Increase 200.0 (200.0) (7.3)
Total 300.0 350.0 12.7 27.5
Key inputs Unlevered beta
Risk-free rate 7.0% Original beta 0.70
Market risk premium 5.0% Original debt to equity 0.20
Beta 1.08 Unlevered beta 0.58
Tax rate 30.0% New debt to equity 0.86
New beta 1.08
Chapter 11
Question 3
Commentary
Since the financial projections for São Paolo Foods are in Brazilian reais (R$), the risk-free rate should be the Brazilian rate, not the German
rate. The beta for EuropeCo is also irrelevant, since the company’s composition (and consequently risk) does not match that of São Paolo Foods.
Chapter 11
Question 4
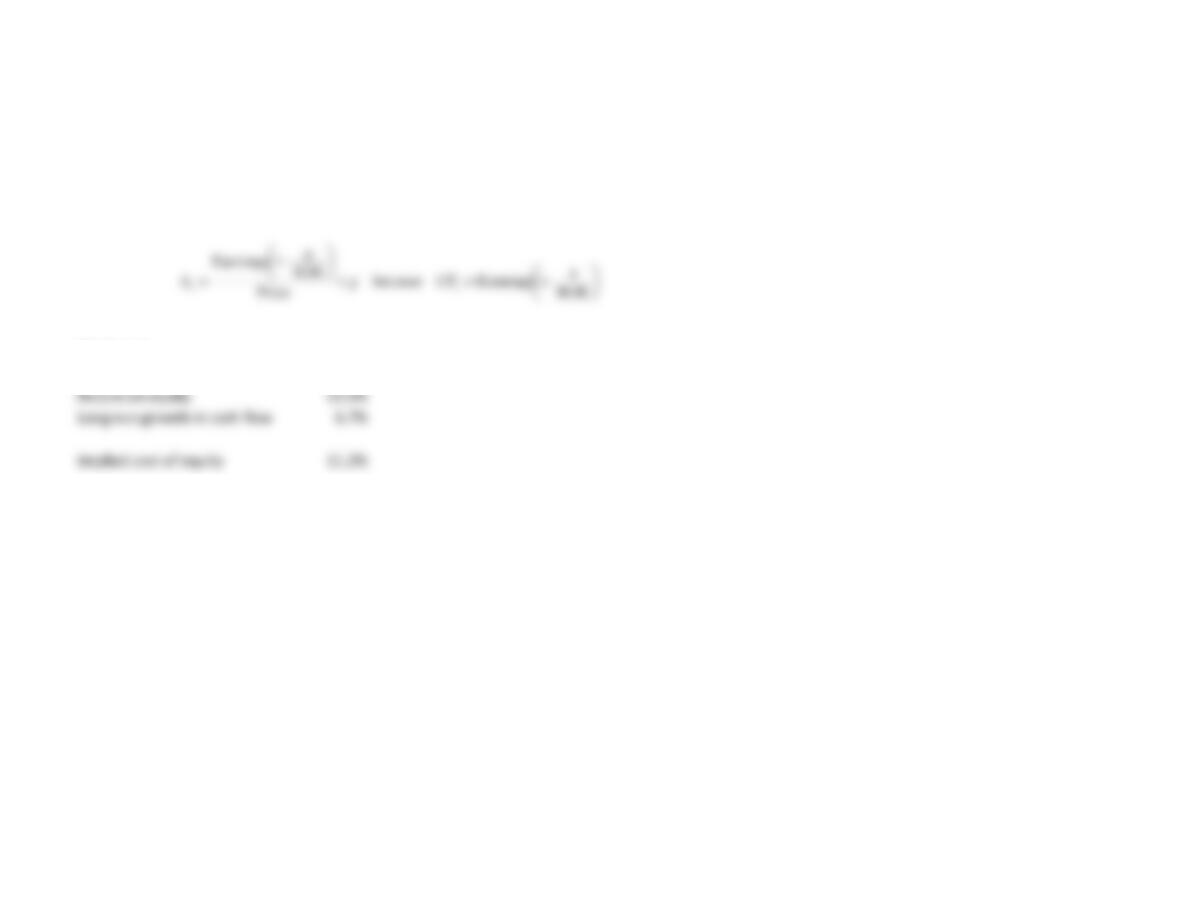
In Chapter 11, ke is estimated using:
Key inputs
Price-to-earnings ratio 11.1
Return on equity 13.5%
Long-run growth in cash flow 6.7%
Implied cost of equity 11.2%
=+
=ROE
–1Earningsbecause
Price
ROE
–1Earnings g
CFg
g
kee
Chapter 11
Question 5
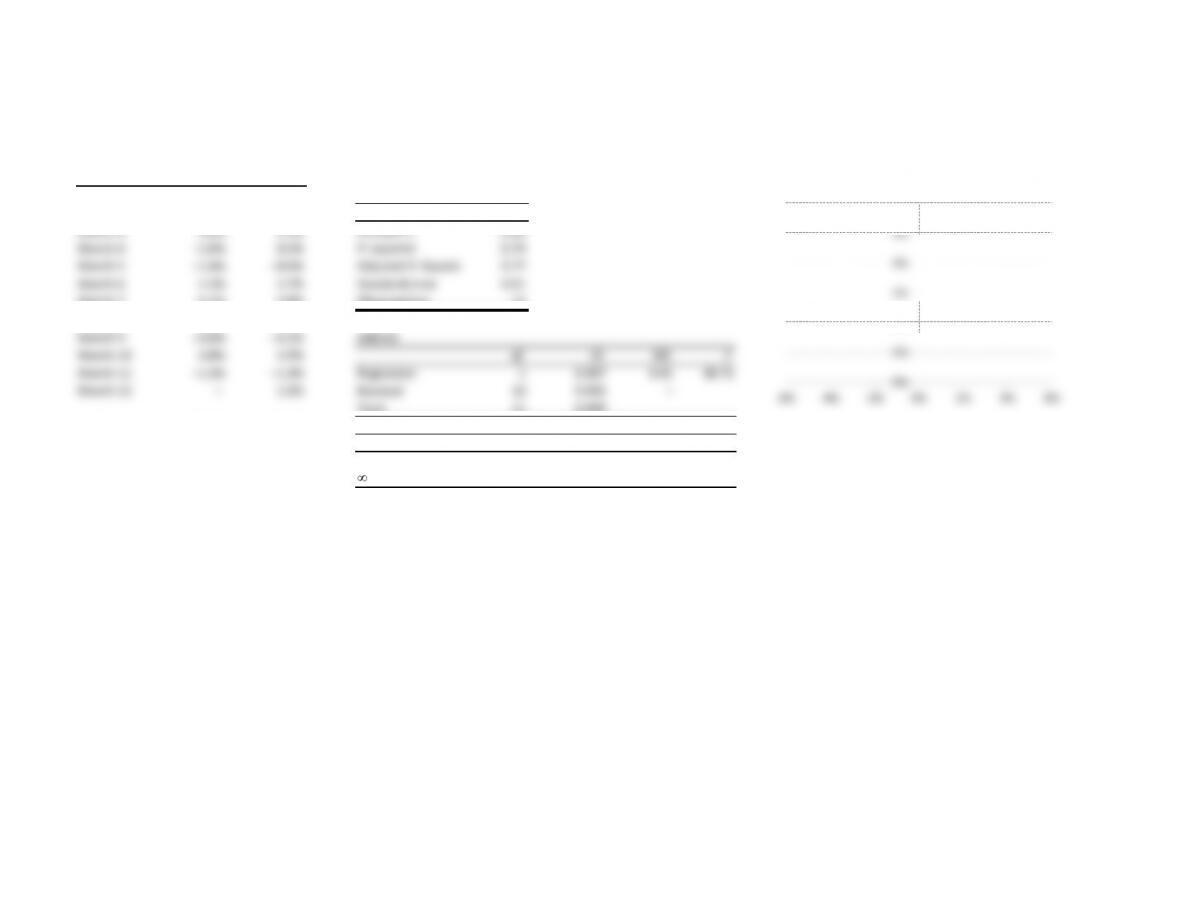
Company Market Summary output
Month 1 1.3% 1.0%
Month 2 2.0% 1.2% Regression s tatistics
Month 3 5.0% 3.4% Multiple R0.89
Month 4 –1.0% 0.3% R-squared 0.79
Month 5 –1.4% –0.6%
Adjusted R-Squared
0.77
Month 6 2.2% 3.7% Standard error 0.01
Month 7 6.1% 4.8% Observations 12
Month 8 0.3% –2.3%
Month 9 –4.0% –4.5% ANOVA
Month 10 3.8% 3.9% df SS MS F
Month 11 –1.2% –1.3% Regression 1 0.007 0.01 38.75
Month 12 – 1.8% Residual 10 0.002 –
Total 11 0.009
Average 2.96% 2.51%
Volatility 2.14% 1.64%
Coefficients
Standard error
t-Stat P-value
Intercept – – 0.49 0.63
Variable 1 0.93 0.15 6.22 –
0%
1%
2%
3%
4%
5%
6%
-6% -4% -2% 0% 2% 4% 6%
Regression Data
Chapter 11
Question 6
Market price Solutions
Price 80.0 Yield to maturity 31.3%
Cost of debt 7.2%
Promised final cash flow
Face 100.0
Coupon 5.0
Final cash flow 105.0
Expected final cash flow
Bond paid 105.0
Bond defaults 50.0
Expected value 85.8
Key data
Coupon 5.0%
Probability of default 35.0%