Valuation
Measuring and Managing the Value of Companies
5th Edition
Chapter 10 Solutions
Estimating Continuing Value
Version 1.0
April 1, 2010
Chapter 10
Question 1
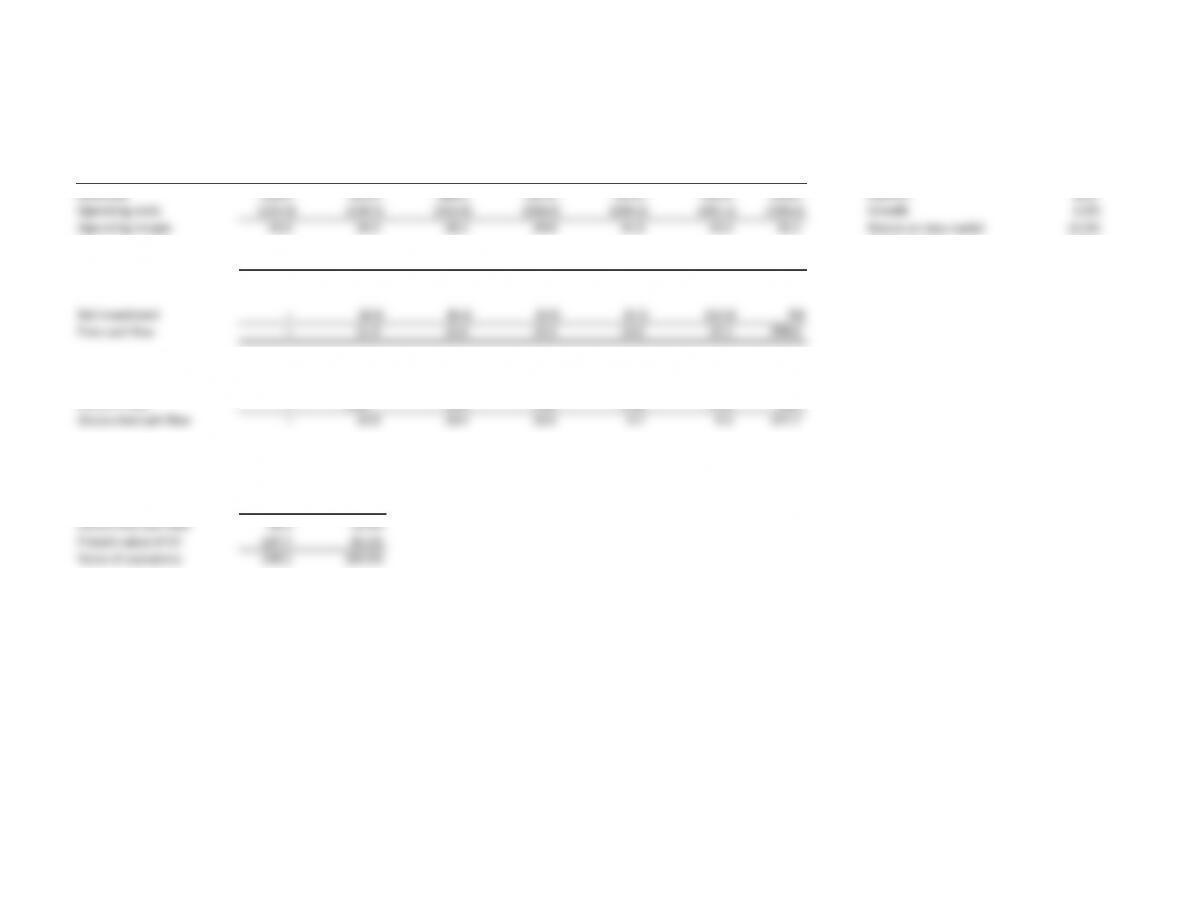
Continuing
Today Year 1 Year 2 Year 3 Year 4 Year 5 value Continuing value
Revenues 250.0 265.0 280.9 297.8 315.6 334.6 354.6 NOPLAT 26.6
Operating costs (225.0) (238.5) (252.8) (268.0) (284.1) (301.1) (319.2) Growth 6.0%
Operating margin 25.0 26.5 28.1 29.8 31.6 33.5 35.5 Return on new capital 15.0%
Cost of capital 10.0%
Operating taxes – (6.6) (7.0) (7.4) (7.9) (8.4) (8.9)
NOPLAT – 19.9 21.1 22.3 23.7 25.1 26.6 Key value driver formula 399.0
Net investment – (8.0) (8.4) (8.9) (9.5) (10.0) CV
Free cash flow – 11.9 12.6 13.4 14.2 15.1 399.0
Discounted cash flow
Discount rate – 1.10 1.21 1.33 1.46 1.61 1.61
Discounted cash flow – 10.8 10.4 10.1 9.7 9.3 247.7
Value of operations
Percent
$ million of total
Discounted cash flow 50.4 16.9%
Present value of CV 247.7 83.1%
Value of operations 298.1 100.0%
p
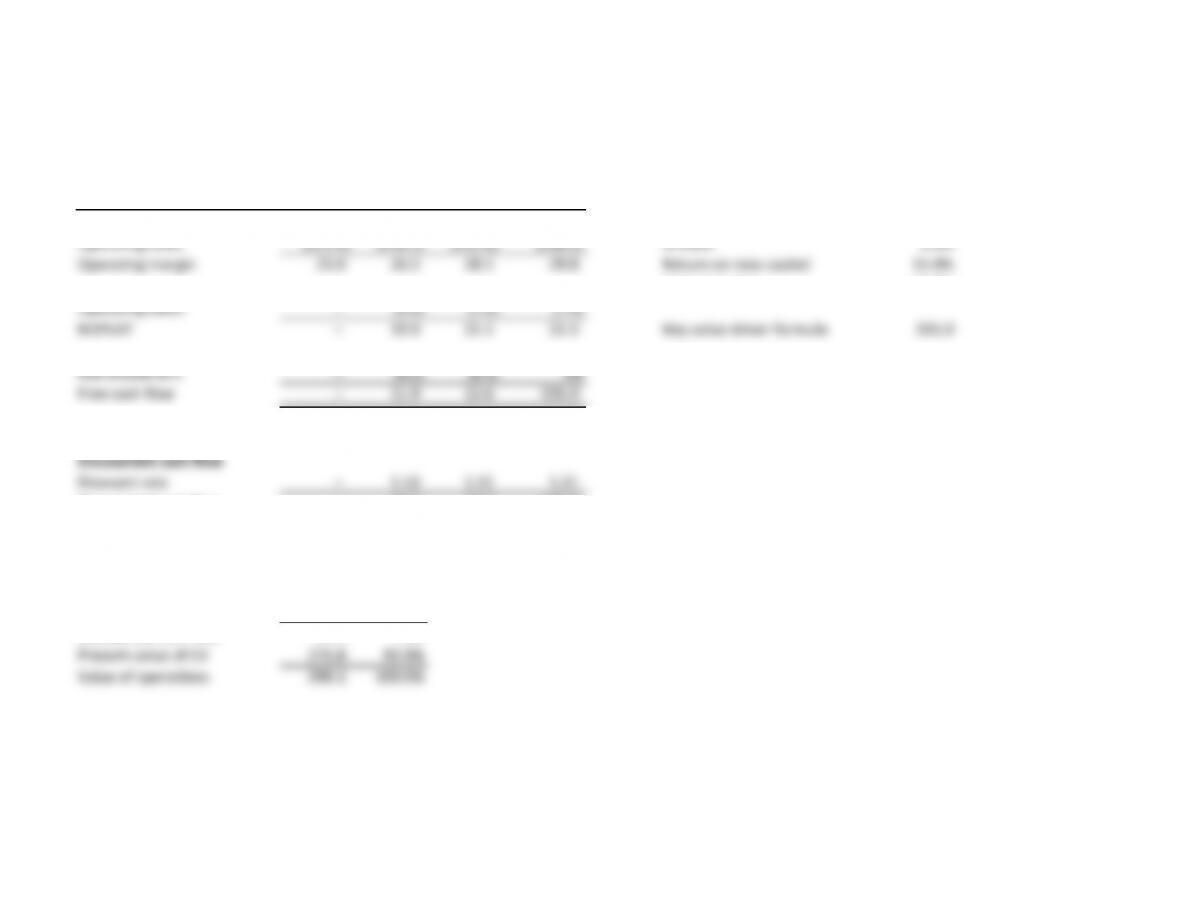
Question 2
Continuing
Today Year 1 Year 2 value Continuing value
Revenues 250.0 265.0 280.9 297.8 NOPLAT 22.3
Operating costs (225.0) (238.5) (252.8) (268.0) Growth 6.0%
Operating margin 25.0 26.5 28.1 29.8 Return on new capital 15.0%
Cost of capital 10.0%
Operating taxes – (6.6) (7.0) (7.4)
NOPLAT – 19.9 21.1 22.3 Key value driver formula 335.0
Net investment – (8.0) (8.4) CV
Free cash flow – 11.9 12.6 335.0
Discounted cash flow
Discount rate – 1.10 1.21 1.21
Discounted cash flow – 10.8 10.4 276.8
Value of operations
Percent
$ million of total
Discounted cash flow 21.3 7.1%
Present value of CV 276.8 92.9%
Value of operations 298.1 100.0%
Chapter 10
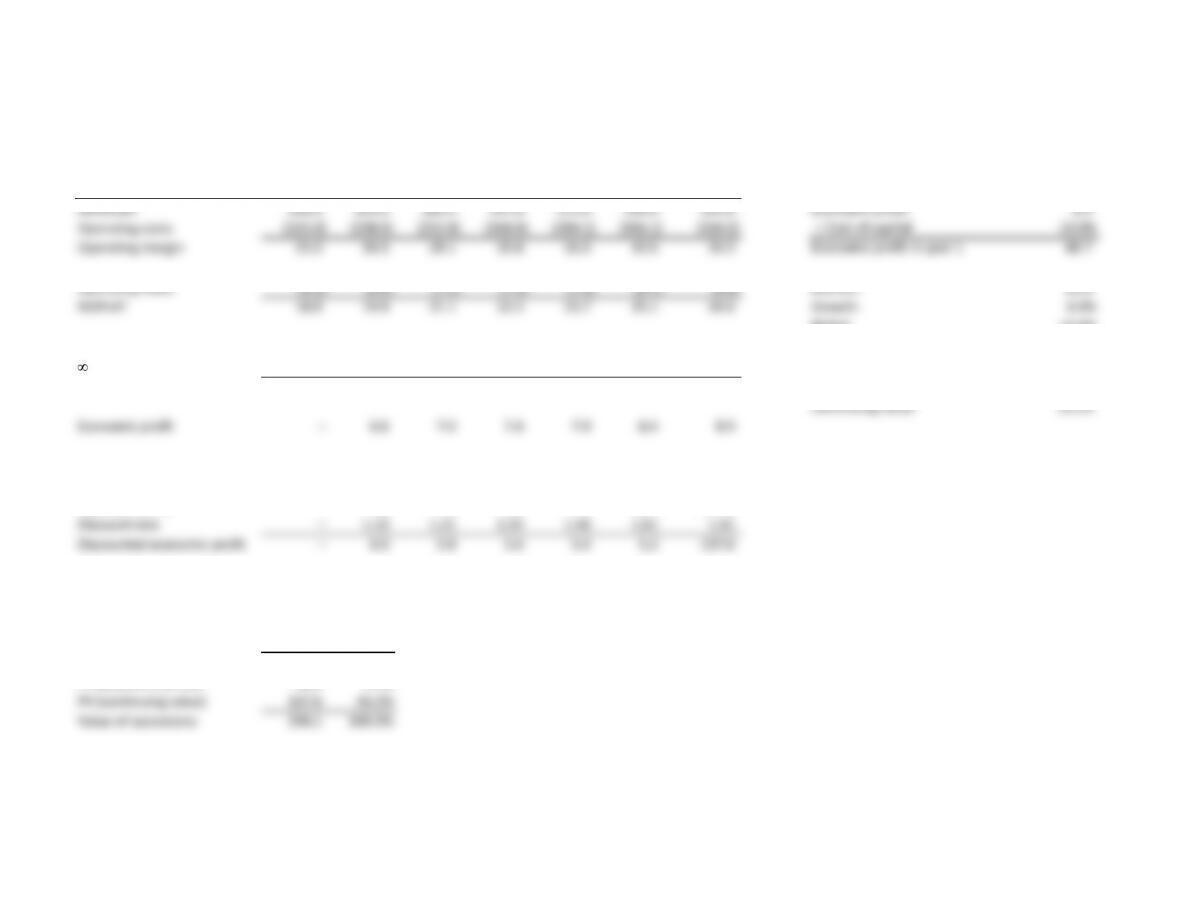
Question 3
Continuing
Today Year 1 Year 2 Year 3 Year 4 Year 5 value Continuing value
Revenues 250.0 265.0 280.9 297.8 315.6 334.6 354.6 Economic profit 8.9
Operating costs (225.0) (238.5) (252.8) (268.0) (284.1) (301.1) (319.2) ÷ Cost of capital 10.0%
Operating margin 25.0 26.5 28.1 29.8 31.6 33.5 35.5 Economic profit in year 1 88.7
Operating taxes (6.3) (6.6) (7.0) (7.4) (7.9) (8.4) (8.9) NOPLAT 26.6
NOPLAT 18.8 19.9 21.1 22.3 23.7 25.1 26.6 Growth 6.0%
RONIC 15.0%
Invested capitalt–1 –132.5 140.5 148.9 157.8 167.3 177.3 WACC 10.0%
Cost of capital –10.0% 10.0% 10.0% 10.0% 10.0% 10.0% Economic profit beyond year 1 133.0
Capital charge –13.3 14.0 14.9 15.8 16.7 17.7
Continuing value 221.6
Economic profit –6.6 7.0 7.4 7.9 8.4 8.9
Discounted economic profit CV
Economic profit –6.6 7.0 7.4 7.9 8.4 221.6
Discount rate –1.10 1.21 1.33 1.46 1.61 1.61
Discounted economic profit –6.0 5.8 5.6 5.4 5.2 137.6
Value of operations
Percent
$ million of total
Invested capital 132.5 44.4%
PV (economic profit) 28.0 9.4%
PV (continuing value) 137.6 46.2%
Value of operations 298.1 100.0%
Chapter 10
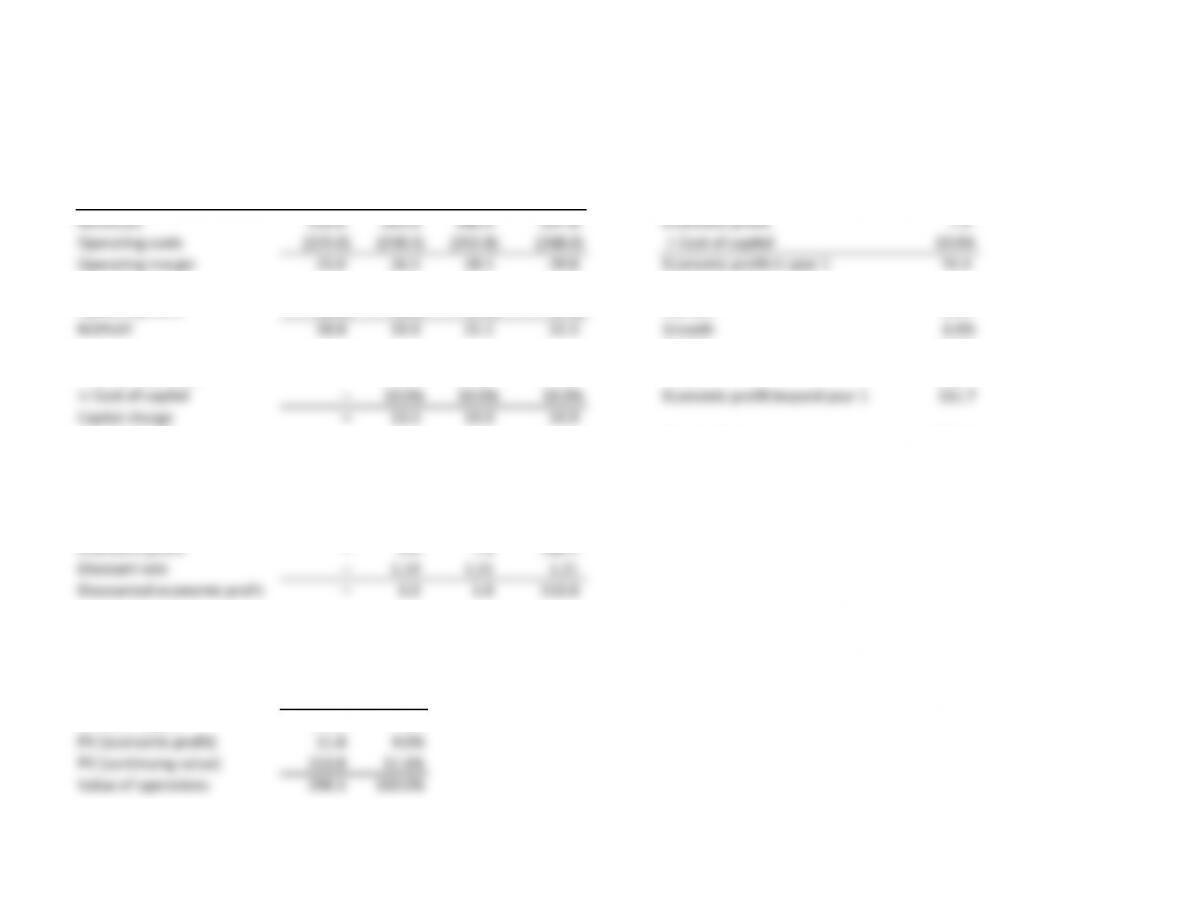
Question 4
Continuing
Today Year 1 Year 2 value Continuing value
Revenues 250.0 265.0 280.9 297.8 Economic profit 7.4
Operating costs (225.0) (238.5) (252.8) (268.0) ÷ Cost of capital 10.0%
Operating margin 25.0 26.5 28.1 29.8 Economic profit in year 1 74.4
Operating taxes (6.3) (6.6) (7.0) (7.4) NOPLAT 22.3
NOPLAT 18.8 19.9 21.1 22.3 Growth 6.0%
RONIC 15.0%
Invested capitalt–1 –132.5 140.5 148.9 WACC 10.0%
Cost of capital –10.0% 10.0% 10.0% Economic profit beyond year 1 111.7
Capital charge –13.3 14.0 14.9
Continuing value 186.1
Economic profit –6.6 7.0 7.4
Discounted economic profit CV
Economic profit –6.6 7.0 186.1
Discount rate –1.10 1.21 1.21
Discounted economic profit –6.0 5.8 153.8
Value of operations
Percent
$ million of total
Invested capital 132.5 44.4%
PV (economic profit) 11.8 4.0%
PV (continuing value) 153.8 51.6%
Value of operations 298.1 100.0%
Chapter 10
Question 5 & 6
Question 5
Perpetuity formulas cannot be used when growth exceeds the cost of capital. When this occurs, cash flows grow
faster than they can be discounted, and consequently value is infinite. From an economic perspective, growth
must eventually fall as the company grows larger (a $250 billion company cannot continually grow faster than
10 percent). To avoid this problem, extend the forecast period until growth stabilizes at a real growth rate
no higher than 5 percent.
Question 6
As Exhibit 10.6 demonstrates, return on total capital does not necessarily equal return on new capital. Return
on total capital is a blend between return on existing capital (i.e., capital that existed at the start of the continuing
value period) and return on new invested capital. As the company adds new capital, return on total capital will
trend toward return on new invested capital. Therefore, SuperiorCo will have return on total capital above
the cost of capital, even during the continuing value period.
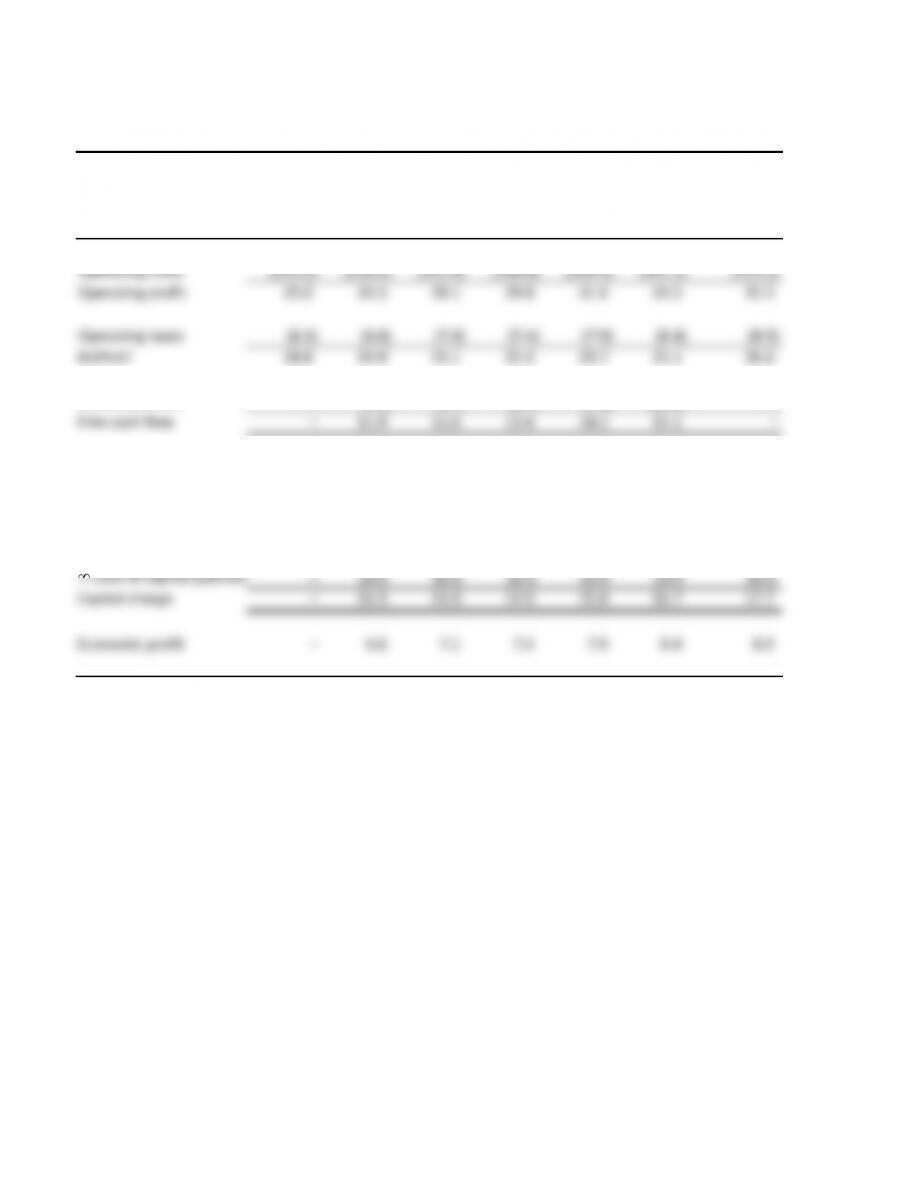
EXHIBIT 10.13 ApparelCo: Free Cash Flow and Economic Profit Forecasts
$ million
Continuing
Today Year 1 Year 2 Year 3 Year 4 Year 5 value
Revenues 250.0 265.0 280.9 297.8 315.6 334.6 354.6
Operating costs (225.0) (238.5) (252.8) (268.0) (284.1) (301.1) (319.2)
Operating profit 25.0 26.5 28.1 29.8 31.6 33.5 35.5
Operating taxes (6.3) (6.6) (7.0) (7.4) (7.9) (8.4) (8.9)
NOPLAT 18.8 19.9 21.1 22.3 23.7 25.1 26.6
Net investment –(8.0) (8.4) (8.9) (9.5) (10.0) –
Free cash flow –11.9 12.6 13.4 14.2 15.1 –
Economic profit
NOPLAT –19.9 21.1 22.3 23.7 25.1 26.6
Invested capitalt–1 –132.5 140.5 148.9 157.8 167.3 177.3
Cost of capital (percent)
–10.0 10.0 10.0 10.0 10.0 10.0
Capital charge –13.3 14.0 14.9 15.8 16.7 17.7
Economic profit –6.6 7.1 7.4 7.9 8.4 8.9

Chapter 10
Question 1
Continuing
Today Year 1 Year 2 Year 3 Year 4 Year 5 value Key value drivers
Revenues 250.0 265.0 280.9 297.8 315.6 334.6 354.6 Investment rate 40.0% 40.0%
Operating costs (225.0) (238.5) (252.8) (268.0) (284.1) (301.1) (319.2) Return on new capital 15.0% 15.0%
Operating margin 25.0 26.5 28.1 29.8 31.6 33.5 35.5 Growth rate 6.0% 6.0%
Operating taxes (6.3) (6.6) (7.0) (7.4) (7.9) (8.4) (8.9) Operating margin 10.0% 10.0%
NOPLAT 18.8 19.9 21.1 22.3 23.7 25.1 26.6 Operating taxes 25.0% 25.0%
NOPLAT margin 7.5% 7.5%
Net investment – (8.0) (8.4) (8.9) (9.5) (10.0) CV
Free cash flow – 11.9 12.6 13.4 14.2 15.1 399.0 Capital turnover 2.0 2.0
Return on invested capital 15.0% 15.0%
Discounted cash flow Cost of capital 10.0% 10.0%
Discount rate – 1.10 1.21 1.33 1.46 1.61 1.61
Discounted cash flow – 10.8 10.4 10.1 9.7 9.3 247.7
Value of operations 0.0
Check
Invested capitalt–1 132.5 140.5 148.9 157.8 167.3 177.3
Invested capital turnover 2.00 2.00 2.00 2.00 2.00 2.00