
Reckitt Benckiser 2009 39
5 EMPLOYEES (CONTINUED)
(c) Share based remuneration (continued)
Table 3: Share awards expense 2008
Movement in number of options
Total fair
Options Options value of
Fair value outstanding outstanding grant as at
of one at 1 Jan Granted/ at 31 Dec 31 Dec Charge
award 2008 adjustments Lapsed Exercised 2008 2008 for 2008
Award Grant date £ number number number number number £m £m
Share Options
2002 17 December 2001 1.95 1,182,545 – (2,500) (363,224) 816,821 1.6 –
2003 22 November 2002 2.05 2,059,774 – – (570,380) 1,489,394 3.1 –
2004 08 December 2003 2.46 2,713,800 – – (899,000) 1,814,800 4.5 –
2005 06 December 2004 2.99 4,366,000 – (8,000) (1,761,528) 2,596,472 7.8 –
2006 05 December 2005 3.33 4,045,000 – (100,000) – 3,945,000 13.1 4.2
2007 08 December 2006 4.23 4,302,307 – (390,294) – 3,912,013 16.5 5.0
2008 11 December 2007 5.99 4,483,300 – (606,992) – 3,876,308 23.2 7.8
2009 08 December 2008 4.69 – 4,026,400 – – 4,026,400 18.9 –
Restricted Shares
2005 06 December 2004 13.92 1,919,357 – – (1,919,357) – – –
2006 05 December 2005 16.38 1,800,895 – (41,950) – 1,758,945 28.8 9.1
2007 08 December 2006 21.02 2,042,653 – (191,936) (2,237) 1,848,480 38.8 11.6
2008 11 December 2007 27.56 2,241,650 – (450,744) – 1,790,906 49.3 16.5
2009 08 December 2008 24.31 – 1,988,200 – – 1,988,200 48.3 –
Other Share Awards
Total 59.0
For options outstanding at year end the weighted average remaining contractual life is 6.15 years (2008: 5.98 years). Options outstanding at
31 December 2009 that could have been exercised at that date were 3,152,108 (2008: 6,717,487).
Notes
Scope: Executive Share Awards (Share Options and Restricted Shares) are awarded to the Top 400 Management Group. Other Share Awards represent
SAYE Schemes (offered to all staff within the relevant geographic area) and a number of Senior Executive Share Ownership Policy Plan (SOPP) awards.
Individual tranches of these awards are not material for detailed disclosure and therefore have been aggregated in the table above.
Contractual Life: Executive Share Awards have a contractual life of ten years but vest according to EPS growth criteria over a three-year period.
Accordingly, the cost is spread over the three years of the performance period. Other share awards have contractual lives of either three, five
or seven years.
Performance criteria: Executive Share Awards are subject to performance criteria based on compound average annual growth (CAAG) rates in earnings
per share over the performance period. Other Share Awards are generally not subject to any criteria other than the employee’s continued employment.
Executive Share Awards included in the above table vest as follows: CAAG of 6%: 40% of awards vest; 7% CAAG: 60%; 8% CAAG: 80%;
9% CAAG: 100%.
The assumptions made within the valuation calculation with respect to the achievement of performance criteria are based on the Directors’ expectations
in light of the Group’s business model and relevant published targets.
Under the terms of the Plans, early exercise is not permitted and therefore the effect of early exercise is not incorporated into the calculation.
The calculation also assumes that there will be no leavers in the following year. No material modifications have been made to the Plans in 2008
or 2009 for the purposes of the valuation.
Volatility: An estimate of future volatility is made with reference to historical volatility over a similar time period to the performance period or the
contractual life as appropriate.
Historical volatility is calculated based on the annualised standard deviation of the Group’s daily share price movement, being an approximation
to the continuously compounded rate of return on the share.
Income statement charge: the income statement charge may not exactly equal one third of the total fair value included in the table above due
to adjustments for in-year lapses or award revisions.
National Insurance contributions are payable in respect of certain share based payments transactions and are treated as cash-settled transactions.
At 31 December 2009, the carrying amount of National Insurance contributions payable was £26m (2008: £17m) of which £13m (2008: £8m) was
in respect of vested grants.
Any additional terms of these shares are shown in the Directors’ Remuneration report on pages 19 to 24.
The weighted average share price for the year was £28.37 (2008: £27.15).

Reckitt Benckiser 200940
Notes to the accounts continued
5 EMPLOYEES (CONTINUED)
(d) Pension and other post-retirement commitments
The Group operates a number of defined benefit and defined contribution pension schemes around the world covering many of its employees, which
are principally funded. The Group’s two most significant defined benefit pension schemes (UK and US) are both funded by the payment of contributions
to separately administered trust funds. The Group also operates a number of other post-retirement schemes in certain countries. The major scheme is in
the US (US retiree health care scheme), where salaried participants become eligible for retiree health care benefits after they reach a combined “age and
years of service rendered” figure of 70, although the age must be a minimum of 55. As at 31 December 2009 there were 2,616 (2008: 2,655) eligible
retirees and 1,758 (2008: 1,682) current employees potentially eligible. This scheme is unfunded.
Pension costs for the year are as follows:
2009 2008
£m £m
Total pension costs recognised in the income statement (note 3) 52 34
For the UK scheme, a full independent actuarial valuation was carried out at 5 April 2007 and updated at 31 December 2009. For the US scheme, a full
independent actuarial valuation was carried out at 1 January 2009 and updated at 31 December 2009. The projected unit valuation method was used
for the UK and US scheme valuations. The major assumptions used by the actuaries for the three major schemes as at 31 December 2009 were:
2009 2008
US US US US
UK (pension) (medical) UK (pension) (medical)
% % % % % %
Rate of increase in pensionable salaries 4.6 4.5 – 3.6 4.5 –
Annual medical cost inflation – – 5.0-9.0 – – 5.0-9.0
Long-term expected rate of return on:
Equities 8.1 9.3 – 7.7 9.5 –
Bonds 5.1 5.7 – 4.7 5.7 –
Other 6.3 8.0 – 5.8 6.7 –
The expected rate of return on plan assets is based on market expectation at the beginning of the period for returns over the entire life of the benefit
obligation. Assumptions regarding future mortality experience are set in accordance with published statistics and experience in each territory. For the UK
scheme the mortality assumptions were based on the following tables; the average life expectancy in years of a pensioner retiring at aged 60 on the
balance sheet date is as follows:
The average life expectancy in years of a pensioner retiring at aged 60, 20 years after the balance sheet date is as follows:
2009 2008
Male 28.4 26.9
Female 30.8 29.1
For the US scheme the mortality assumptions were determined using the RP2000 combined table. The average life expectancy in years of a pensioner
retiring at age 60 on the balance sheet date is 22.6 years (2008: 22.4 years) for males and 24.8 years (2008: 24.7 years) for females.
Impact of medical cost trend rates
A one percentage point change in the assumed health care cost trend rates would have the following effects:
+1% -1%
Reckitt Benckiser 2009 41
5 EMPLOYEES (CONTINUED)
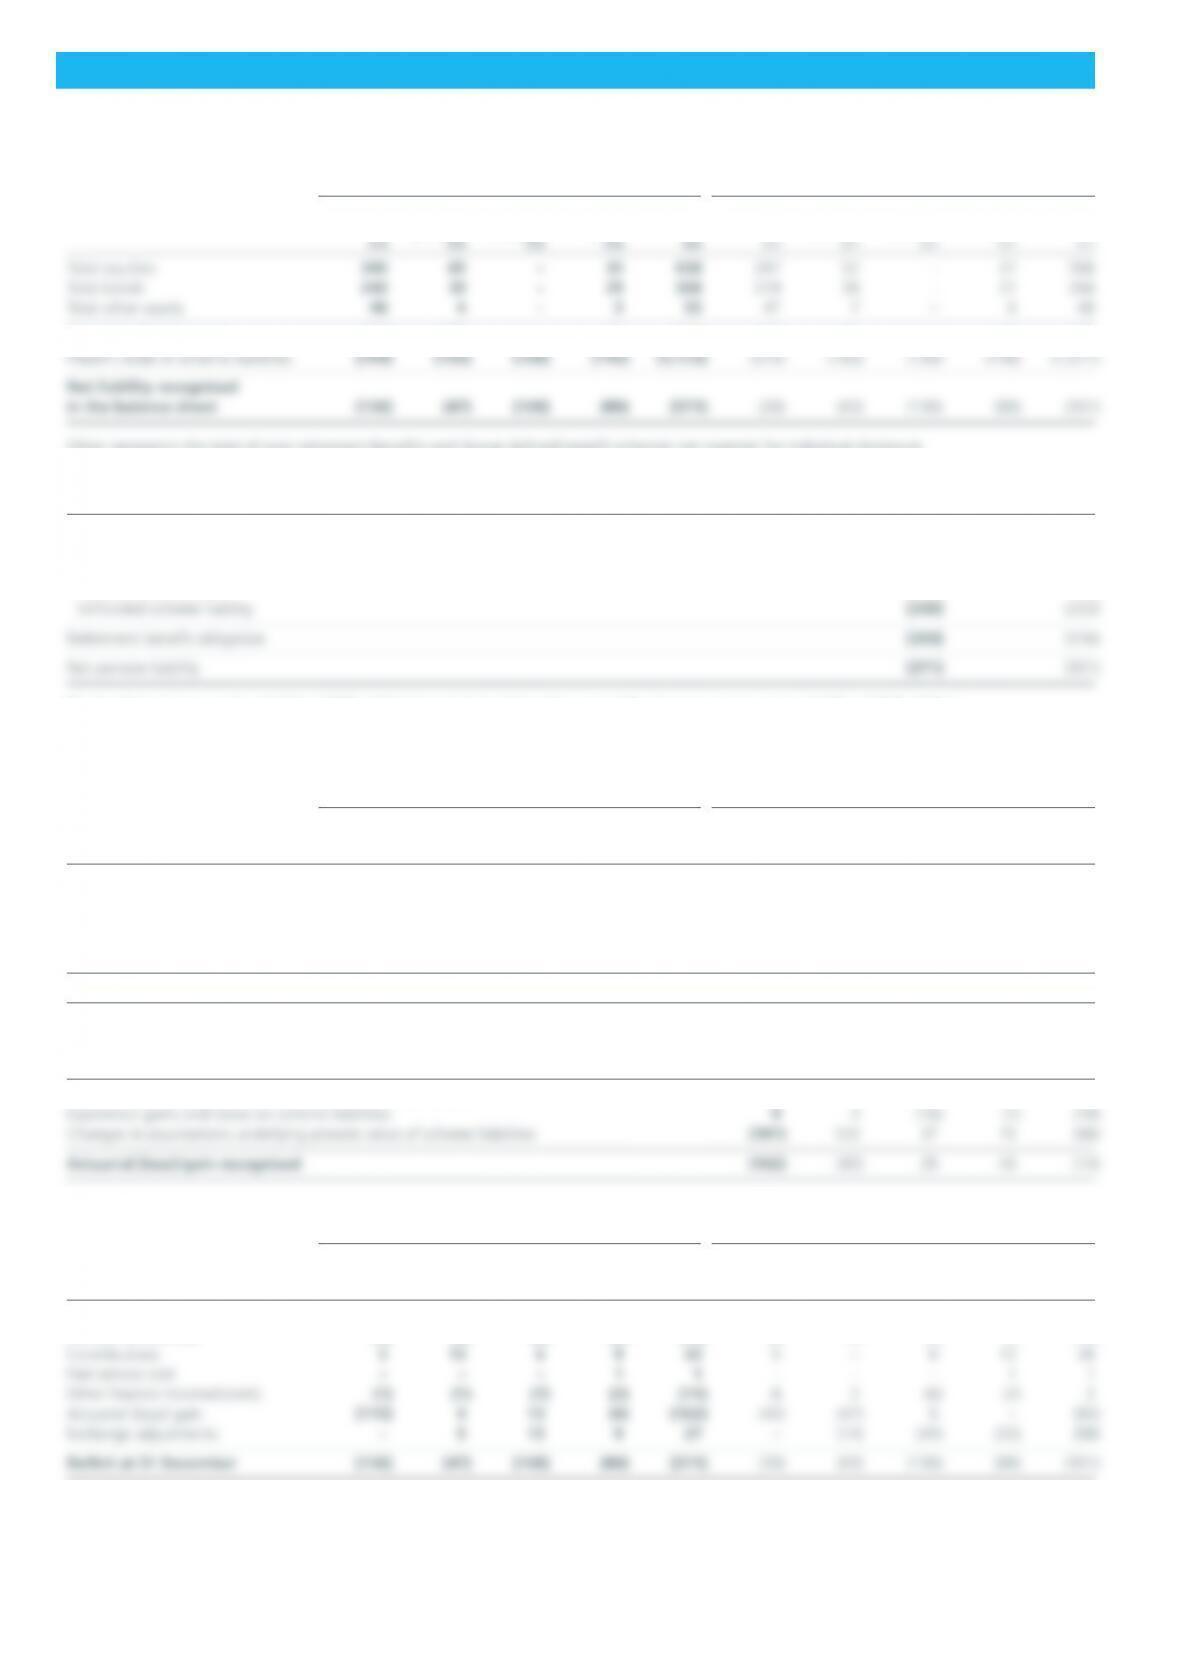
The amounts recognised in the balance sheet are determined as follows:
2009 2008
US US US US
UK (pension) (medical) Other Total UK (pension) (medical) Other Total
Fair value of plan assets 628 108 – 65 801 553 97 – 60 710
Other represents the total of post-retirement benefits and Group defined benefit schemes not material for individual disclosure.
The net pension liability is recognised in the balance sheet as follows:
2009 2008
£m £m
Non-current asset:
Funded scheme surplus 22 15
Non-current liability:
Funded scheme deficit (193) (94)
The funded scheme surplus of £22m (2008: £15m) is included within other receivables in non-current assets of £25m (2008: £19m).
None of the pension schemes’ assets includes an investment in shares of the Company.
The amounts recognised in the income statement are as follows:
2009 2008
US US US US
UK (pension) (medical) Other Total UK (pension) (medical) Other Total
£m £m £m £m £m £m £m £m £m £m
Current service cost (5) (5) (3) (5) (18) (8) (3) (2) (5) (18)
Past service cost – – – 1 1 – – – 1 1
Expected return on pension
scheme assets 35 7 – 5 47 47 9 – 5 61
Interest on pension scheme liabilities (36) (8) (7) (7) (58) (39) (7) (6) (7) (59)
Total charge to the income statement (6) (6) (10) (6) (28) – (1) (8) (6) (15)
The amounts recognised in other comprehensive income for the Group are as follows:
2009 2008 2007 2006 2005
£m £m £m £m £m
Actual return less expected return on pension scheme assets 70 (191) 4 29 71
The movements in the amounts recognised in the balance sheet are as follows:
2009 2008
US US US US
Movement of net (liability)/ UK (pension) (medical) Other Total UK (pension) (medical) Other Total
assets during the year £m £m £m £m £m £m £m £m £m £m
(Deficit)/surplus at 1 January (20) (63) (130) (88) (301) 18 (1) (99) (77) (159)
Current service cost (5) (5) (3) (5) (18) (8) (3) (2) (5) (18)
The actual return on plan assets was a gain of £102m (2008: £136m loss) for the UK scheme and a gain of £20m (2008: £34m loss) for the US scheme.
Included within contributions above are employee contributions of £1m (2008: £1m).

Reckitt Benckiser 200942
Notes to the accounts continued
5 EMPLOYEES (CONTINUED)
Changes in the present value of scheme liabilities are as follows:
2009 2008
US US US US
UK (pension) (medical) Other Total UK (pension) (medical) Other Total
£m £m £m £m £m £m £m £m £m £m
Present value of liabilities
at 1 January 573 160 130 148 1,011 695 113 99 125 1,032
Current service cost 5 5 3 5 18 8 3 2 5 18
Past service cost – – – (1) (1) – – – (1) (1)
Interest cost 36 8 7 7 58 39 7 6 7 59
Benefits paid (32) (10) (6) (9) (57) (29) (9) (6) (15) (59)
Actuarial losses / (gains) 182 8 (13) (5) 172 (140) 4 (5) 35 (106)
Exchange adjustments – (16) (13) – (29) – 42 34 (8) 68
Present value of liabilities
at 31 December 764 155 108 145 1,172 573 160 130 148 1,011
Changes in the fair value of plan assets are as follows:
2009 2008
US US
UK (pension) Other Total UK (pension) Other Total
£m £m £m £m £m £m £m £m
Fair value of plan assets at 1 January 553 97 60 710 713 112 48 873
Expected rate of return 35 7 5 47 47 9 5 61
Contributions 5 13 15 33 5 – 15 20
Benefits paid (32) (10) (15) (57) (29) (9) (15) (53)
Actuarial gains / (losses) 67 12 (9) 70 (183) (43) 35 (191)
Exchange adjustments – (11) 9 (2) – 28 (28) –
Fair value of plan assets at 31 December 628 108 65 801 553 97 60 710
Cumulative actuarial gains and losses recognised in other comprehensive income:
2009 2008
£m £m
At 1 January (107) (22)
Net actuarial loss recognised in the year (note 7) (102) (85)
At 31 December (209) (107)
History of experience gains and losses:
2009 2008 2007 2006 2005
£m £m £m £m £m
Experience adjustments arising on scheme assets:
Amount 70 (191) 4 29 71
Percentage of scheme assets 8.7% (26.9%) 0.5% 3.4% 8.7%
Experience adjustments arising on scheme liabilities:
Expected employer contributions to be paid to funded defined benefit schemes in 2010 are £5m for the UK and £1m for other schemes.
Reckitt Benckiser 2009 43
6 NET FINANCE INCOME / (EXPENSE)
2009 2008
Finance income £m £m
Interest income on cash and cash equivalents 17 30
Gain on available for sale financial instruments (Interest on short-term deposits) – 1
Total finance income 17 31
Finance expense
Interest payable on bank borrowings – (14)
Amortisation of issue costs of bank loans (2) (1)
Interest payable on other loans (14) (44)
Other interest expense – (3)
Total finance expense (16) (62)
Net finance income / (expense) 1 (31)
Interest payable and similar charges relating to borrowings repayable after more than five years was £nil (2008: less than £1m).
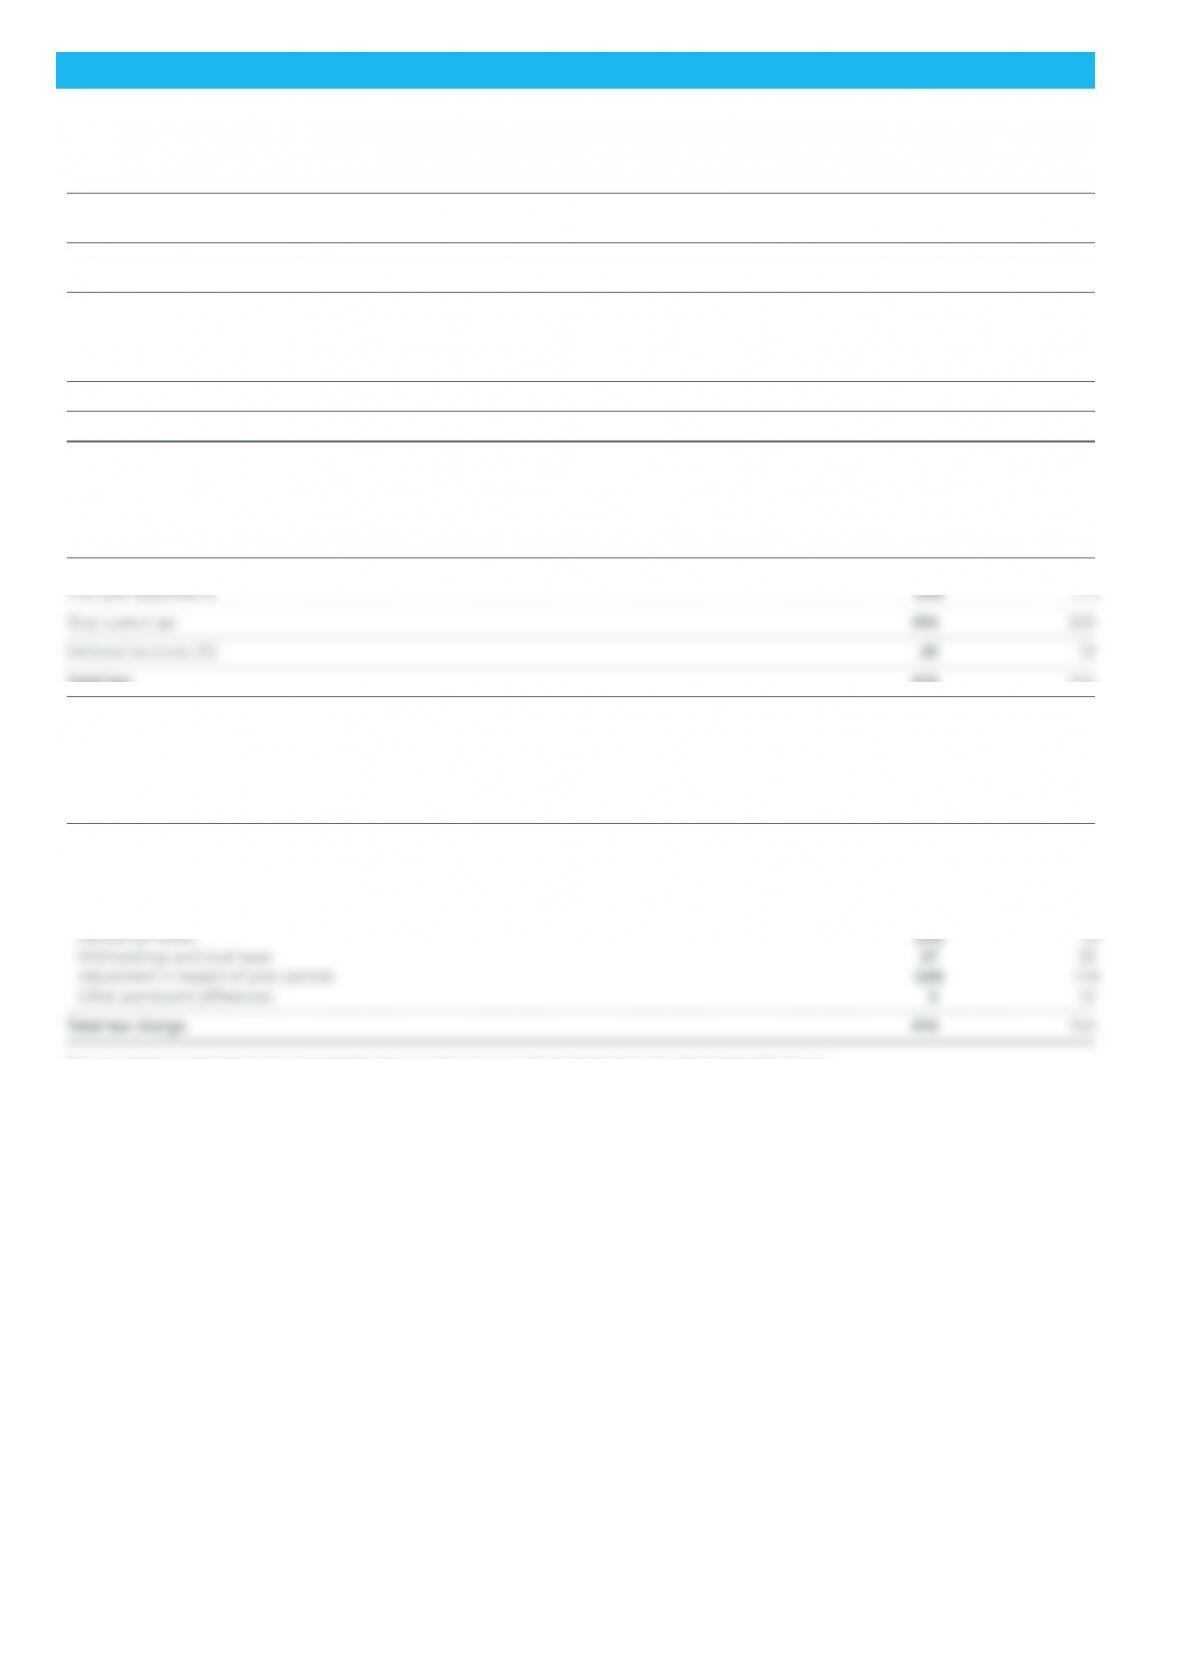
7 INCOME TAX EXPENSE
2009 2008
£m £m
Current tax 493 352
Total tax 474 354
UK income tax of £103m (2008: £6m credit) is included within current tax and is calculated at 28% (2008: 28.5%) of the estimated assessable profit/
loss for the year. Taxation for other jurisdictions is calculated at the rates prevailing in the relevant jurisdictions.
The total tax charge for the year can be reconciled to the accounting profit as follows:
2009 2008
£m £m
Profit before tax 1,892 1,474
Tax at the UK corporation tax rate of 28% (2008: 28.5%) 530 420
Effects of:
Tax at rates other than the UK corporation tax rate (55) (148)
Adjustments to amounts carried in respect of unresolved tax matters 21 54
The tax charge is expected to be impacted by items in the nature of those listed above for the foreseeable future.
Included within other permanent differences is the impact of tax law changes in the UK and tax rate changes in other jurisdictions of £nil
(2008: £6m charge).

Reckitt Benckiser 200944
Notes to the accounts continued
7 INCOME TAX EXPENSE (CONTINUED)
The tax credit / (charge) relating to components of other comprehensive income is as follows:
2009 2008
Tax Tax
Before credit/ After Before (charge)/ After
Tax (charge) Tax Tax credit Tax
Net exchange adjustments on foreign currency translation (193) 2 (191) 491 (12) 479
Actuarial losses (note 5) (102) 34 (68) (85) 11 (74)
Current tax: share schemes 2 (12)
Deferred tax: share schemes (note 20) 34 11
36 (1)
The income tax credited / (charged) directly to the statement of changes in equity during the year is as follows:
2009 2008
£m £m
Current tax:
Share schemes 29 15
Deferred tax:
Share schemes (3) (23)
26 (8)
8 EARNINGS PER SHARE
Basic
Basic earnings per share is calculated by dividing the profit attributable to equity holders of the Company (2009: £1,418m (2008: £1,120m)) by the
weighted average number of ordinary shares in issue during the period (2009: 712,995,914 (2008: 710,569,582)).
Diluted
Diluted earnings per share is calculated by adjusting the weighted average number of shares outstanding to assume conversion of all potentially dilutive
ordinary shares. The Company has two categories of dilutive potential ordinary shares: Executive Options and Employee Sharesave schemes. The options
only dilute earnings when they result in the issue of shares at a value below the market price of the share and when all performance criteria (if
applicable) have been met. As at 31 December 2009, there were 7.5m (2008: 4.7m) of Executive Options not included within the dilution because the
exercise price for the options was greater than the average share price for the year.
The reconciliation between net income and the weighted average number of shares used in the calculation of the diluted earnings per share
is set out below:
2009 2008
Net Average Earnings Net Average Earnings
income number of per share income number of per share
£m shares pence £m shares pence
Profit attributable to shareholders 1,418 712,995,914 198.9 1,120 710,569,582 157.6
Dilution for Executive Options outstanding
Adjusted basis
The reconciliation between net income and the weighted average number of shares used in the calculations of the diluted earnings per share is set
out below:
2009 2008
Net Average Earnings Net Average Earnings
income number of per share income number of per share
£m shares pence £m shares pence
Profit attributable to shareholders* 1,418 712,995,914 198.9 1,143 710,569,582 160.9
Dilution for Executive Options outstanding
and Executive Restricted Share Plan 14,342,618 12,491,457
Dilution for Employee Sharesave scheme options outstanding 834,338 1,047,123
On a diluted basis 1,418 728,172,870 194.7 1,143 724,108,162 157.8
*adjusted to exclude exceptional items.
The Directors believe that a diluted earnings per ordinary share, adjusted for the impact of the exceptional items after the appropriate tax amount,
provides additional useful information on underlying trends to shareholders in respect of earnings per ordinary share.
Reckitt Benckiser 2009 45
9 DIVIDENDS
2009 2008
£m £m
Dividends on equity ordinary shares:
In addition, the Directors are proposing a final dividend in respect of the financial year ended 31 December 2009 of 57.0p per share which will absorb
an estimated £410m of shareholders’ funds. It will be paid on 27 May 2010 to shareholders who are on the register on 26 February 2010. The expected
tax impact of this dividend for the Company is £nil (2008: £nil).
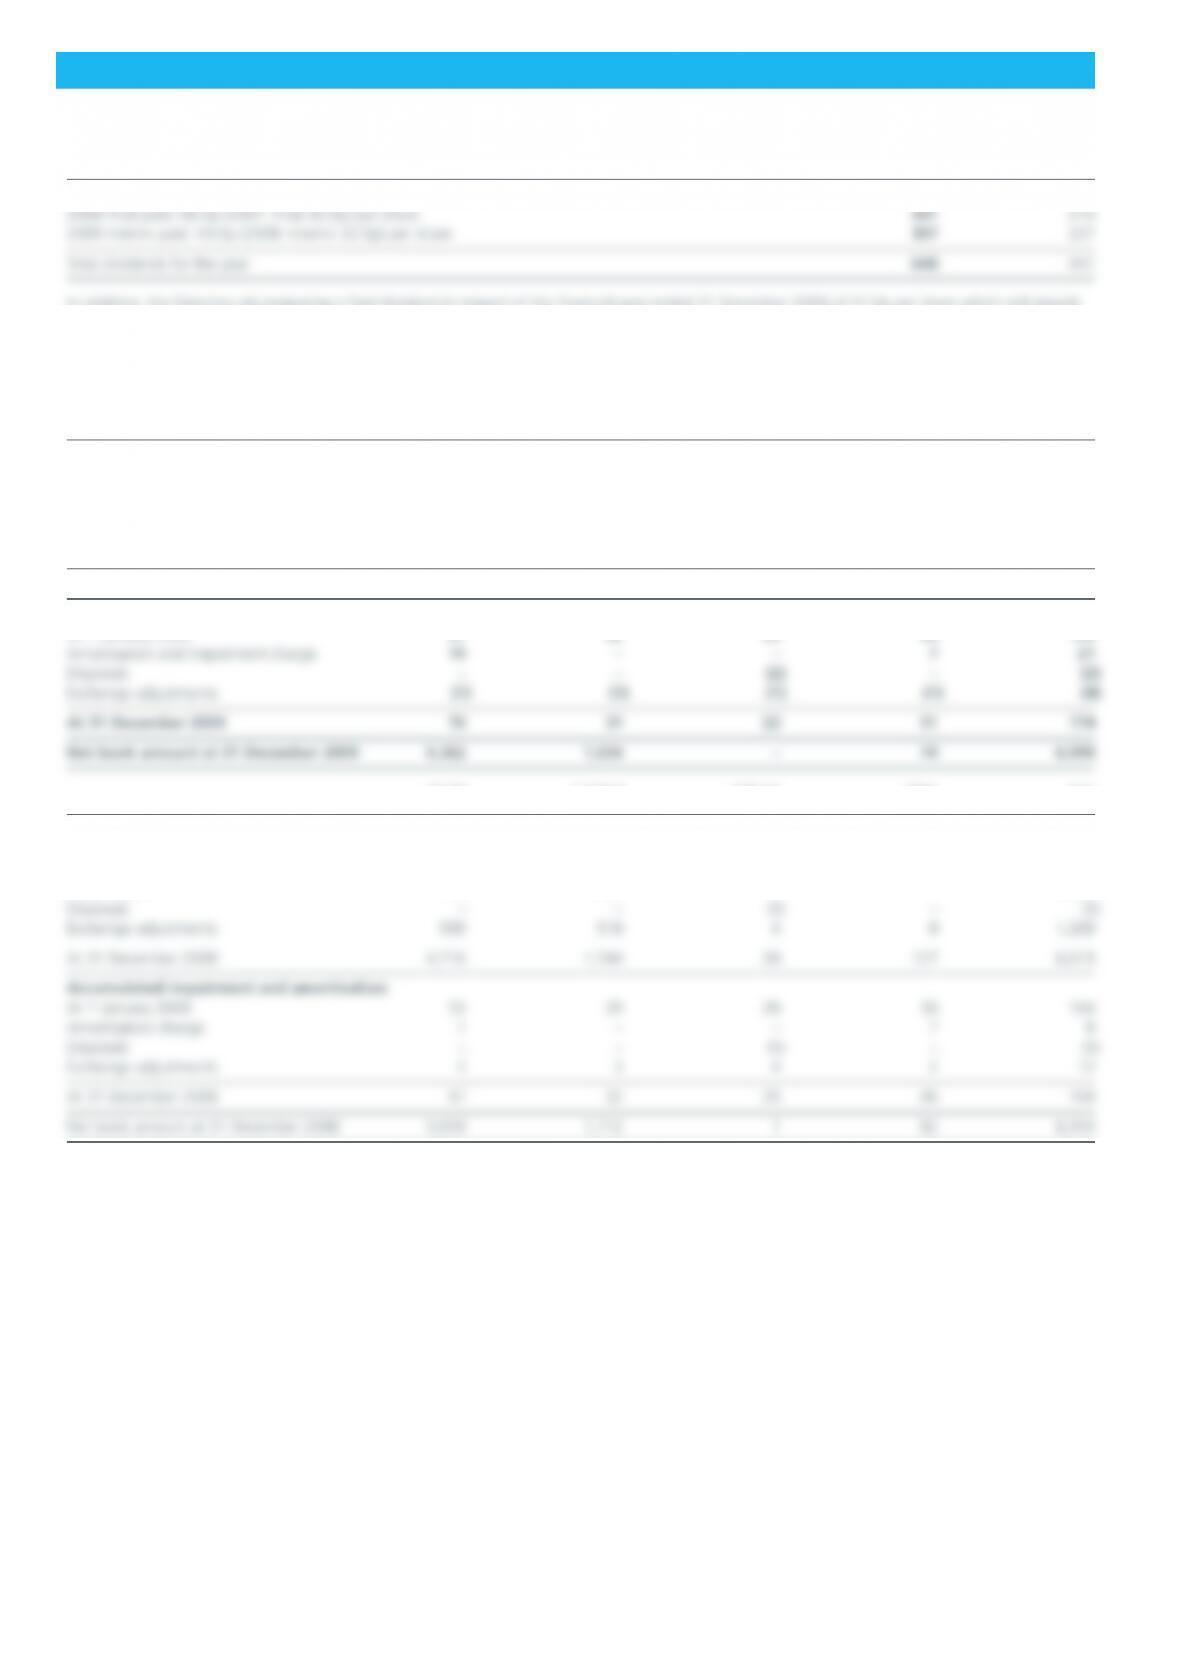
10 GOODWILL AND OTHER INTANGIBLE ASSETS
Brands Goodwill Software Other Total
£m £m £m £m £m
Cost
At 1 January 2009 4,716 1,744 26 127 6,613
Additions 1 – – 1 2
Acquisitions – 8 – – 8
Disposals – – (2) – (2)
Exchange adjustments (285) (67) (2) (3) (357)
At 31 December 2009 4,432 1,685 22 125 6,264
Accumulated impairment and amortisation
At 1 January 2009 57 32 25 45 159
Brands Goodwill Software Other Total
£m £m £m £m £m
Cost
At 1 January 2008 2,970 859 27 99 3,955
Additions 31 – – 20 51
Acquisitions 776 567 – – 1,343
The amount originally stated for brands represents the fair value at the date of acquisition of brands since 1985. Other includes product registration,
distribution rights and capitalised product development costs.
The majority of brands, all of goodwill and certain other intangibles are considered to have indefinite lives for the reasons noted in the Accounting
Policies and accordingly are subject to an annual impairment review. A number of small non-core brands are deemed to have a finite life and are
amortised accordingly.
Reckitt Benckiser 200946
Notes to the accounts continued
10 GOODWILL AND OTHER INTANGIBLE ASSETS (CONTINUED)
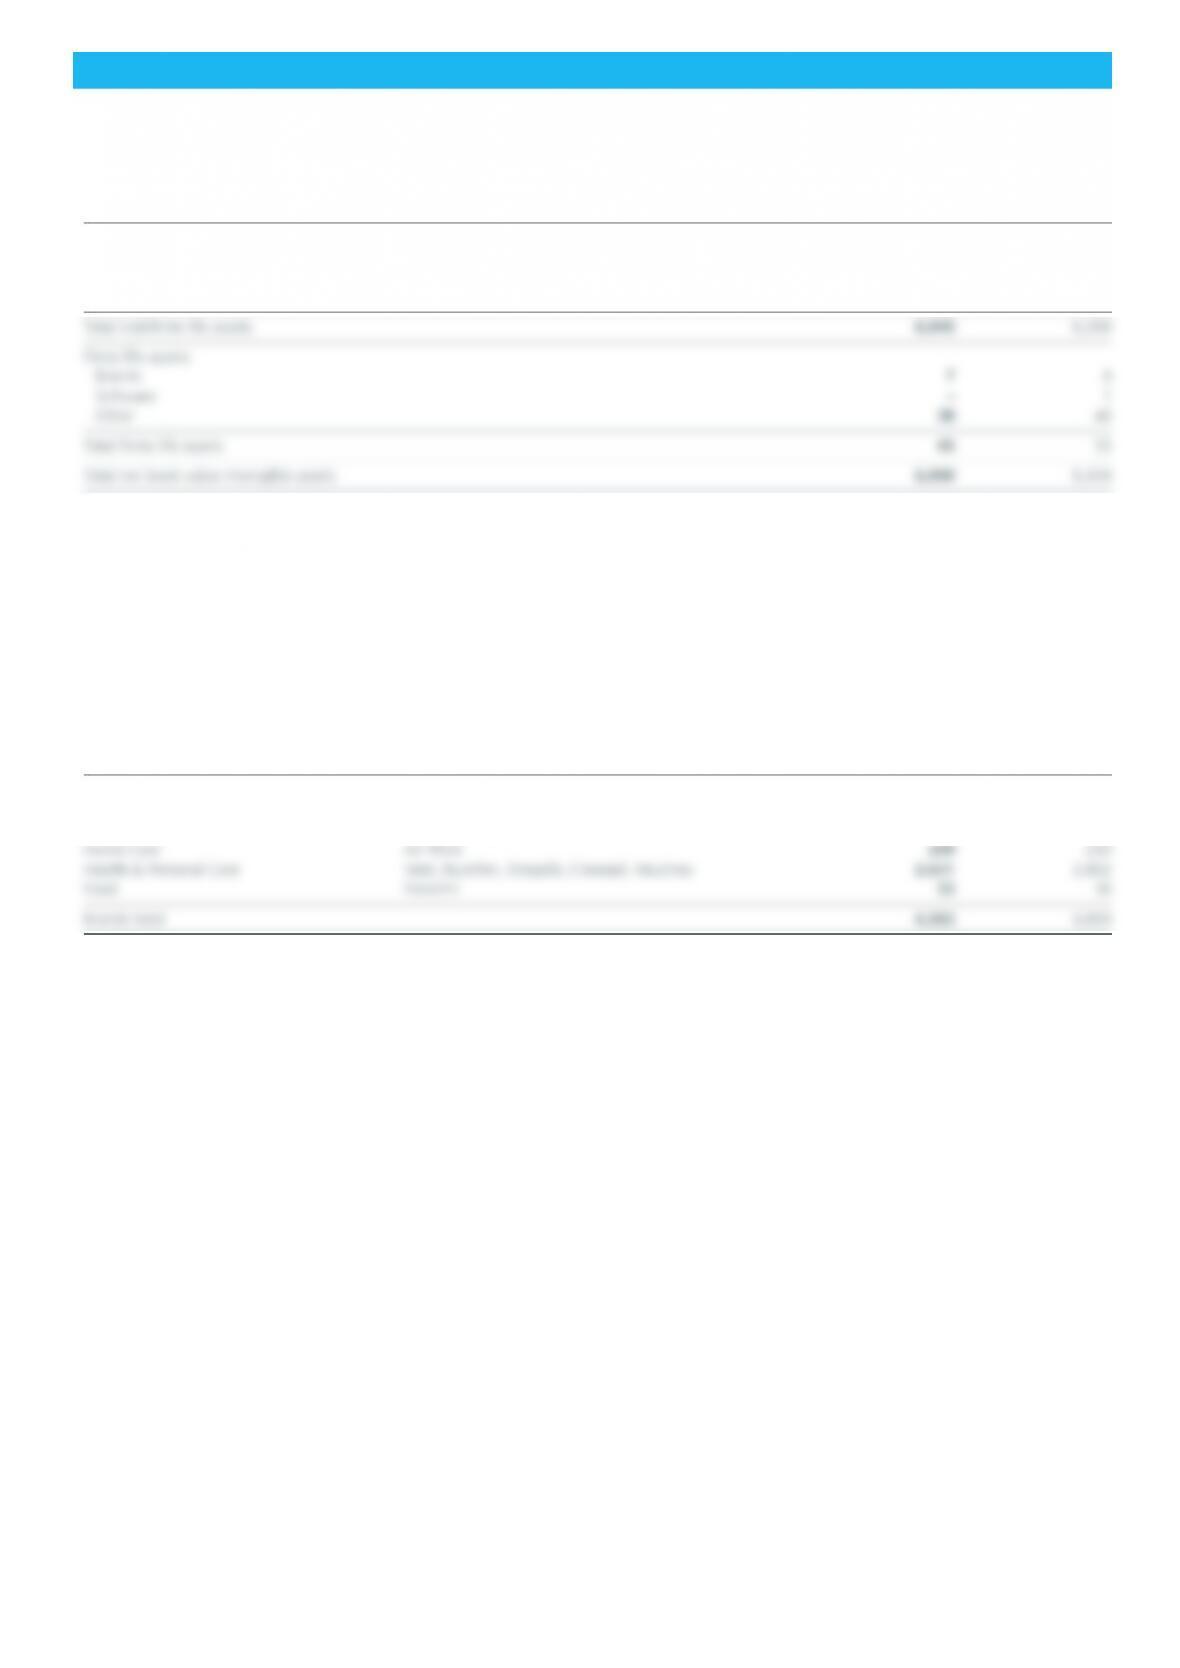
The net book values of indefinite and finite life assets are as follows:
2009 2008
Net book value £m £m
Indefinite life assets:
Brands 4,355 4,651
Goodwill 1,654 1,712
Other 36 36
The annual impairment review for goodwill and other intangible assets is based on an assessment of each asset’s value in use. Value in use is calculated
from cash flow projections based on historical operating results, short-term budgets, medium-term business plans (five years) and longer-term
extrapolation. The long-term extrapolations assume a growth rate of no more than the long-term inflation assumption for the relevant markets (range
of 1% – 4% (2008: 2%– 4%)). A pre-tax discount rate of 10% (2008: 12%) has been used in discounting the projected cash flows. A higher rate is
used where appropriate to reflect specific risks associated with the relevant product group range of 10%–18% (2008: 11%–17%). Key assumptions
(which are kept under constant review by management) in the impairment review include future sales volumes, growth rates and prices, and future
levels of marketing support required to sustain, grow and further innovate brands.
No reasonably possible change to a key assumption would cause any product group’s recoverable amount to be less than its carrying value.
An analysis of the net book value of brands by product group, which the Group considers cash generating units, is shown below:
2009 2008
Product group Key brands £m £m
Fabric Care Calgon, Vanish, Woolite 606 647
Surface Care Dettol, Lysol 670 745
Dishwashing Calgonit, Finish 193 209
The impairment charge for the year ended 31 December 2009 is £13m (2008: £ nil). Amortisation for the year ended 31 December 2009 is £8m
(2008: £8m). Of the Group’s total value of goodwill of £1,654m (2008: £1,712m), £1,619m (2008: £1,666m) relates to the Health & Personal Care
product group. No other product group contains a significant goodwill balance.
During 2009 £nil (2008: £nil) of development expenditure has been assessed as meeting the requirements of IAS 38. The net book value of internally
generated intangible assets included within other intangible assets, at 31 December 2009 is £5m (2008: £6m).
No borrowing costs have been capitalised as an intangible asset in 2009 (2008: £nil).
Reckitt Benckiser 2009 47
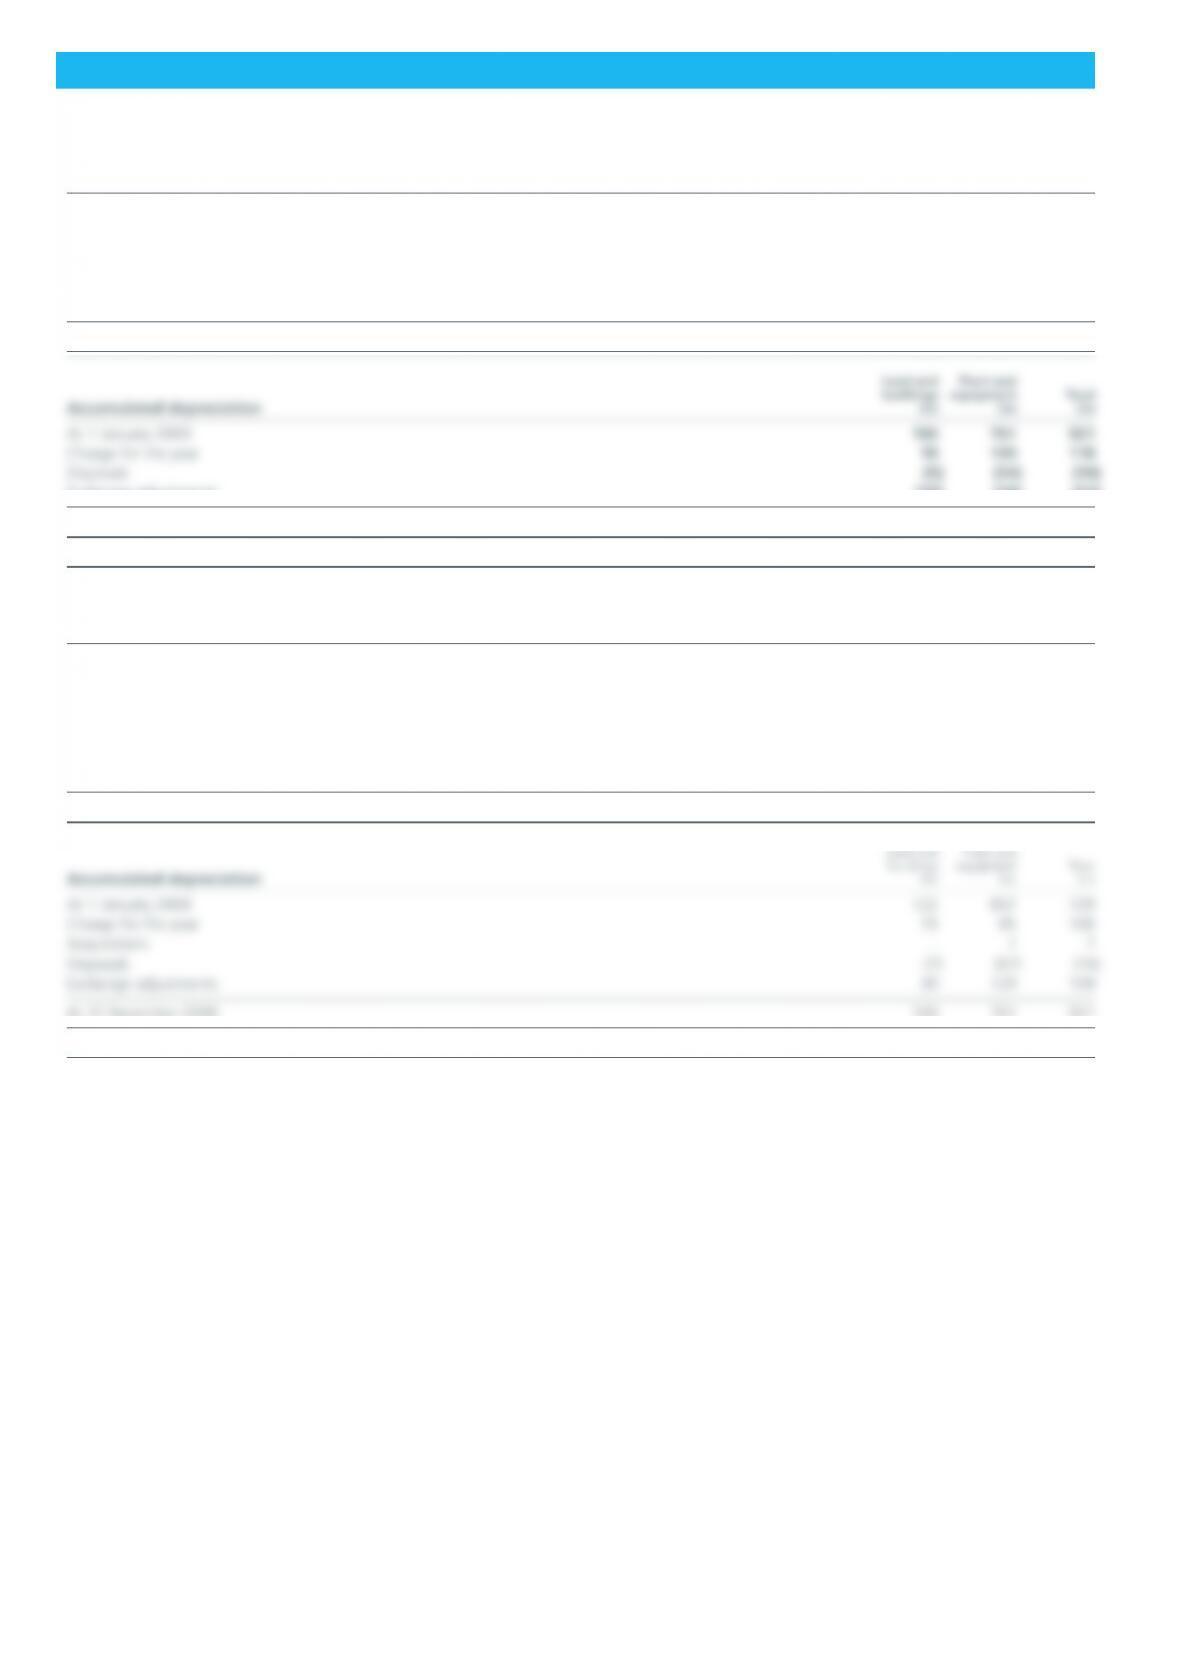
11 PROPERTY, PLANT AND EQUIPMENT
Land and Plant and
buildings equipment Total
£m £m £m
Cost or valuation
At 1 January 2009 416 1,142 1,558
Additions 18 138 156
Disposals (9) (61) (70)
Reclassifications 6 (6) –
Exchange adjustments (15) (63) (78)
At 31 December 2009 416 1,150 1,566
Exchange adjustments (15) (38) (53)
At 31 December 2009 158 769 927
Net book amount at 31 December 2009 258 381 639
Land and Plant and
buildings equipment Total
£m £m £m
Cost or valuation
At 1 January 2008 326 882 1,208
Additions 15 150 165
Acquisitions 2 11 13
Disposals (9) (74) (83)
Reclassifications 15 (15) –
Exchange adjustments 67 188 255
At 31 December 2008 416 1,142 1,558
At 31 December 2008 160 761 921
Net book amount at 31 December 2008 256 381 637
Included in plant and equipment are assets held under finance leases with a net book value of £6m (2008: £8m). The depreciation charge for assets
held under finance leases was £2m (2008: £3m).
Minimum lease payments for plant and equipment held under finance leases are £4m (2008: £5m) within one year and £2m (2008: £4m) in two
to five years. There are nil lease payments falling due after more than five years (2008: £nil).
No revaluations have taken place in 2009 or in 2008.
The net book amount of assets under construction is £42m (2008: £64m). Assets under construction are included within plant and equipment.
The reclassification from plant and equipment to land and buildings of £6m (2008: £15m) shows the transfer of completed assets.
The analysis of depreciation charge by income statement line is shown in note 3.
No borrowing costs have been capitalised as plant, property and equipment in 2009 (2008: £nil).
Capital expenditure which was contracted but not capitalised at 31 December 2009 was £16m (2008: £25m).

Reckitt Benckiser 200948
Notes to the accounts continued
12 INVENTORIES
2009 2008
£m £m
Total inventories 486 556
The cost of inventories recognised as an expense and included as cost of goods sold amounted to £2,922m (2008: £2,524m).
The Group inventory provision at 31 December 2009 was £42m (2008: £42m). All inventory that was provided for at 31 December 2008 was sold
or otherwise disposed of during 2009.
The Group does not have any inventories pledged as security for liabilities.
13 TRADE AND OTHER RECEIVABLES – CURRENT
2009 2008
Amounts falling due within one year £m £m
Trade receivables 834 804
Less: Provision for impairment of receivables (22) (13)
Trade receivables – net 812 791
Trade receivables consist of a broad cross section of our international customer base for whom there is no significant history of default. The credit risk of
customers is assessed at a subsidiary and Group level, taking into account their financial positions, past experiences and other relevant factors. Individual
customer credit limits are imposed based on these factors.
As of 31 December 2009, trade receivables of £71m (2008: £51m) were past due but not impaired. The ageing analysis of trade receivables past due
but not impaired is as follows:
2009 2008
£m £m
Up to 3 months 71 51
The carrying amounts of the Group’s trade and other receivables are denominated in the following currencies:
2009 2008
£m £m
Sterling 36 20
Euro 322 352
was £22m (2008: £13m). It was assessed that a portion of the receivables is expected to be recovered due to the nature and historical collection of
trade receivables. The ageing analysis of these receivables is as follows:
2009 2008
£m £m
Up to 3 months 15 14
Over 3 months 8 6
23 20
The movement in the provision for impaired receivables consists of increases for additional provisions offset by receivables written off and unused
provision released back to the income statement. The gross movements in the provision are considered to be insignificant.
The other receivables do not contain impaired assets. They consist of items including reclaimable turnover tax and other tax receivables, and are from
a broad selection of countries within the Group.
The maximum exposure to credit risk at the year end is the carrying value of each class of receivable mentioned above. The Group does not hold any
collateral as security.
Reckitt Benckiser 2009 49
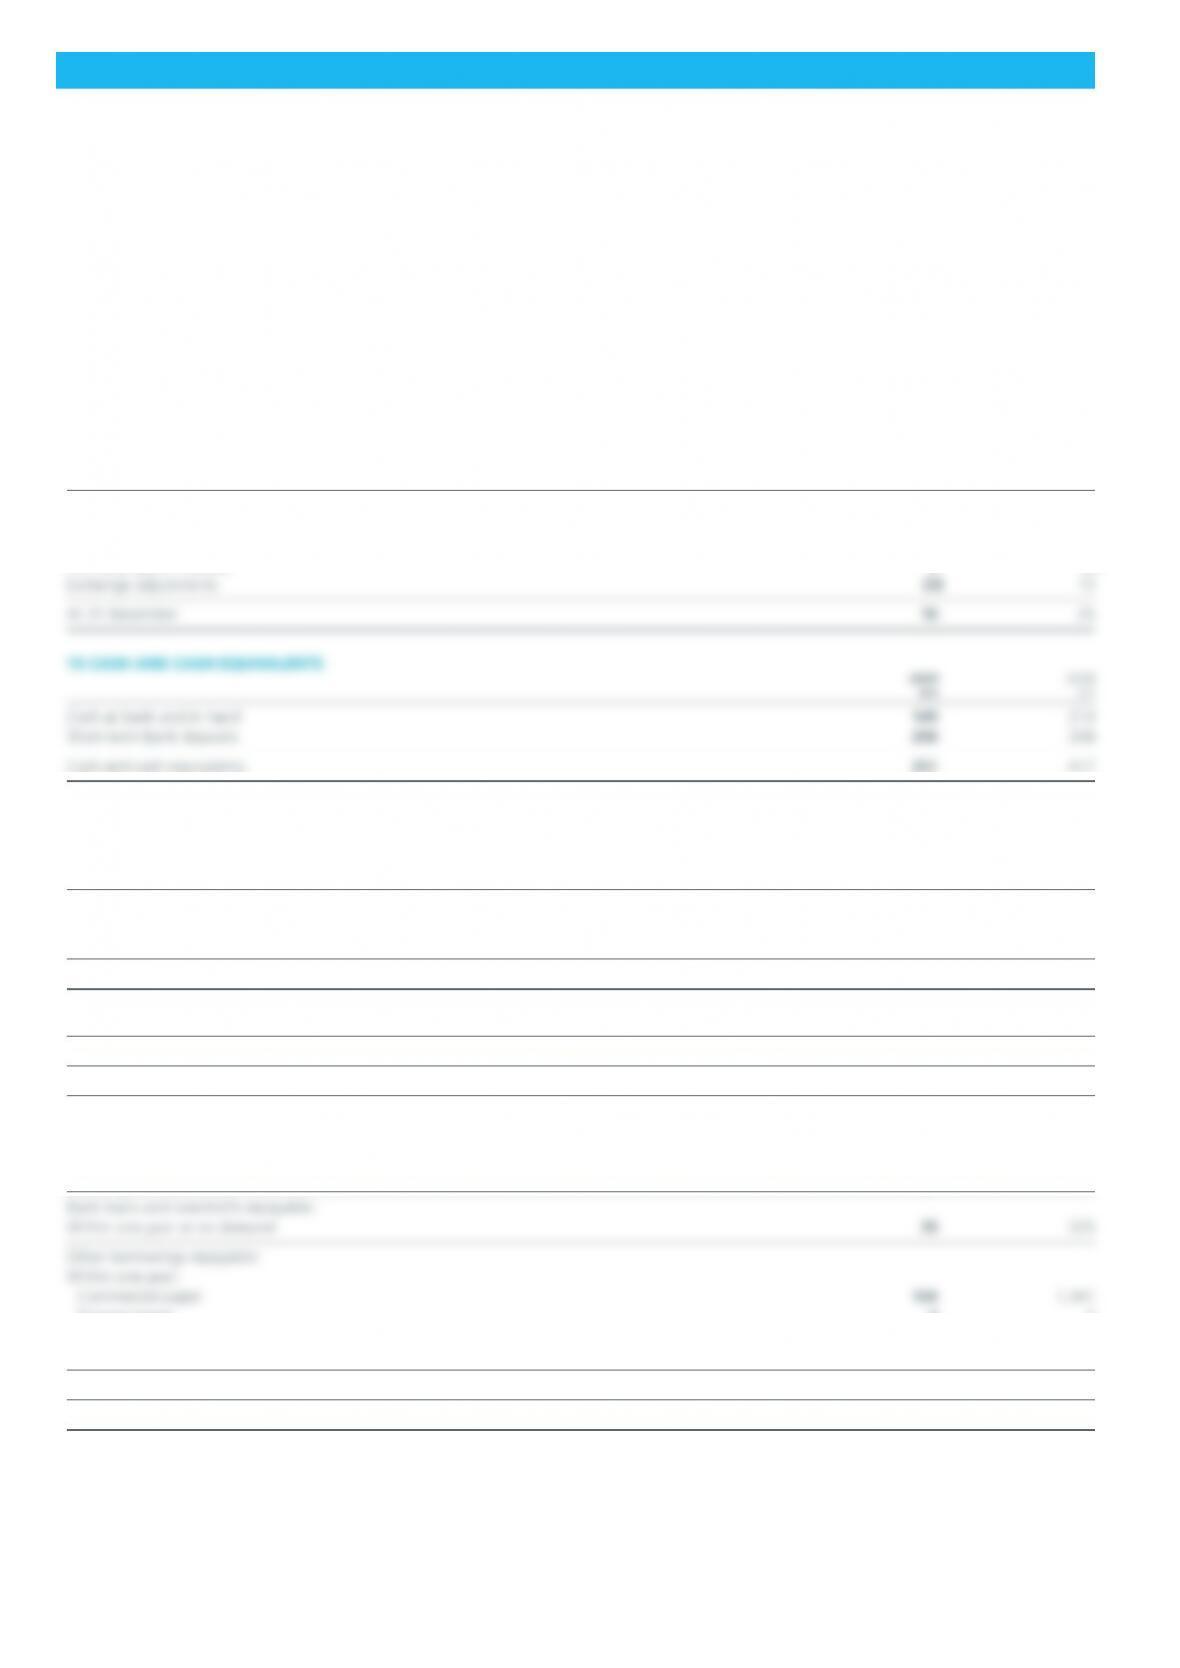
14 AVAILABLE FOR SALE FINANCIAL ASSETS
Current
These investments do not meet the requirements to be classified as cash equivalents due to having maturities of greater than three months.
They are, however, highly liquid assets, consisting solely of short-term deposits. All of these deposits are held with financial institutions with a BBB
rating or above. The effective interest rate on these short-term deposits is 4.48% (2008: 10.46%) and they have an average maturity of 204 days
(2008: 438 days) from inception.
Non-current
These investments are auction rate securities issued by US state authorities denominated in US dollars with redemption dates falling beyond 2010.
They are typically traded on a secondary market, however due to the current inactivity of this market there is uncertainty over whether they are likely
to be redeemed within one year and therefore have been classified as non-current.
Although these investments are not directly guaranteed by the US Federal Government, the underlying assets are. None of these investments are past
due or impaired.
The market for auction rate securities is inactive and therefore management has adopted a discounted cash flow valuation technique to determine
a fair value of the securities at 31 December 2009. The movement in the fair value of auction rate securities is detailed below:
2009 2008
£m £m
At 1 January 25 –
Acquisition – fair value – 35
Disposals (14) (17)
Fair value gains / (losses) 8 (8)
Due to foreign currency exchange restrictions £40m (2008: £50m) of cash included in cash and cash equivalents is restricted for use by the Group.
16 FINANCIAL LIABILITIES – BORROWINGS
2009 2008
Current £m £m
Bank loans and overdrafts(a) 26 225
Commercial paper(b) 104 1,341
Finance lease obligations 2 5
132 1,571
2009 2008
Non-current £m £m
Finance lease obligations 4 4
4 4
(a) Bank loans are denominated in a number of currencies, all are unsecured and bear interest based on relevant LIBOR equivalent.
(b) Commercial paper was issued in a number of currencies, all are unsecured and bear interest based on relevant LIBOR equivalent.
2009 2008
Maturity of debt £m £m
Finance leases 2 5
Between two and five years:
Finance leases (payable by instalments) 4 4
110 1,350
Gross borrowings (unsecured) 136 1,575

Reckitt Benckiser 200950
Notes to the accounts continued
17 PROVISIONS FOR LIABILITIES AND CHARGES
Restructuring Other Total
provision provisions provisions
£m £m £m
At 1 January 2008 36 19 55
Charged to the income statement 38 – 38
Transfers – 19 19
Utilised during the year (26) (18) (44)
Exchange adjustments (2) (3) (5)
At 31 December 2009 52 72 124
Provisions have been analysed between current and non-current as follows:
2009 2008
£m £m
Current 88 73
Non-current 36 31
124 104
Other provisions include an onerous lease provision expiring in 2016 of £8m (2008: £8m). The remainder of the balance relates to various legal,
environmental and other obligations throughout the Group, the majority of which are expected to be utilised within five years.
The restructuring provision relates to further restructuring of configuration in the Group. The majority is expected to be utilised in 2010.
18 TRADE AND OTHER PAYABLES
2009 2008
£m £m
Trade payables 790 882
Other payables 106 64
Other tax and social security payable 98 91
Derivative financial instruments 5 3
Accruals 1,287 1,149
2,286 2,189
20 21
Reckitt Benckiser 2009 51
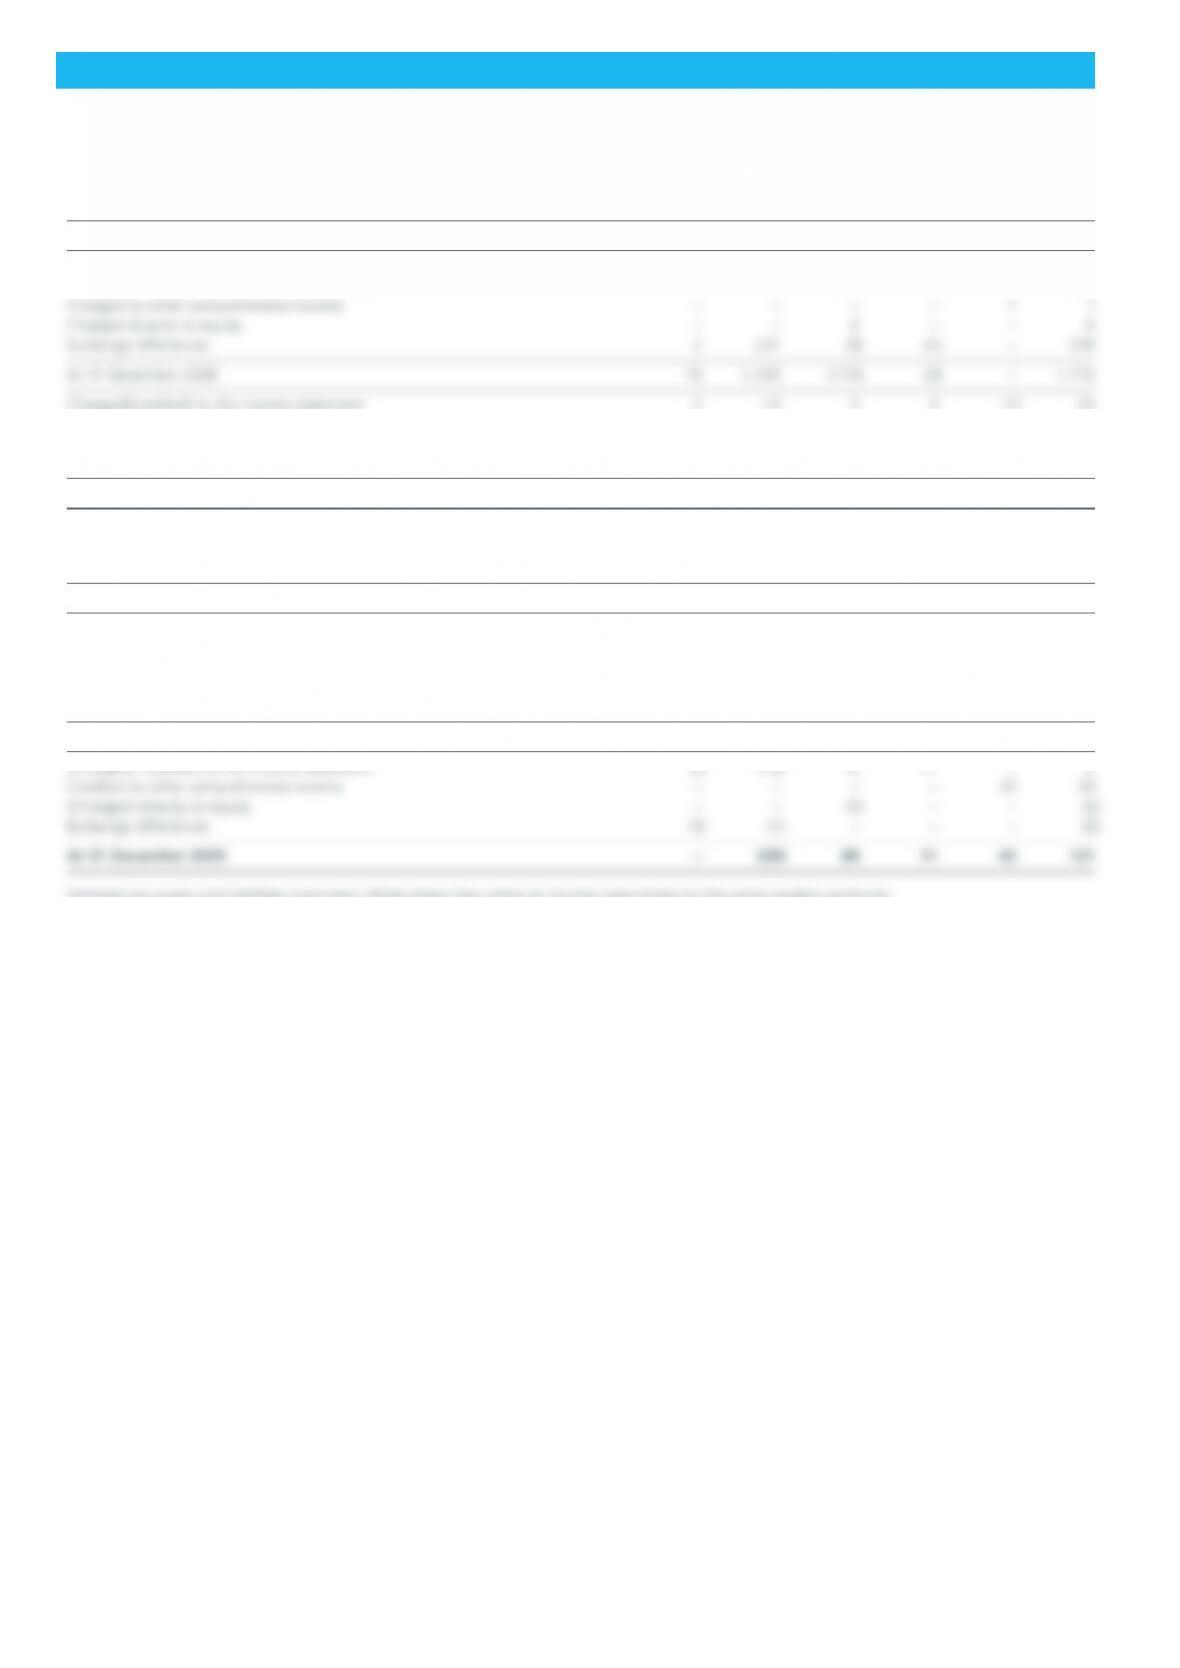
20 DEFERRED TAX
Accelerated Short-term Retirement
capital Intangible temporary benefit
allowances assets differences Tax losses obligations Total
Deferred tax liabilities £m £m £m £m £m £m
At 1 January 2008 12 798 (96) (8) (1) 705
Acquisition – 254 – – – 254
Charged / (credited) to the income statement 5 46 (81) 6 – (24)
(Credited) to other comprehensive income – – – – (1) (1)
(Credited) directly to equity – – (2) – – (2)
Exchange differences (2) (58) 13 – 1 (46)
At 31 December 2009 19 1,290 (163) – (1) 1,145
Accelerated Short-term Retirement
capital Intangible temporary benefit
allowances assets differences Tax losses obligations Total
Deferred tax assets £m £m £m £m £m £m
At 1 January 2008 4 (9) 112 – (1) 106
Acquisition – – 31 – – 31
Credited / (charged) to the income statement 3 6 (50) – (2) (43)
Credited to other comprehensive income – – – – 11 11
(Charged) directly to equity – – (17) – – (17)
Exchange differences 2 2 1 – – 5
At 31 December 2008 9 (1) 77 – 8 93
Deferred tax assets and liabilities have been offset where they relate to income taxes levied by the same taxation authority.
The current element of deferred tax is considered to be within short term temporary differences and tax losses.
Certain deferred tax assets totalling £16m (2008: £47m) in respect of overseas corporation tax losses and other temporary differences have not been
recognised at 31 December 2009 as the likelihood of future economic benefit is not sufficiently assured. These assets will be recognised if utilisation of
the losses and other temporary differences becomes reasonably certain.
No deferred tax liability has been recognised on the unremitted earnings of overseas subsidiaries as no tax is expected to be payable on them in the
foreseeable future based on the current repatriation policy of the Group.
Reckitt Benckiser 200952
Notes to the accounts continued
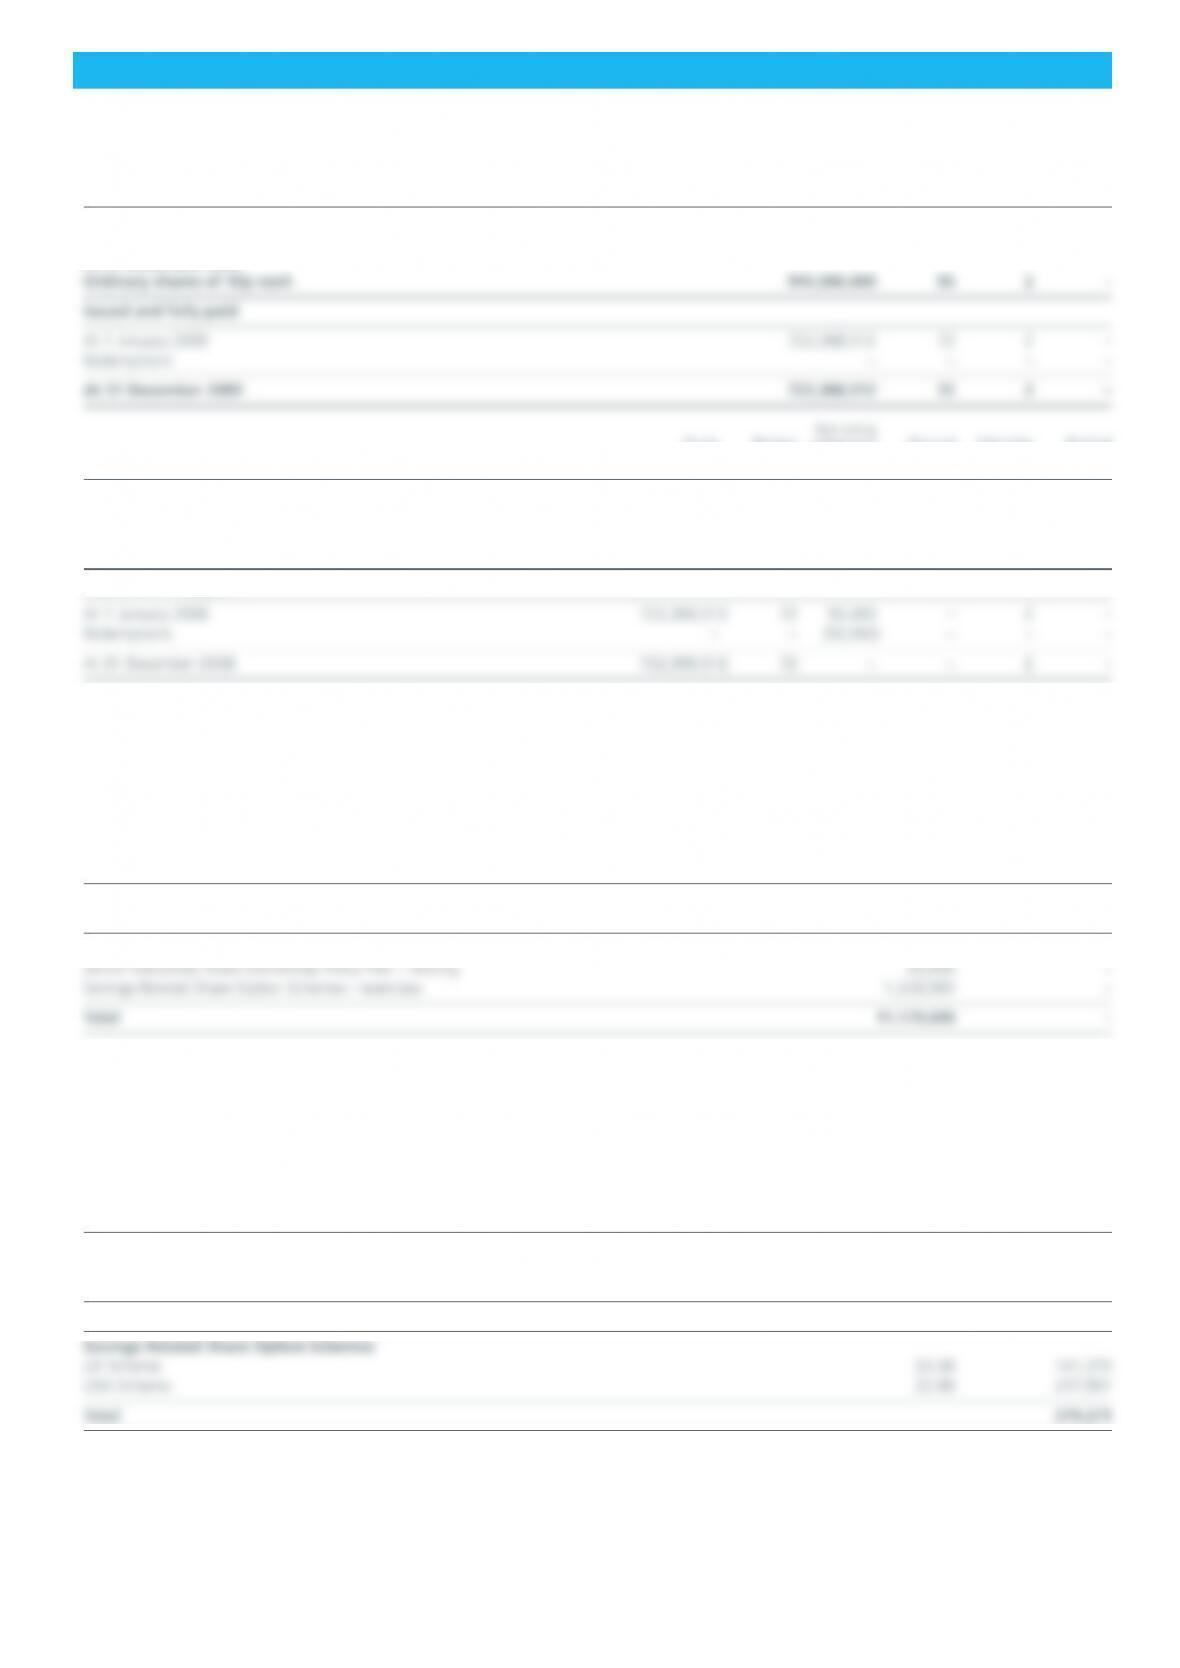
21 SHARE CAPITAL
Equity Nominal Subscriber Nominal
ordinary value ordinary value
Authorised shares £m shares £m
At 1 January 2009
Ordinary shares of 10p each 945,500,000 95 2 –
At 31 December 2009
Equity Nominal redeemable Nominal Subscriber Nominal
ordinary value preference value ordinary value
Authorised shares £m shares £m shares £m
At 1 January 2008
Ordinary shares of 10p each 945,500,000 95 – – 2 –
At 31 December 2008
Ordinary shares of 10p each 945,500,000 95 – – 2 –
Issued and fully paid
The holders of ordinary shares are entitled to receive dividends as declared from time to time and are entitled to one vote per share at meetings of the
parent company.
Release of Treasury shares
During the year ordinary shares were released from Treasury to satisfy vestings/exercises under the Company’s various share schemes as follows:
Number Consideration
Ordinary shares of 10p of shares £m
Executive Share Options – exercises 8,092,050 –
Restricted Shares Awards – vesting 1,808,663 –
Total under Executive Share Option and Restricted Share Schemes 9,900,713 –
Market purchases of shares
During 2009, there were no repurchases of shares as the Group suspended its share buy back programme. 11,179,696 Treasury shares have been used
to satisfy vestings/exercises during the year under the Group’s various share schemes. This leaves a balance of 2,441,842 held as Treasury shares at 31
December 2009 (2008: 13,621,538).
Options and restricted shares granted during the year
Options and restricted shares which may vest or become exercisable at various dates between 2013 and 2019 were as follows:
Number
Price to be paid of shares
£ under option
Long-Term Incentive Plan 2007 (granted July 2009) – restricted shares – 7,500
Long-Term Incentive Plan 2007 (granted December 2009) – share options 31.65 4,020,400
Long-Term Incentive Plan 2007 (granted December 2009) – restricted shares – 1,985,200
Total 6,013,100

Reckitt Benckiser 2009 53
21 SHARE CAPITAL (CONTINUED)
Options and restricted shares unvested/unexercised at 31 December 2009
Options and restricted shares which have vested or may vest at various dates between 2009 and 2019 are as follows:
Price to be paid £ Number of shares under option
Executive share option and restricted share schemes From To 2009 2008
Reckitt & Colman Schemes 7.140 12.140 – 23,931
Benckiser Initial Options Award Agreement 29 September 1999 7.040 – 200,000
Reckitt Benckiser 1999 Share Option Plan – Initial Grant 7.220 – 24,500
Reckitt Benckiser 1999 Share Option Plan – Annual Grant 5.538 18.100 3,193,608 10,837,587
Reckitt Benckiser Restricted Share Plan – Annual Grant – 72,200 1,963,295
Reckitt Benckiser Long-term Incentive Plan 2007 – Annual Grant – restricted shares – 5,125,249 3,779,106
Reckitt Benckiser Senior Executives Share Ownership Policy Plan 130,000 110,000
24,649,907 30,601,620
Price to be paid £ Number of shares under option
Savings-related share option schemes From To 2009 2008
Those Benckiser options which were granted prior to the merger on 3 December 1999 were granted over Benckiser N.V. B shares. On the merger, these
options converted to options over ordinary shares at a ratio of five ordinary shares for every Benckiser N.V. B share with a matching exercise price
adjustment. In the tables above the outstanding Benckiser options have been stated at their equivalent Reckitt Benckiser Group plc number of options
and their exercise prices have been adjusted accordingly.
Executive Share Options are awarded at an exercise price determined on grant and payable on exercise following satisfaction of performance criteria.
Restricted share awards entitle the recipient to receive shares at no cost following satisfaction of performance criteria.
22 RETAINED EARNINGS AND OTHER RESERVES
Within all subsidiaries of the Group there were statutory, contractual or exchange control restrictions limiting the parent company’s access to distributable
profits of £3,026m (2008: £2,829m). The reserves of subsidiary undertakings have generally been retained to finance their businesses. There were
£294m of Treasury shares at 1 January 2009. £131m were issued to satisfy Executive Share Options exercised. £163m of Treasury shares were carried
forward at 31 December 2009.
Reserves
The original merger reserve arose in 1999 following the combination of Reckitt & Colman plc and Benckiser N.V. to form Reckitt Benckiser plc.
This transaction was accounted for as a merger. During the year ended 31 December 2007 there was a debit of £14,371m to the merger reserve
as a result of the Group reconstruction which was treated as a merger under Section 425 of the Companies Act 1985.
The hedging reserve comprises the effective portion of the cumulative net change in fair value of cash flow hedging instruments related to hedge
transactions that are extant at year end.
Available for sale reserve represents fair value gains and losses on the non current available for sale financial assets.
The foreign currency translation reserve contains the accumulated foreign exchange differences from the translation of the financial statements of the
Group’s foreign operations arising when the Group’s entities are consolidated. The reserve also contains the translation of liabilities that hedge the
Group’s net exposure in a foreign currency.
A £12m reclassification has been made between foreign currency translation reserve and retained earnings in 2008, relating to tax on foreign currency
translation reserve previously included in retained earnings.
23 EQUITY MINORITY INTERESTS
2009 2008
£m £m
At 1 January 2 2
Purchase of minority shareholdings – –
As at 31 December 2 2
Reckitt Benckiser 200954
Notes to the accounts continued
24 FINANCIAL INSTRUMENTS AND FINANCIAL RISK MANAGEMENT
Financial instruments by category
Derivatives Fair value Carrying Fair
Loans and used for through Available value value
receivables hedging the P&L for sale total total
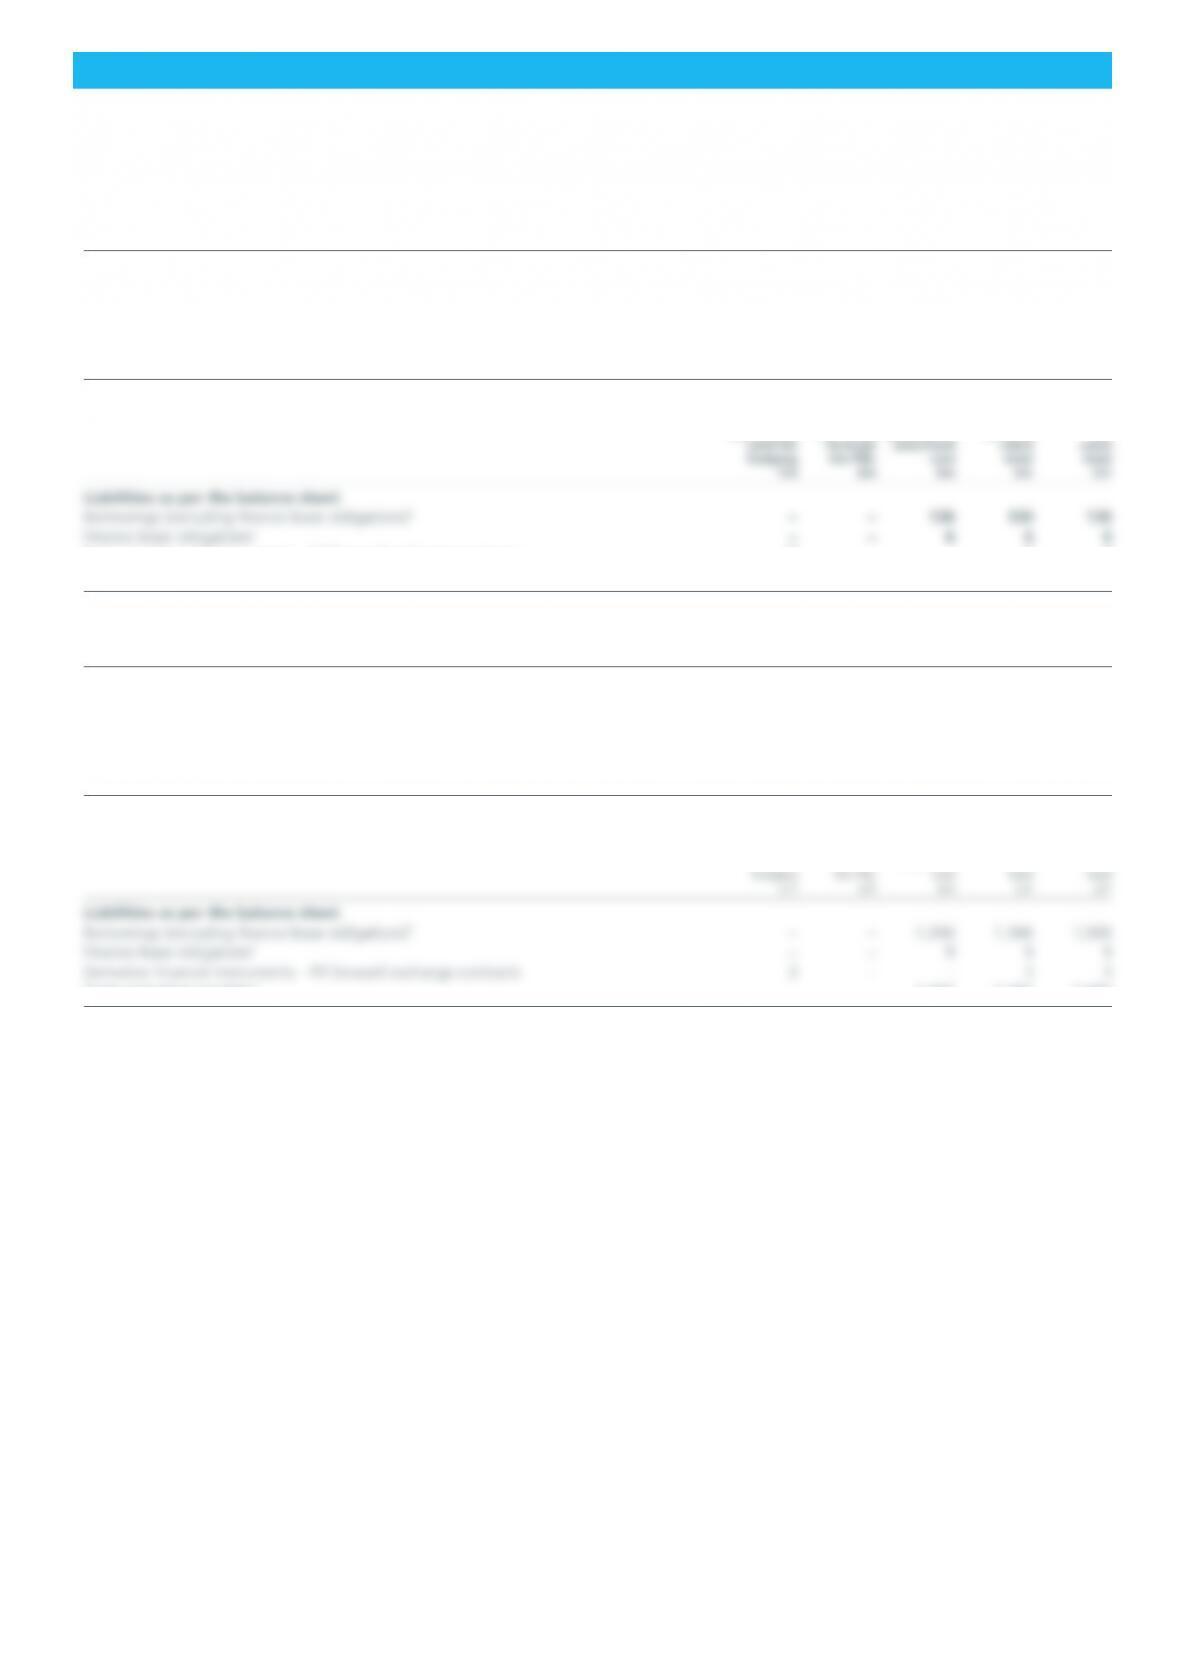
At 31 December 2009 £m £m £m £m £m £m
Assets as per the balance sheet:
Auction rate securities – – – 16 16 16
Short-term deposits – – – 4 4 4
Trade and other receivables1 896 – – – 896 896
Derivative financial instruments – FX forward exchange contracts – 3 1 – 4 4
Cash and cash equivalents 351 – – – 351 351
Other
financial
Derivatives Fair value liabilities at Carrying Fair
Derivative financial instruments – FX forward exchange contracts 5 – – 5 5
Trade and other payables3 – – 2,156 2,156 2,156
Derivatives Fair value Carrying Fair
Loans and used for through Available value value
receivables hedging the P&L for sale total total
At 31 December 2008 £m £m £m £m £m £m
Assets as per the balance sheet
Auction rate securities – – – 25 25 25
Short-term deposits – – – 6 6 6
Trade and other receivables1 877 – – – 877 877
Derivative financial instruments – FX forward exchange contracts – 16 53 – 69 69
Cash and cash equivalents 417 – – – 417 417
Other
financial
Derivatives Fair value liabilities at Carrying Fair
used for through amortised value value
Trade and other payables3 – – 2,087 2,087 2,087
1 Prepayments and accrued income are excluded from the trade and other receivables balance as the analysis above is required only for
financial instruments.
2 The categories in this disclosure are determined by IAS 39. Finance leases are outside the scope of IAS 39, but they remain within the scope
of IFRS 7. Therefore finance leases have been shown separately.
3 Only includes trade and other payables classified as financial liabilities.
The carrying value less impairment provision of investments, current borrowings, cash at bank, trade receivables and payables are assumed
to approximate their fair values due to their short-term nature.