77
Annual Report 2009
Group management report » Forecast
offer our customers added value. And we have a well filled
pipeline of innovative products that we intend to launch
onto the markets of all three business sectors this year.
Further opportunity lies in our strict focus on cost and
our willingness to constantly scrutinize and analyze the sta–
tus quo. From the results of such investigations we regularly
find further potential for cost reductions, capacity adjust-
ments and the elimination of marginal business activities
and minor brands from our portfolio.
Opportunity is also likely to arise from the consistent
pursuit and implementation of our three strategic priorities,
as explained in some detail in the section entitled “Strategy
and financial targets 2012” on pages 34 to 36.
Further specific opportunities and risks are discussed
in the individual business sector reports starting on
page 58.
Outlook for the Henkel Group in 2010
In our opinion, the mildly encouraging market conditions
prevailing in the real economy and on the financial markets
are still fragile. Consequently, we are unable to accurately
gage the overall economic situation and the further devel-
opments that are likely to take place.
Our guidance for the current financial year is based
on the assumption of moderate economic growth overall.
We do not expect to see a sustained upturn or any major
growth dynamic.
It is against this background that our expectations for
the development of the Henkel Group for 2010 should be
considered:
We are confident of again outperforming our relevant
markets in terms of organic sales growth (i.e. after adjusting
for foreign exchange and acquisitions/divestments). The basis
for this confidence is provided by our strong competitive
position. This we have consolidated and further extended
in recent years through our innovative strength, our strong
brands, our leading market positions and the quality of
our portfolio.
In recent years, we have introduced a number of mea–
sures on the operational side which we expect to generate
positive momentum: for example, we anticipate addition–
al contributions to our profitability to emanate from our
“Global Excellence” efficiency enhancement program, the
synergies arising from the integration of the National Starch
businesses, and our strict cost discipline. All these factors
We are more confident about the development of the elec-
tronics industry. The recovery of the sector, which has been
in evidence for some months now, can be expected to con-
tinue, albeit from a still low base. We anticipate that many
companies will be investing more in new communication
and information technologies after their reluctance over
the last year, particularly as a certain degree of backlog
demand has built up.
The metal processing industry will, in 2010, experience
no more than sluggish expansion according to our estimates.
Although investments will be made in new machinery and
equipment for the purpose of rationalization or replace–
ment, more extensive expenditures will be required before
faster growth can be achieved. However, such investments
will only be made in the prospect of a durable upturn, of
which there is as yet little sign.
Growth in the packaging sector will, in our view, be
below that of industry overall. Here, the expected low level
of consumption growth is likely to exert a major influence,
due to the fact that a substantial portion of demand for
packaging comes from the food and semi-luxuries sectors.
The industry-related packaging segment should, by our
reckoning, experience a somewhat stronger increase in
production levels.
Our forecast for the construction industry is for a slight
increase in output. The financial packages of last year will
still generate a positive effect on developments in 2010, and
the building investments of industry should slightly increase
as confidence improves. However, as the year progresses,
the structural problems of both the residential and – due
to increasingly scarce public funds – the publicly financed
building sectors could come more to the forefront.
Opportunities
Accompanying the risks, we also see opportunities for our
businesses:
We perceive the growth regions as holding great poten–
tial for us. These offer above-average growth possibilities
from which we hope to benefit through our local business
activities. This especially applies to the regions of Eastern
Europe and Africa/Middle East, with Asia and Latin America
also part of the group.
We regard our research and development activities as
a great source of opportunity. We are developing a steady
stream of innovative products and product solutions that
78 Annual Report 2009
Group management report » Forecast / Subsequent events
Long-term sales and profits forecast:
Financial targets for 2012
In placing our focus on our three strategic priorities de–
veloped in 2008, and given the progress made to date in
their achievement, we have laid the foundation for future
profitable growth.
We expect that after 2010, during which a degree of moder–
ate growth is likely, the world economy will – in the course
of 2011 and 2012 – return to long-term growth of around
3 to 4 percent per year.
Based on this assumption, we will be aiming in the com–
ing years to achieve an average organic growth rate of 3 to
5 percent above the rate of growth of the markets of rel–
evance to us. Due to the expected savings emanating from
the “Global Excellence” efficiency enhancement program,
the synergies arising from the integration of the National
Starch businesses and numerous additional measures geared
to achieving our full business potential, we are confident
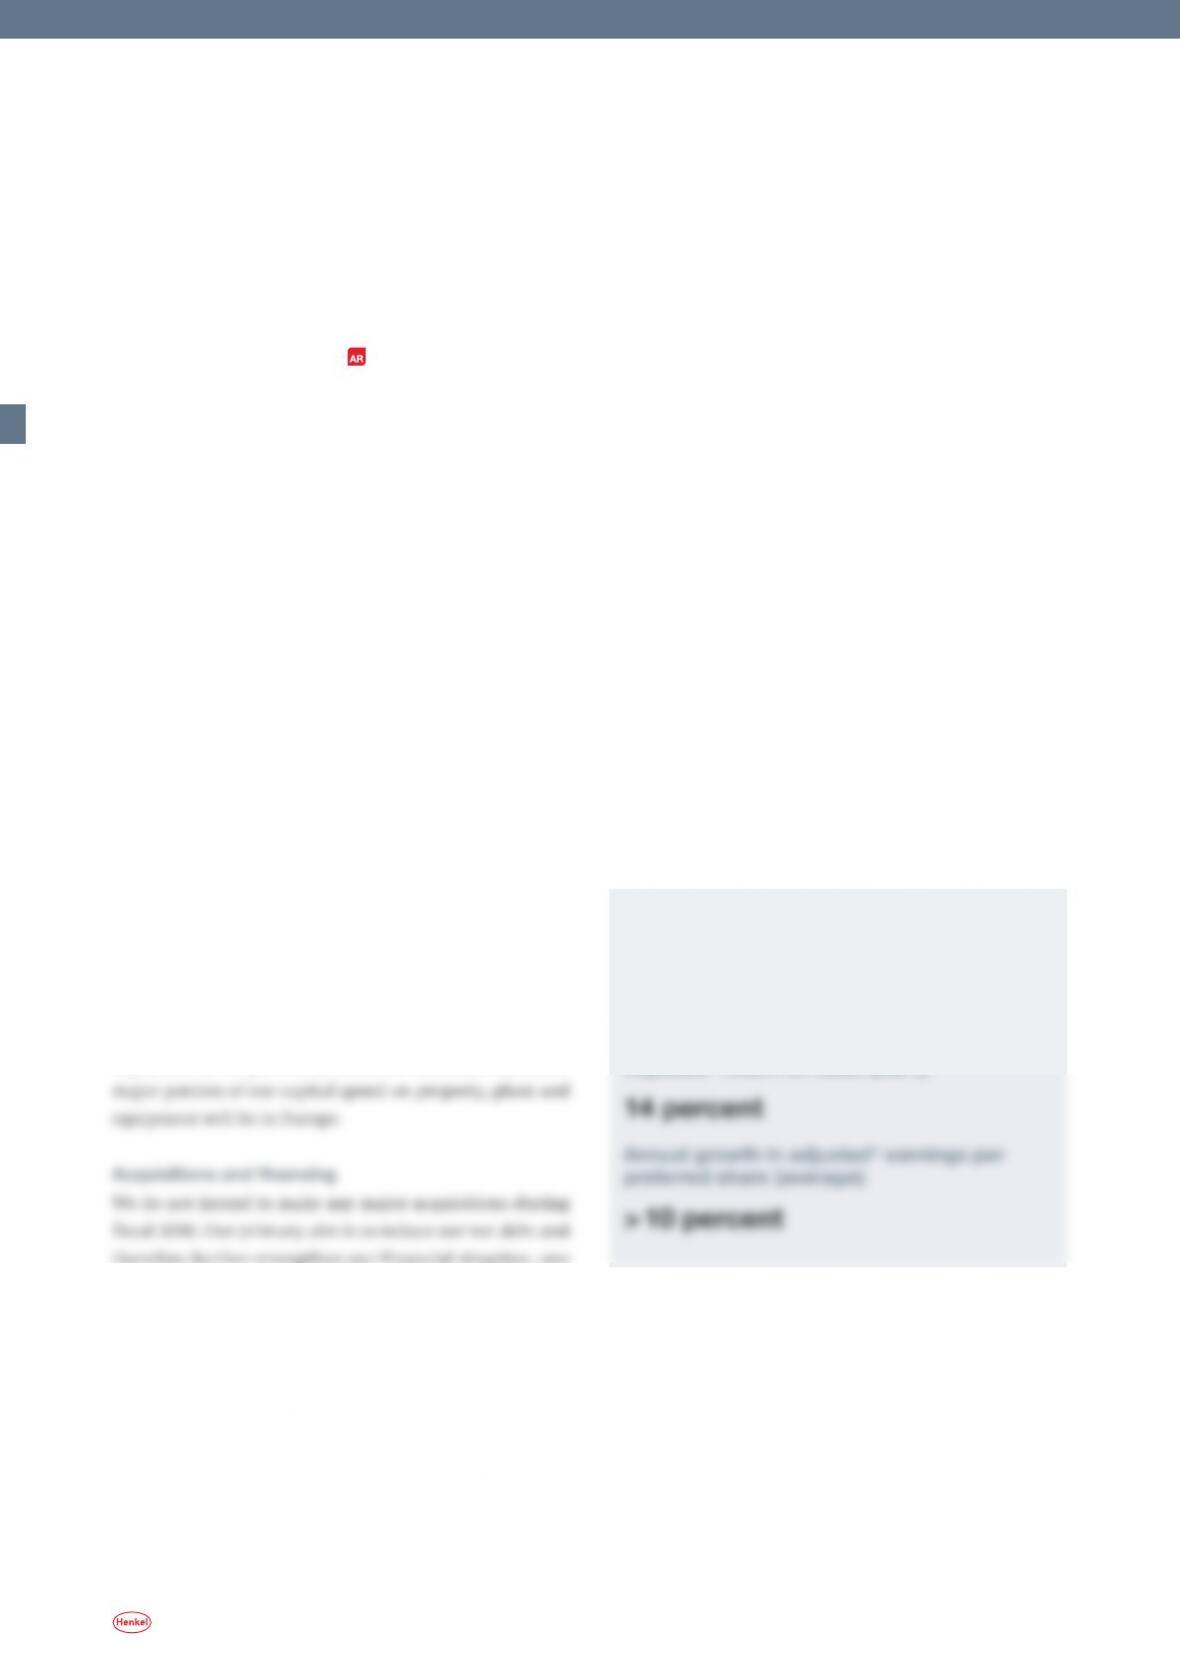
that, by 2012, we will also have met our targets of an ad–
justed1) return on sales (EBIT) of 14 percent and an average
annual increase in adjusted1) earnings per preferred share
(EPS) in excess of 10 percent per year.
Subsequent events
There were no notifiable events between the balance sheet
date (December 31, 2009) and the preparation date (Janu–
ary 29, 2010).
will positively influence the development of our adjusted1)
operating profit (EBIT) and adjusted
1)
earnings per preferred
share (EPS). We expect both metrics to undergo a noticeable
improvement compared to the levels of 2009.
We detail further specific expectations in the business
sector summaries starting on page 58.
Dividends
Our dividends and distribution policy is primarily aligned
to earnings after deducting minority interests and adjusting
for exceptional items. The objective is to maintain a payout
ratio of around 25 percent.
Research and development
Irrespective of the current economic climate, the develop-
ment of innovative products is an essential activity for our
business. Consequently, we plan to invest around 2.8 percent
of our gross sales in R&D.
Capital expenditures
We intend to invest around 350 million euros in the prop-
erty, plant and equipment of our continuing operations
during the current financial year. Major investments at the
Laundry & Home Care and Cosmetics/Toiletries business
sectors are to be channeled into production facilities for the
manufacture of innovative, sustainable product lines, as well
as into structural optimization measures. The 2010 invest-
ment focus in the case of the Adhesive Technologies business
sector will be on further consolidation and rational ization
of our adhesives production capability, and on production
expansion in our growth markets. For structural reasons, a
therefore further strengthen our financial situation, one
of our goals in this context being to achieve and maintain
a credit rating in the “A flat” range.
1) Adjusted for one-time charges/gains and restructuring charges
Financial targets for 2012
Annual organic sales growth (average):
3 – 5 percent
Adjusted1) return on sales (EBIT):

79
Annual Report 2009
84 Group segment report by business sector
85 Group segment report by region
86 Consolidated changes in intangible assets,
property, plant and equipment and financial
assets
87 Accounting principles and methods applied
in preparation of the consolidated financial
statements
91 Notes to the consolidated statement of income
95 Notes to the consolidated balance sheet
119 Supplementary information on the consolidated
statement of income / balance sheet
130 Recommendation for the approval of the annual
financial statements and the appropriation of the
profit of Henkel AG & Co. KGaA
131 Annual financial statements of
Henkel AG & Co. KGaA (summarized)
132 Auditor’s report
133 Responsibility statement
134 Corporate management of Henkel AG & Co. KGaA
80 Consolidated statement of income
81 Consolidated balance sheet
82 Consolidated cash flow statement
83 Statement of comprehensive income
83 Statement of changes in equity
Consolidated financial statements » Subindex
Consolidated financial statements subindex
80 Annual Report 2009
Consolidated financial statements » Consolidated statement of income
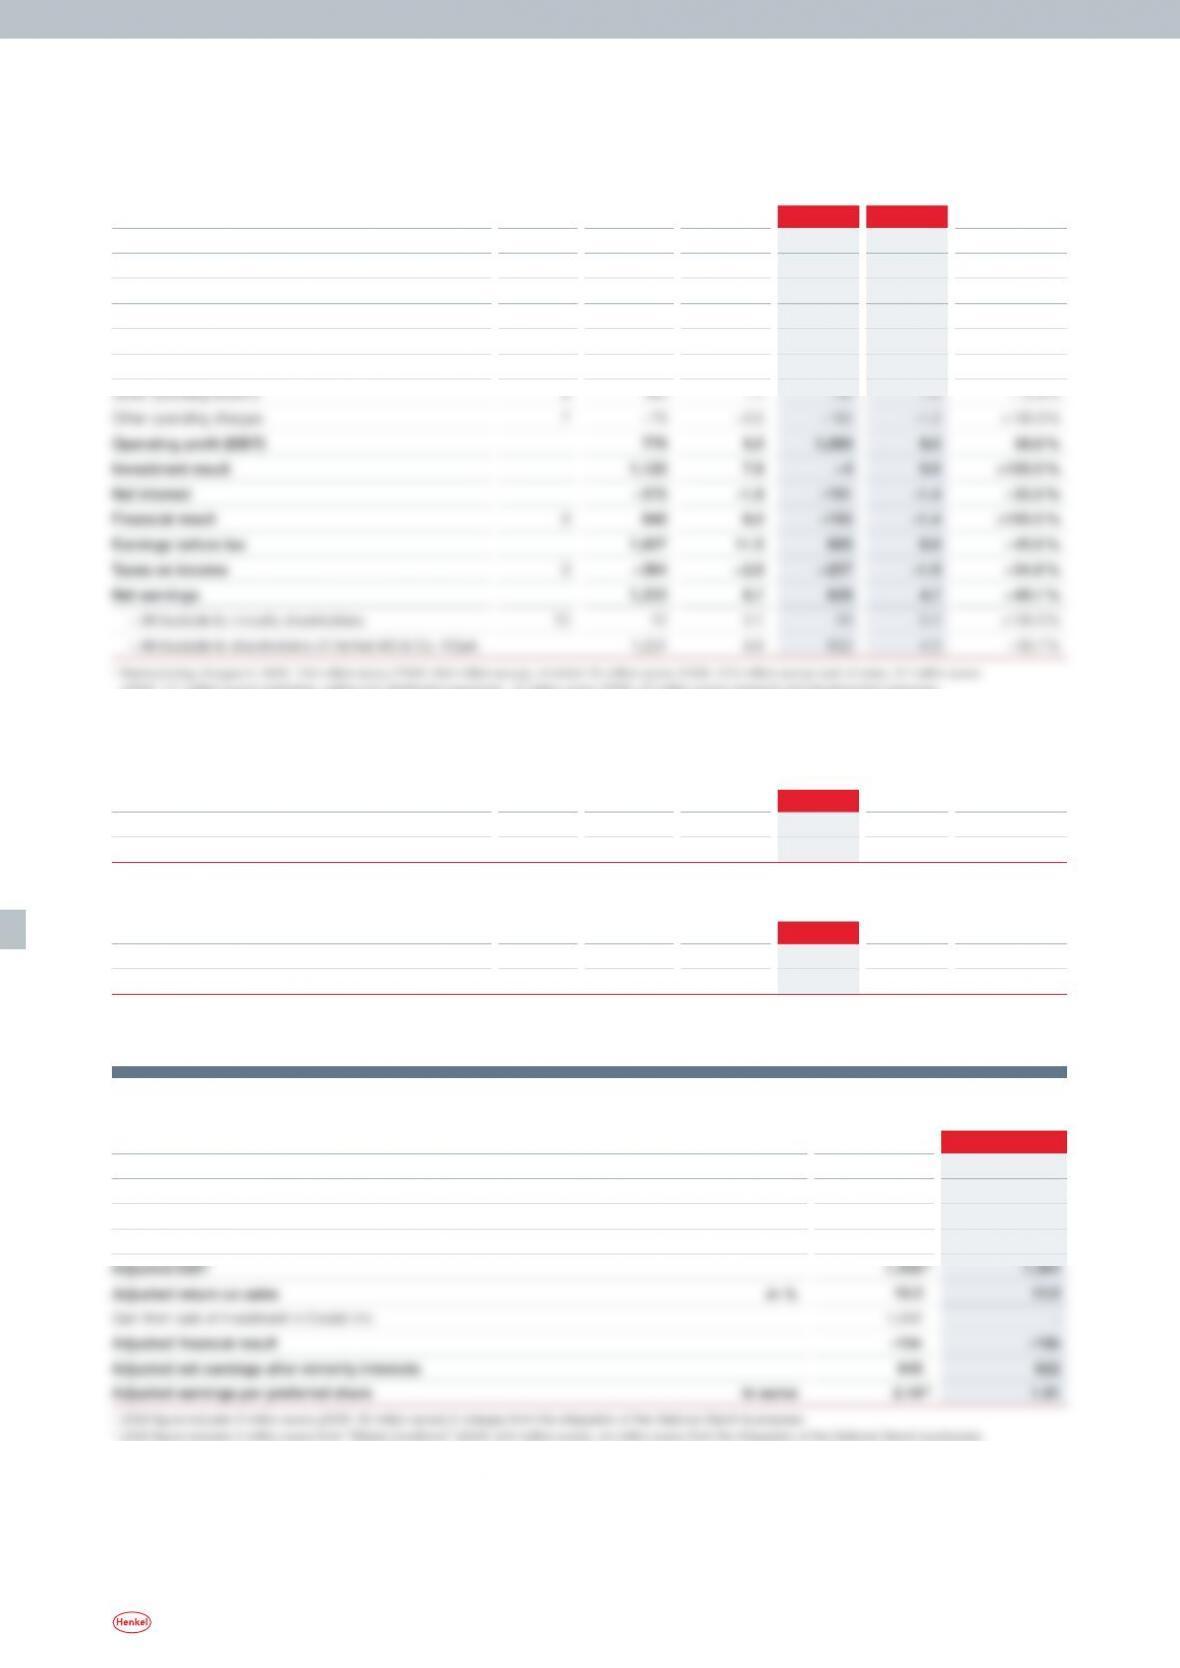
Consolidated statement of income
in million euros Note 2008 % 2009 % Change
Sales
1
14,131 100.0 13,573 100.0 – 3.9 %
Cost of sales1) 2 – 8,190 – 58.0
– 7,411 – 54.6
– 9.5 %
Gross profit 5,941 42.0 6,162 45.4 3.7 %
Marketing, selling and distribution expenses
1) 3 – 3,993 – 28.3
– 3,926 – 28.9
–1.7 %
Research and development expenses
1) 4 – 429 – 3.0
–396 – 2.9
– 7.7 %
Administrative expenses
1) 5 – 825 – 5.8
–735 – 5.4
–10.9 %
(2008: 111 million euros) marketing, selling and distribution expenses, 13 million euros (2008: 52 million euros) research and development expenses,
24 million euros (2008: 127 million euros) administrative expenses
Earnings per share (basic)
in euros Note 2008 2009 Change
Ordinary shares 46
2.81 1.38
– 50.9 %
Non-voting preferred shares 46
2.83 1.40
– 50.5 %
Earnings per share (diluted)
in euros Note 2008 2009 Change
Ordinary shares 46 2.79
1.38
– 50.5 %
Non-voting preferred shares 46 2.81
1.40
– 50.1 %
Additional voluntary information
in million euros 2008 2009
EBIT (as reported) 779 1,080
One-time gains
– 30 – 9
One-time charges
1)
48 134
Restructuring charges
2)
663 159
(2008: 142 million euros), 59 million euros from the reorganization of the Adhesive Technologies businesses in Europe (2008: 0 million euros) and 56 million euros
from ordinary activities (2008: 17 million euros)
3)
Adjusted EBIT 1,495 million euros and adjusted earnings per preferred share 2.26 euros, both before amortization of intangible assets from the acquisition of the National
Starch businesses
81
Annual Report 2009
Consolidated financial statements » Consolidated balance sheet
Consolidated balance sheet
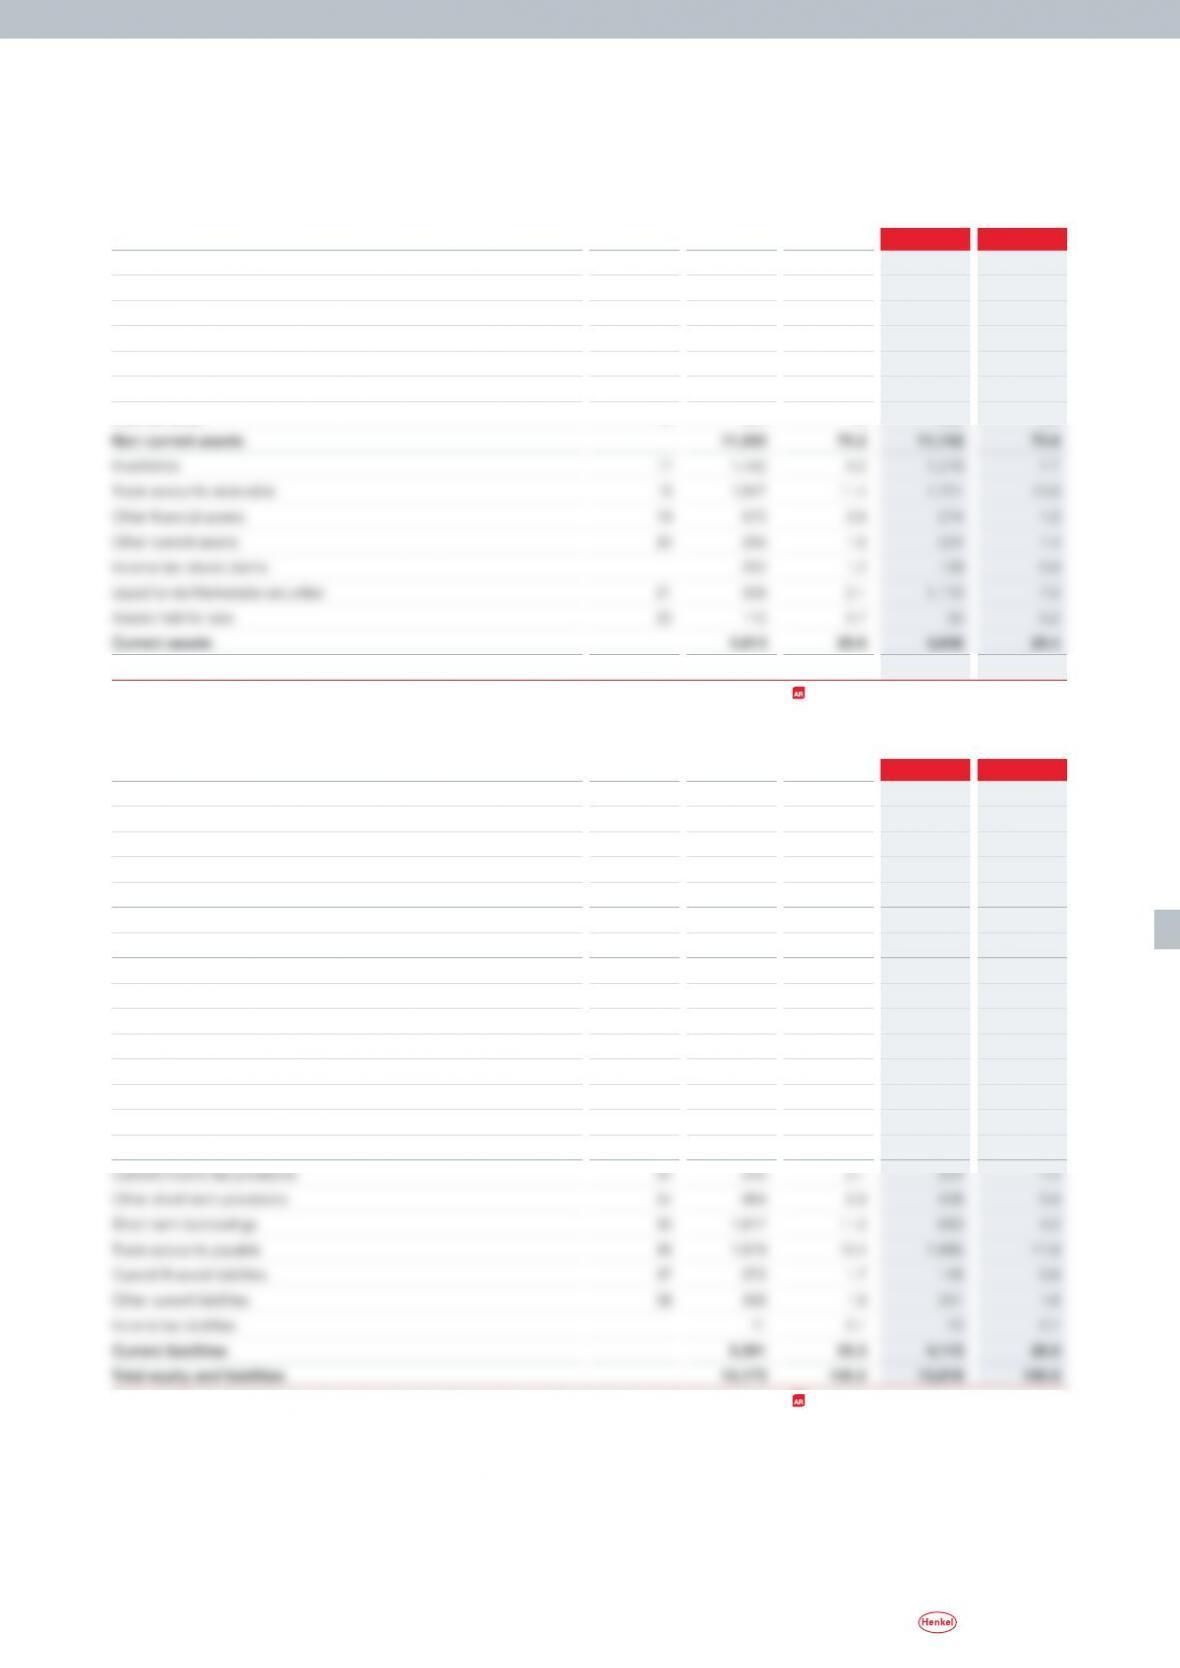
Assets
in million euros Note 20081) %2009 %
Intangible assets 11 8,491 52.5
8,218 52.0
Property, plant and equipment 12 2,361 14.6
2,248 14.2
Financial assets 13
24 0.1
20 0.1
Other financial assets
14
172 1.1
340 2.2
Income tax refund claims 3 –
2 –
Other non-current assets
15
4 –
12 0.1
Deferred taxes 16 305 1.9
322 2.0
Total assets 16,173 100.0 15,818 100.0
1)
Adjusted following finalization of purchase price allocation relating to the acquisition of the National Starch businesses, see
page 87 et seq.
Shareholders’ equity and liabilities
in million euros Note 20081) %2009 %
Subscribed capital 23 438 2.7
438 2.8
Capital reserve 24 652 4.0
652 4.1
Retained earnings 25 6,805 42.0
6,908 43.7
Gains and losses recognized in equity 26 –1,411 – 8.7
–1,524 – 9.6
Equity excluding minority interests 6,484 40.0 6,474 41.0
Minority interests 27 51 0.3
70 0.4
Equity including minority interests 6,535 40.3 6,544 41.4
Pensions and similar obligations 28 833 5.2
867 5.5
Long-term income tax provisions 29 177 1.1
152 1.0
Other long-term provisions 29 336 2.1
241 1.5
Long-term borrowings 30 2,402 14.9
3,426 21.7
Non-current financial liabilities
31 77 0.5
88 0.5
Other non-current liabilities
32 9 0.1
20 0.1
Deferred taxes 33 413 2.5
367 2.3
Non-current liabilities 4,247 26.4 5,161 32.6
1)
Adjusted following finalization of purchase price allocation relating to the acquisition of the National Starch businesses, see
page 87 et seq.
82 Annual Report 2009
Consolidated financial statements » Consolidated cash flow statement
See Note 47
in million euros 2008 2009
Operating profit (EBIT) 779 1,080
Income taxes paid
– 412 – 305
Amortization/depreciation/write-ups of non-current assets (excluding financial assets)
546 588
Net gains/losses on disposal of non-current assets (excluding financial assets)
312
Change in inventories
– 78 276
Change in trade accounts receivable
108 136
Change in other receivables and miscellaneous assets
60 –15
Change in trade accounts payable
– 36 208
Change in other liabilities and provisions
195 – 61
Cash flow from operating activities 1,165 1,919
Purchase of intangible assets
– 20 – 28
Purchase of property, plant and equipment
– 473 – 344
Purchase of financial assets/acquisitions
– 3,708 – 8
1)
Proceeds on disposal of subsidiaries and business units
57 90
Proceeds on disposal of other non-current assets
1,752 51
Realization of net investment hedge
119 –
Cash flow from investing activities/acquisitions – 2,273 – 239
Henkel AG & Co. KGaA dividends
– 224 – 224
Subsidiary company dividends (to other shareholders)
– 8 –12
Interest received 90 70
Dividends received
22 –
Interest paid
– 345 – 206
Dividends and interest paid and received – 465 – 372
Change in borrowings
757 –152
Allocation to pension funds
– 262 – 389
Other financing transactions
–10 8
Cash flow from financing activities 20 – 905
Change in cash and cash equivalents due to movements in funds –1,088 775
Change in cash and cash equivalents due to exchange rate movements
–14 – 3
Change in liquid funds and marketable securities –1,102 772
Liquid funds and marketable securities at January 1
1,440 338
Consolidated cash flow statement
Additional voluntary information
Computation of free cash flow
in million euros 2008 2009
Cash flow from operating activities 1,165
1,919
Purchase of intangible assets
– 20 – 28
Purchase of property, plant and equipment
– 473 – 344
Proceeds on disposals of other non-current assets (excluding proceeds from sale of investment in Ecolab Inc.) 40 51
83
Annual Report 2009
Consolidated financial statements » Statement of comprehensive income / Statement of changes in equity
Statement of comprehensive income
in million euros 2008 2009
Net earnings 1,233 628
Foreign exchange effects 103 –104
Financial instruments –100 –11
Actuarial gains/losses –186 – 285
Share of net profits of associates
Effects arising from the current financial year 33 –
Elimination of cumulative foreign exchange effects since initial inclusion –16 –
Other comprehensive income –166 – 400
Total comprehensive income for the period 1,067 228
– Attributable to minority shareholders 16 24
– Attributable to shareholders of Henkel AG & Co. KGaA 1,051 204
Statement of changes in equity
See Notes 23 to 27
in million euros Gains and losses
recognized in equity
Ordinary
shares
Preferred
shares
Trea-
sury
stock
Capital
reserve
Retained
earnings
Translation
differences
Financial
instru-
ments
Minority
interests
Total
At January 1, 2008 260 178 –119 652 6,082 –1,298 –112 63 5,706
Net earnings – – – – 1,221 – – 12
1,233
Foreign exchange effects – – – – – 99 – 4
103
Financial instruments – – – – – – –100 –
–100
Actuarial gains (+) and losses (–)
– – – – –186 – – –
–186
Investments in associates – – – – 17 – – –
17
Total comprehensive
income for the period – – – – 1,052 99 –100 16 1,067
Distributions – – – – – 224 – – – 8
– 232
Sale of treasury stock – – 4 – 1 – – –
5
Other changes in equity – – – – 9 – – –20
–11
At December 31, 2008/
January 1, 2009 260 178 –115 652 6,920 –1,199 – 212 51 6,535
Net earnings – – – – 602 – – 26
628
Foreign exchange effects – – – – – –102 – – 2
–104
Sale of treasury stock – – 6 – 4 – – –
10
Other changes in equity – – – – – – – 7
7
At December 31, 2009 260 178 –109 652 7,017 –1,301 – 223 70 6,544
84 Annual Report 2009
Group segment report
by business sector
1)
Notes to the consolidated financial statements » Group segment report by business sector
See Note 45
in million euros
Laundry &
Home
Care
Cos-
metics/
Toiletries
Adhesives
for Crafts-
men and
Consumers
Industrial
Adhesives
Total
Adhesive
Tech-
nologies
Operating
business
sectors total
Corporate
Henkel
Sales 2009 4,129 3,010 1,738 4,486 6,224 13,363 210 13,573
Change from previous year –1.0 % – 0.2 % –16.9 % – 2.6 % – 7.1 % – 3.8 % – – 3.9 %
Proportion of Group sales 30 % 22 % 13 % 33 % 46 % 98 % 2 % 100 %
Sales 2008 4,172 3,016 2,092 4,608 6,700 13,888 243 14,131
other rights and property, plant
and equipment 2009 121 46 96 282 378 545 43 588
of which impairment losses 2009 10 1 32 105 137
5) 148 27 175
of which write-ups 2009 1 – – 2 2 3 – 3
Amortization/depreciation and
write-ups of trademark rights,
other rights and property, plant
and equipment 2008
112
51
48
168
216
379
167
546
of which impairment losses 2008 58 35 4 33 37 130 23 153
of which write-ups 2008 – – – – – – – –
EBIT 2009 501 387 104 186 290
6) 1,178 – 98
4) 1,080
EBIT 2008
439 376 233 425 658 1,473 – 694 779
Change from previous year
14.0 % 3.1 % – 55.3 % – 56.3 % – 55.9 % – 20.0 % – 38.6 %
Return on sales (EBIT) 2009 12.1 % 12.9
% 6.0
% 4.2
% 4.7
% 8.8
%–8.0
%
Return on sales (EBIT) 2008
10.5 % 12.5 % 11.1 % 9.2 % 9.8 % 10.6 % – 5.5 %
Capital employed 2009
2) 2,562 2,125 1,161 5,874 7,035 11,722 –181 11,541
Capital employed 2008
2)
2,604 2,151 1,299 5,291 6,590 11,345 – 24 11,321
Operating assets 2008
3)
3,893 2,763 1,641 6,439 8,080 14,736 398 15,134
Operating liabilities 2008
1,154 819 423 1,451 1,874 3,847 422 4,269
Net operating assets
employed 2008
3)
2,739 1,944 1,218 4,988 6,206 10,889 – 24 10,865
1) Calculated on the basis of units of 1,000 euros
2) Including goodwill at cost prior to any accumulated amortization in accordance with IFRS 3.79 (b)
3) Including goodwill at net book value
4) Including restructuring charges for the National Starch businesses of 44 million euros; the ongoing restructuring costs are charged to the operating business sectors
5) Including 46 million euros of goodwill impairment losses; see other operating charges
6) Including 59 million euros from the reorganization of the Adhesive Technologies businesses in Europe
85
Annual Report 2009
Notes to the consolidated financial statements » Group segment report by region
Group segment report
by region1)
See Note 45
in million euros
Europe/
Africa/
Middle
East
North
America
(USA,
Canada)
Latin
America
Asia-/
Pacific
Regions
total
Corporate
Henkel
Sales by location of company 2009 8,335 2,546 825 1,657 13,363 210 13,573
Change from previous year – 6.0 % – 5.7 % 5.8 % 7.3 % – 3.8 % – – 3.9 %
Proportion of Group sales 61 % 19 % 6 % 12 % 98 % 2 % 100 %
Sales by location of company 2008 8,863 2,700 780 1,545 13,888 243 14,131
Sales by location of customer 2009 8,267 2,512 833 1,751 13,363 210 13,573
Change from previous year – 6.0 % – 5.8 % 5.3 % 7.3 % – 3.8 % – – 3.9 %
Proportion of Group sales
61 % 18 % 6 % 13 % 98% 2 % 100 %
Sales by location of customer 2008 8,798 2,668 791 1,631 13,888 243 14,131
EBITDA 2009 1,083 320 92 228 1,723 – 55 1,668
EBITDA 2008
4) 1,228 365 79 180 1,852 – 527 1,325
Return on capital employed (ROCE) 2008
4)
24.9 % 5.2 % 12.1 % 8.7 % 13.0 % – 6.9 %
Operating assets 2009
2)5,749 6,444 652 1,975 14,820 357 15,177
Operating liabilities 2009 2,310 485 178 520 3,493 538 4,031
Net operating assets employed 2009
2)3,439 5,959 474 1,455 11,327 –181 11,146
Operating assets 2008
2)
5,963 6,077 628 2,068 14,736 398 15,134
Operating liabilities 2008
2,480 597 160 610 3,847 422 4,269
Net operating assets employed 2008
2)
3,483 5,480 468 1,458 10,889 – 24 10,865
1)
Calculated on the basis of units of 1,000 euros
2) Including goodwill at net book value
3) Including restructuring charges for the National Starch businesses of 44 million euros; the ongoing restructuring costs are charged to the regions
4) From 2009, corporate charges incurred with respect to regional business management are to be allocated to the individual regions; the prior-year figures have been
adjusted accordingly, which means the 2008 earnings result for the Europe/Africa/Middle East region is 44 million euros higher, while that of the other regions is lower:
by 23 million euros for North America, by 7 million euros for Latin America and by 14 million euros for Asia-Pacific
In the operating business sectors, affiliated companies lo–
cated in Germany, including the parent company, achieved
sales in 2009 of 1,909 million euros (2008: 2,020 million
euros) and reported intangible assets and property, plant
and equipment at December 31, 2009 of 1,087 million euros
(2008: 1,123 million euros).
The affiliated companies domiciled in North America re–
ported intangible assets, property, plant and equipment at
December 31, 2009 of 5,457 million euros (2008: 5,793 mil–
lion euros).
86 Annual Report 2009
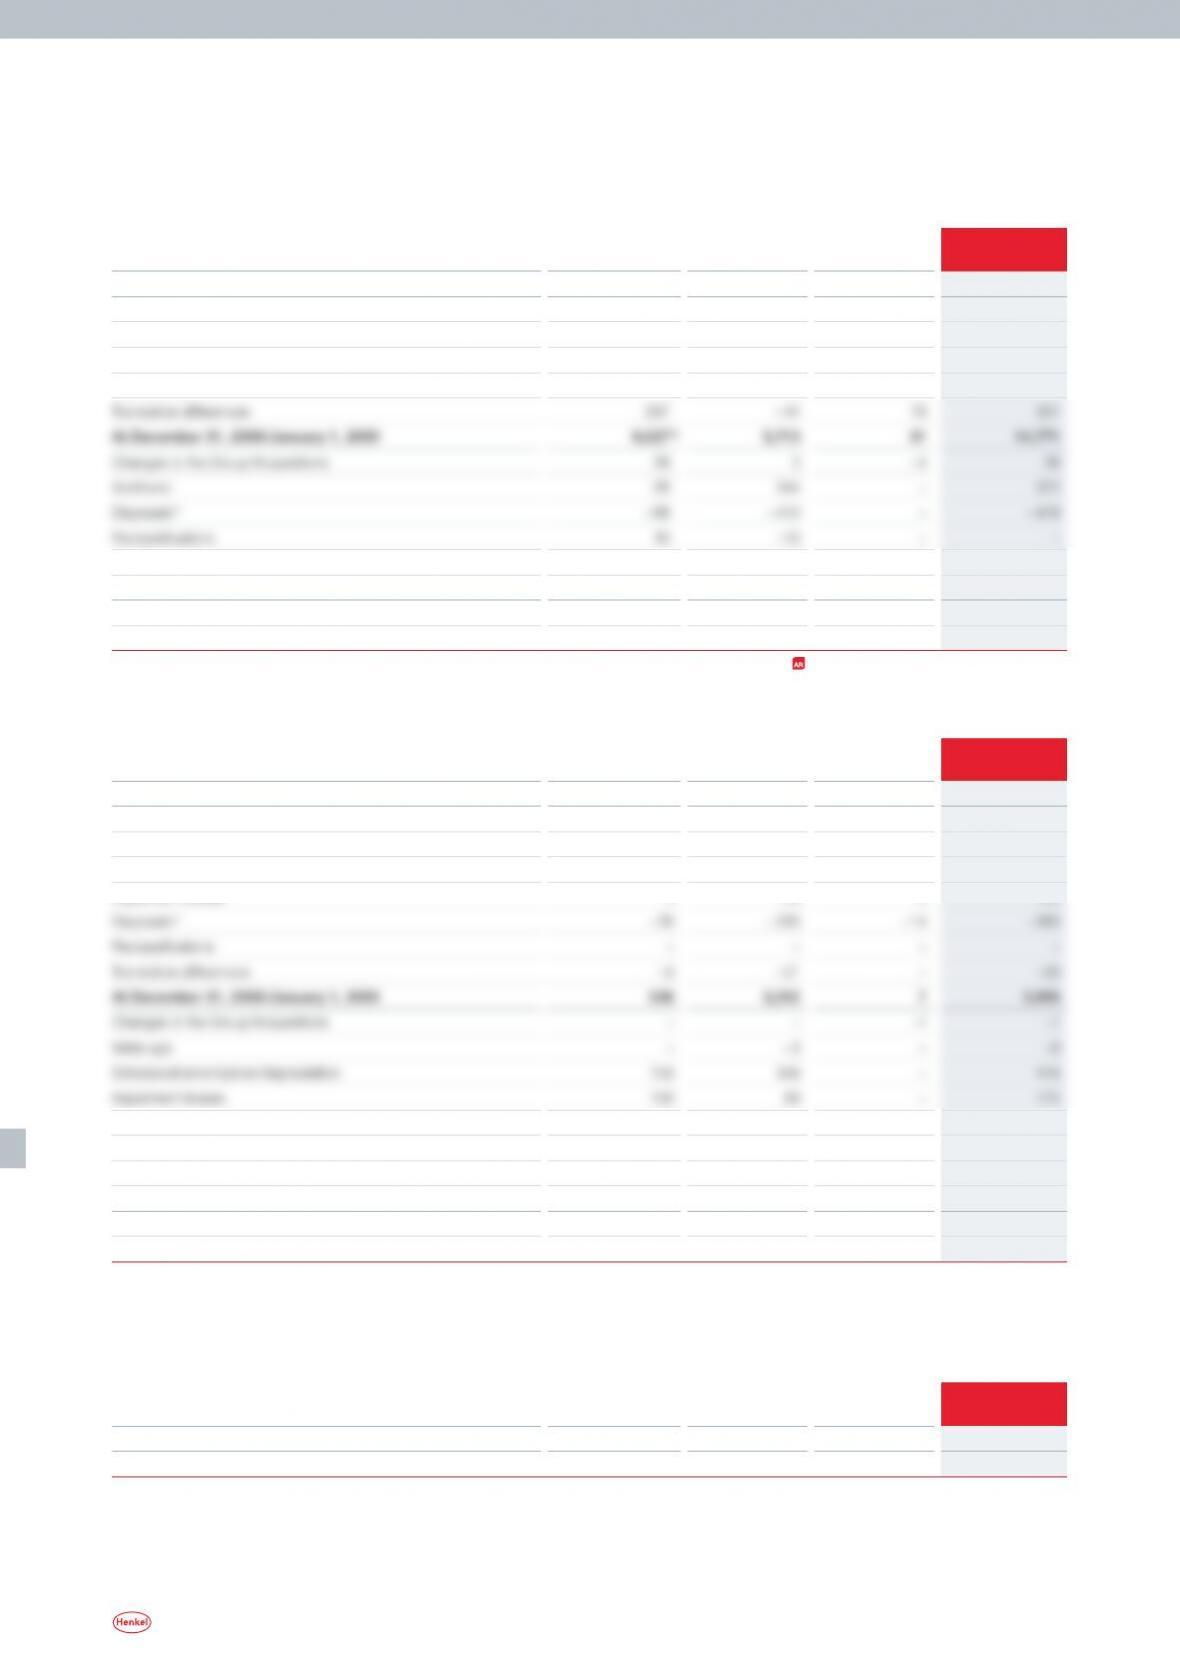
Notes to the consolidated financial statements » Consolidated changes in intangible assets, property, plant and equipment and financial assets
Consolidated changes in intangible assets,
property, plant and equipment and financial assets
Cost
in million euros Intangible assets Property, plant
and equipment
Financial
assets
Total
At January 1, 2008 5,424 5,337 546 11,307
Changes in the Group /Acquisitions 3,3212) 342 3 3,666
Additions 20 473 66 559
Disposals1)
– 41 – 389 – 662 –1,092
Reclassifications 6 –6 – –
Translation differences –139 – 27 –1 –167
At December 31, 2009 8,897 5,613 26 14,536
1) of which assets held for sale 2009 – 41 – 46 – – 87
1) of which assets held for sale 2008 –1 –188 –12 – 201
2)
Adjusted following finalization of purchase price allocation relating to the acquisition of the National Starch businesses, see
page 87 et seq.
Accumulated amortization/depreciation
in million euros Intangible assets Property, plant
and equipment
Financial
assets
Total
At January 1, 2008 484 3,260 18 3,762
Changes in the Group /Acquisitions – – 4 –– 4
Write-ups – – – –
Scheduled amortization /depreciation 95 298 – 393
Impairment losses 4 149 3 156
Disposals1) – 63 – 347 – – 410
Reclassifications – – – –
Translation differences – 8 –14 – – 22
At December 31, 2009 679 3,365 6 4,050
1) of which assets held for sale 2009 – 37 – 32 – – 69
1) of which assets held for sale 2008 – –169 – 8 –177
Net book value
in million euros Intangible assets Property, plant
and equipment
Financial
assets
Total
At December 31, 2009 8,218 2,248 20 10,486
At December 31, 2008 8,4911) 2,361 24 10,876
1)
Adjusted following finalization of purchase price allocation relating to the acquisition of the National Starch businesses
The impairment losses are allocated to the relevant functions.

87
Annual Report 2009
General information
The consolidated financial statements of Henkel AG & Co.
KGaA have been prepared in accordance with International
Financial Reporting Standards (IFRS) as adopted by the
European Union.
The individual financial statements of the companies
included in the consolidation are drawn up on the same
accounting date as those of Henkel AG & Co. KGaA.
Members of the KPMG organization or other indepen–
dent firms of auditors instructed accordingly have either
audited the financial statements of companies included
in the consolidation or, in exceptional cases, conducted a
review of those financial statements. On January 29, 2010,
the Management Board of Henkel Management AG – the per–
sonally liable partner of Henkel AG & Co. KGaA – approved
the release of the consolidated financial statements to the
Supervisory Board. The Supervisory Board is responsible
for reviewing the consolidated financial statements and
declaring whether it approves them.
The consolidated financial statements are based on the
principle of historical cost with the exception that certain
financial instruments are accounted for at their fair values.
The Group currency is the euro. Unless otherwise indicated,
all amounts are shown in million euros. In order to im–
prove the clarity and informative value of the consolidated
financial statements, certain items are combined in the
consolidated balance sheet or in the consolidated statement
of income and shown separately in the Notes.
Scope of consolidation
In addition to Henkel AG & Co. KGaA, the consolidated finan–
cial statements at December 31, 2009 include nine domestic
and 202 foreign companies in which Henkel AG & Co. KGaA
has the power to govern the financial and operating policies,
based on the concept of control. This is generally the case
where Henkel AG & Co. KGaA holds, directly or indirectly, a
majority of the voting rights. Companies in which not more
than half of the shares are held are fully consolidated if
Henkel AG & Co. KGaA has the power, directly or indirectly,
to govern their financial and operating policies.
The composition of the Group has undergone only minor
change in the course of 2009 compared to the previous year.
Seven companies have been included in the consolidated
Group figures for the first time, 26 companies were merged
and 14 companies are no longer consolidated.
Acquisition of the National Starch businesses
On April 3, 2008, we acquired the Adhesives and Electron-
ic Materials divisions from the National Starch & Chemi–
cal Company following the takeover of the latter by Akzo
Nobel. The purchase price according to the contract dated
August 13, 2007, a so-called back-to-back agreement, was
3.7 billion euros (2.7 billion pounds sterling).
We valued and converted the acquisition of the Nation–
al Starch businesses using the closing rates of the date of
acquisition.
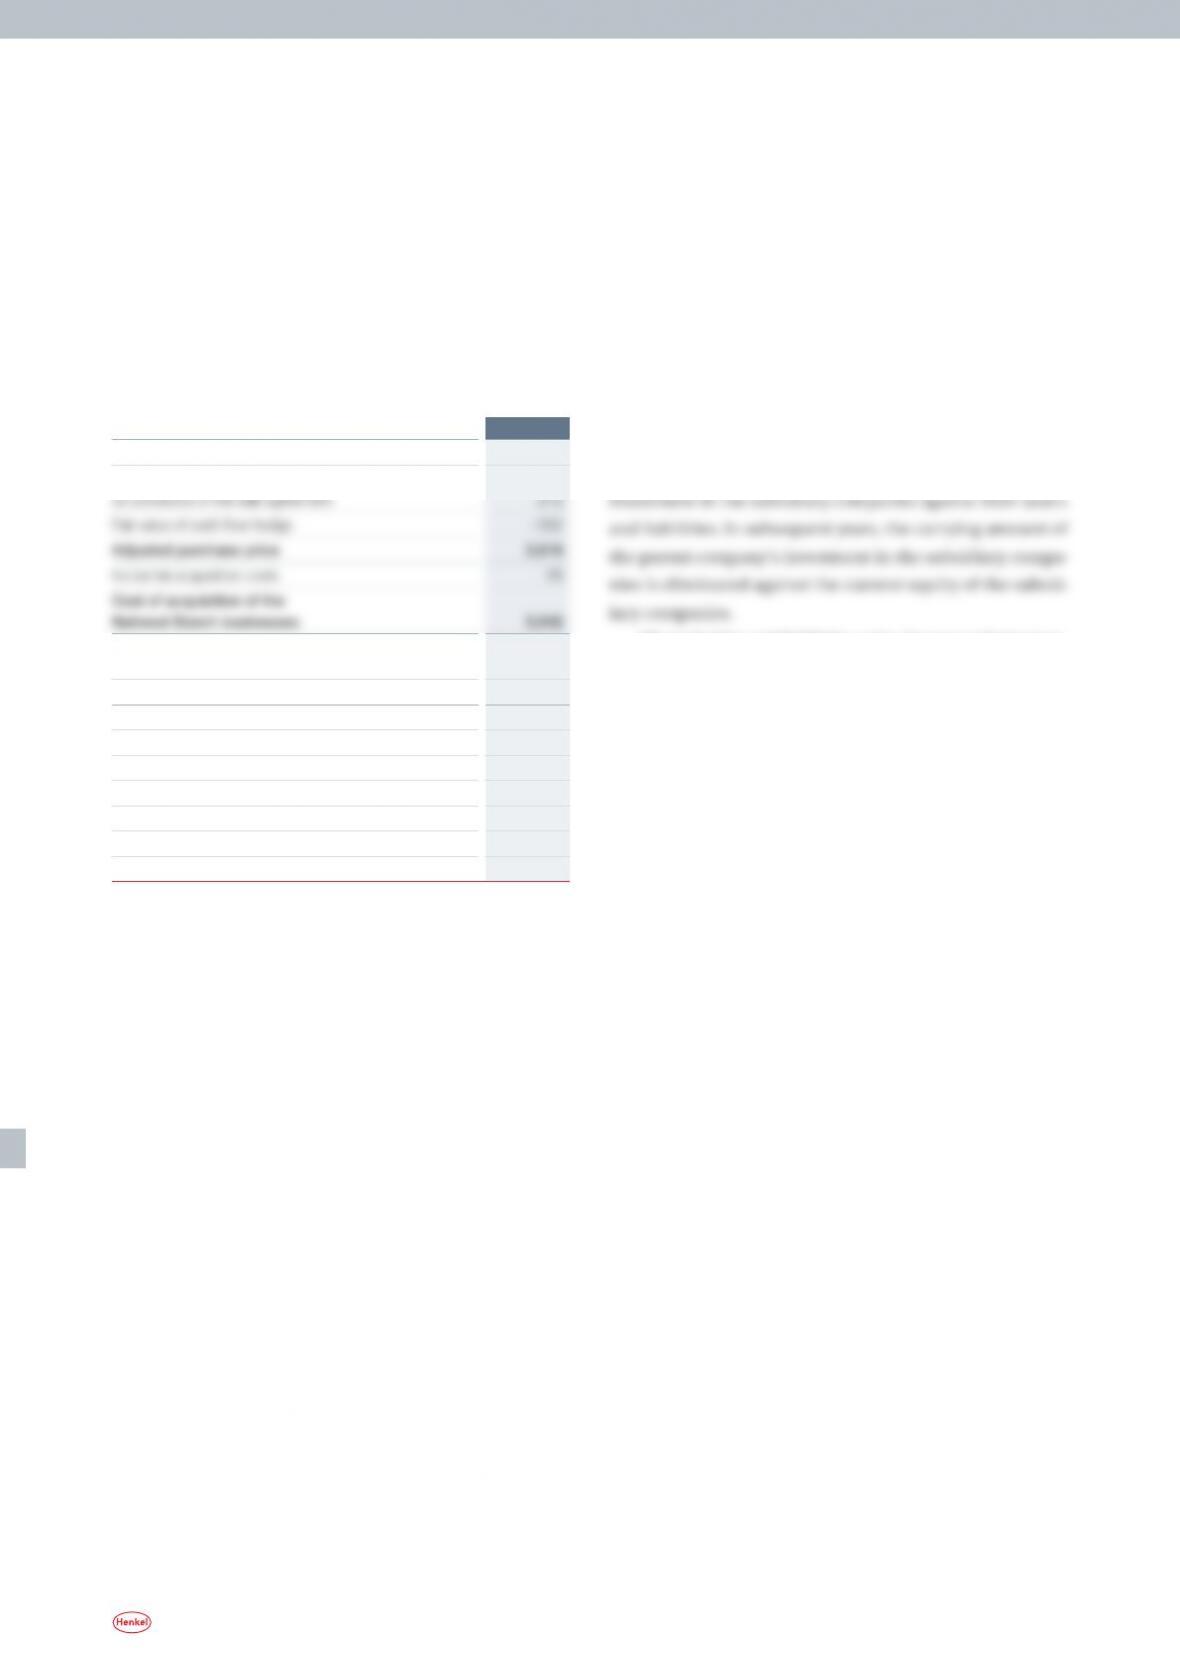
The allocation of the acquisition costs to the acquired
assets and liabilities (purchase price allocation) has now
been completed based on IFRS 3 “Business Combinations.”
The excess of the acquisition costs over the net book value of
the acquired assets and liabilities is 3,002 million euros.
The purchase price allocation process serves to assign
the acquisition costs to the fair values of the assets, liabili-
ties and contingent liabilities. Also taken into account in
this regard are the fair values of previously unrecognized
intangible assets assignable to the acquired activities,
such as customer relationships, technologies and brands.
It should be noted that purchase price allocation leads to
the recognition of hidden reserves and hidden charges
in the assets, liabilities and contingent liabilities of the
acquired businesses, and thus to additional expenses in the
form of accruing depreciation and amortization charges
against income.
The purchase price and thus the goodwill figure calcu-
lated following purchase price allocation primarily represent
anticipated synergies arising from the integration of the Na–
tional Starch businesses within the Henkel organization.
The table overleaf shows the reconciliation between the
purchase price and the goodwill figure after deduction of
the book values of the acquired assets and liabilities.
In November 2007, we entered into a cash flow hedge to
mitigate the currency risk attached to the purchase price
payable for the National Starch businesses. Settlement of
this transaction in April 2008 gave rise to a fair value of
–332 million euros. In compliance with the requirements of
International Accounting Standard (IAS) 39 “Financial Instru–
ments: Recognition and Measurement,” we have recognized
this amount as a deduction in Group equity and have also
deducted it from the purchase price as of April 3, 2008 in
calculating the excess of the acquisition costs over the net
book value of the acquired assets and liabilities.
Accounting principles and methods applied in
preparation of the consolidated financial statements
Notes to the consolidated financial statements » Accounting principles and methods applied in preparation of the consolidated financial statements
88 Annual Report 2009
The book values of the acquired assets and liabilities corre–
spond to the figures in the audited opening balance sheets
relating to the acquired activities as of April 3, 2008, to
which the accounting principles and methods of the Henkel
Group were applied:
Reconciliation of purchase price with
goodwill as of April 3, 2008
in million euros 2008
Purchase price
3,676
Purchase price adjustment based
Book values of the acquired
assets and liabilities
– 640
Provisional difference 3,002
Customer relationships
289
Technologies
215
Trademarks and brands
98
Other intangible assets
61
Other assets and liabilities
3
Deferred taxes
– 227
Goodwill 2,563
In the course of finalization of the purchase price allocation
in 2009, the goodwill figure rose by 99 million euros.
Other acquisitions and divestments
In April 2009, we acquired the remaining minority shares
in Henkel Alki, Tunisia. The purchase price was 8 mil lion
euros. In September 2009, we acquired the minority shares
in National Organic Kimyasaal in Turkey and merged
this company with Türk Henkel. The purchase price was
16 million euros. In November 2009, following the successive
purchase of further shares, we acquired Henkel Huawei in
China, raising our participating interest to 79.33 percent.
The purchase price was 4 million euros.
In May 2009, we sold the North American consumer
adhesives business under the Duck brand. The divestment
proceeds amounted to 79 million euros.
Consolidation methods
The purchase method is used for the consolidation of capi-
tal. This method stipulates that, for business combinations,
all hidden reserves and hidden charges in the company
acquired must be fully reflected at fair value and all iden-
tifiable intangible assets must be separately disclosed. Any
difference arising between the fair value of the net assets
and the purchase price is recognized as goodwill. Companies
acquired are included in the consolidation for the first time
by offsetting the carrying amount of the parent company’s
All receivables and liabilities, sales, income and expenses,
as well as intercompany profits on non-current assets or
inventories resulting from intra-group transactions, are
eliminated on consolidation. Intra-group transactions are
effected on the basis of market or transfer prices.
Currency translation
The financial statements of the consolidated companies,
including the hidden reserves and hidden charges of Group
companies recognized under the purchase method and
also goodwill arising on consolidation, are translated into
euros using the functional currency method outlined in
IAS 21 “The Effects of Changes in Foreign Exchange Rates.”
The functional currency is the main currency in which the
foreign company generates funds and makes payments. As
the functional currency for all the companies included in
the consolidation is the local currency of the company con–
cerned, assets and liabilities are translated at closing rates,
while income and expenses are translated at the average
rates for the year, based on an approximation of the actual
rates at the date of translation. The differences arising from
using average rather than closing rates are taken to equity
and shown as gains or losses recognized in equity, without
affecting net earnings.
Foreign currency accounts receivable and payable are
translated at closing rates. For the main currencies in the
Group, the following exchange rates have been used based
on one euro:
Notes to the consolidated financial statements » Accounting principles and methods applied in preparation of the consolidated financial statements

89
Annual Report 2009
Accounting estimates and assumptions
Preparation of the consolidated financial statements is
based on a number of accounting estimates and assump–
tions. These have an impact on the reported amounts of
assets, liabilities and contingent liabilities at the balance
sheet date and the disclosure of income and expenses for
the reporting period. The actual amounts may differ from
these estimates.
The accounting estimates and their underlying assump–
tions are continually reviewed. Changes in accounting es–
timates are recognized in the period in which the change
takes place where such change exclusively affects that
period. A change is recognized in the period in which it
occurs and in later periods where such change affects both
the reporting period and subsequent periods. The judgments
of the Management Board regarding the application of those
IFRSs which have a significant impact on the consolidated
financial statements are presented in the explanatory notes
on taxes on income (Note 9), intangible assets (Note 11),
pensions and similar obligations (Note 28), derivatives and
other financial instruments (Note 42) and share-based pay-
ment plans (Note 43).
Accounting standards not applied
in advance of their effective date
The following interpretations and revisions to existing stan–
dards of possible relevance to Henkel, which have since been
adopted into EU law (endorsement mechanism) but are not
yet mandatory, have not yet been applied:
» In January 2008, the International Accounting Standards
Board (IASB) issued a revised version of IFRS 3 “Business
Combinations” and of IAS 27 “Consolidated and Separate
Financial Statements.” IFRS 3 (2008) sets out new rulings
as regards the application of the purchase method in the
case of business combinations. Significant amendments
relate to the measurement of non-controlling interests,
the accounting treatment of step acquisitions, and the
treatment of contingent considerations and acquisition-
related costs that are to be expensed at the time they arise.
Significant amendments to IAS 27 (2008) relate to the re-
porting of transactions in respect of which the company
retains control, and transactions where control is ceded.
Transactions that do not lead to a loss of control must be
reported directly as equity transactions. Residual interests
are to be measured at fair value at the time of loss of con-
trol. The amendments are applicable for financial years
beginning after June 30, 2009, with early application of
both revised standards permitted.
» In July 2008, the IASB issued amendments relating to IAS 39
“Financial Instruments: Recognition and Measurement
– Eligible Hedged Items.” The amendments clarify the ap–
plication of hedge accounting to the inflation component
of financial instruments and to option contracts when
they are used as a hedging instrument. The amendments
are applicable for financial years beginning after June 30,
2009, with early application permitted.
» In October 2009, the IASB issued amendments to IAS 32
“Financial Instruments: Presentation.” The amendments
stipulate the accounting procedure with respect to the
issuers of stock rights, options and warrants for acquiring
a fixed number of equity instruments that are denomi–
nated in a currency other than the functional currency
of the issuer. Such cases were hitherto reported as deriva–
tive liabilities. Stock rights that are issued pro-rata at a
fixed currency amount to the existing shareholders of a
company are in future to be classified as equity. The cur–
rency in which the exercise price is stated is irrelevant.
The amendments are applicable for financial years begin–
ning on or after February 1, 2010, with early application
permitted.
Notes to the consolidated financial statements » Accounting principles and methods applied in preparation of the consolidated financial statements
Currency
Average exchange rate Closing exchange rate
ISO code 2008 2009 2008 2009

90 Annual Report 2009
» IFRIC 12 “Service Concession Arrangements” addresses
the issue of how companies that offer public services com–
missioned by local authorities are to report the rights and
obligations resulting from contractual agreements. The
interpretation is applicable for financial years beginning
after March 29, 2009, with early application permitted.
» IFRIC 15 “Agreements for the Construction of Real Estate”
addresses the accounting practice used by companies that
develop land and, in this capacity, sell buildings such as
houses and apartments before construction is complete.
The interpretation clarifies in particular when agreements
for the construction of real estate fall under the provisions
of IAS 11 “Construction Contracts” or IAS 18 “Revenue.” The
interpretation is applicable for financial years beginning af–
ter December 31, 2009 with early application permitted.
» IFRIC 16 “Hedges of a Net Investment in a Foreign Opera-
tion” clarifies that reporting of hedging instruments is
only possible between the functional currency of the for–
eign operation and the functional currency of the parent
entity. The hedged item can be the amount of net assets
of the foreign operation disclosed in the consolidated
financial statements. The hedging instrument can then
be held by any Group entity (except those of which the for–
eign currency risks are hedged). On disposal of the foreign
operation, the changes in value of the hedging instrument
recognized in equity and the foreign exchange gains or
losses of the foreign operation recognized in the currency
reserve are to be recycled from other comprehensive in–
come into the income statement. IFRIC 16 is applicable for
financial years beginning after June 30, 2009, with early
application permitted.
» IFRIC 17 “Distributions of Non-cash Assets to Owners” clari–
fies how non-cash assets distributed to owners of a com–
pany are to be reported. The amendments are applicable
for the beginning of the first financial year after October
31, 2009, with early application permitted.
» IFRIC 18 “Transfers of Assets from Customers” clarifies
how the transfer of assets or cash for the construction or
acquisition of property, plant or equipment from a cus–
tomer is to be reported. The amendments are applicable for
the beginning of the first financial year after October 31,
2009 at the latest.
All these standards and interpretations will be applied
by Henkel from fiscal 2010 or later. We expect the future
application of amendments to IAS 32, 39 and of IFRIC 12,
15, 16, 17 and 18 not to have a significant impact on the
presentation of the financial statements.
In fiscal 2009, the IASB issued the following standards or
interpretations of and amendments to standards of relevance
to Henkel which still have to be adopted into EU law (en–
dorsement mechanism) before they become applicable:
» Amendment to IFRS 2 “Share-based Payment”
» IFRS 9 “Financial Instruments”
» Amendments to IAS 24 “Related Party Disclosures”
» Collective standard “Annual Improvements to IFRSs”
» Amendment to IFRIC 14 “IAS 19 – The Limit on a Defined
Benefit Asset, Minimum Funding Requirements and their
Interaction”
» IFRIC 19 “Extinguishing Financial Liabilities with Equity
Instruments”
These interpretations and standards will be applied by
Henkel from fiscal 2010 or later. We expect the future appli–
cation of the aforementioned standards and interpretations
not to have a significant impact on the presentation of the
financial statements.
Notes to the consolidated financial statements » Accounting principles and methods applied in preparation of the consolidated financial statements
91
Annual Report 2009
Notes to the consolidated financial statements » Notes to the consolidated statement of income
(1) Sales and principles of income realization
Sales comprise sales of goods and services less sales deduc-
tions. Sales are recognized once the goods have been deliv-
ered or the service has been performed. In the case of goods,
this coincides with the physical delivery and transfer of risk.
It must also be probable that the economic benefits associ-
ated with the transaction will flow to the Group, and the
costs incurred in respect of the transaction must be reliably
measurable. Services are generally provided in conjunction
with the sale of goods and recorded once the service has
been performed. No sale is recognized if there are signifi–
cant risks relating to the receipt of the consideration or it
is likely that the goods will be returned.
Interest income is recognized on a time-proportion basis
that takes into account the effective yield on the asset and
the interest rate in force. Dividend income from investments
is recognized when the shareholder’s right to receive pay-
ment is established.
An analysis of sales by business sector and geographical
region is shown in the Group segment reports on pages 84
and 85.
(2) Cost of sales
(3) Marketing, selling and distribution expenses
In addition to marketing organization and distribution costs,
this item comprises mainly advertising, sales promotion
and market research costs. Also included here are the costs
of technical advisory services for customers and amounts
written off accounts receivable.
(4) Research and development expenses
Research expenses may not be recognized as an asset. De–
velopment costs are recognized as an asset if all the criteria
for recognition are met, the research phase can be clearly
distinguished from the development phase and the expendi–
ture can be attributed to distinct individual project phases.
Currently, the criteria set out in IAS 38 “Intangible Assets”
for recognizing development costs are not all being met, due
to a high level of interdependence within the development
projects and the difficulty of assessing which products will
eventually be marketable.
(5) Administrative expenses
Administrative expenses include personnel and non-person–
nel costs of Group management and costs relating to the Hu–
man Resources, Purchasing, Accounts and IT departments.
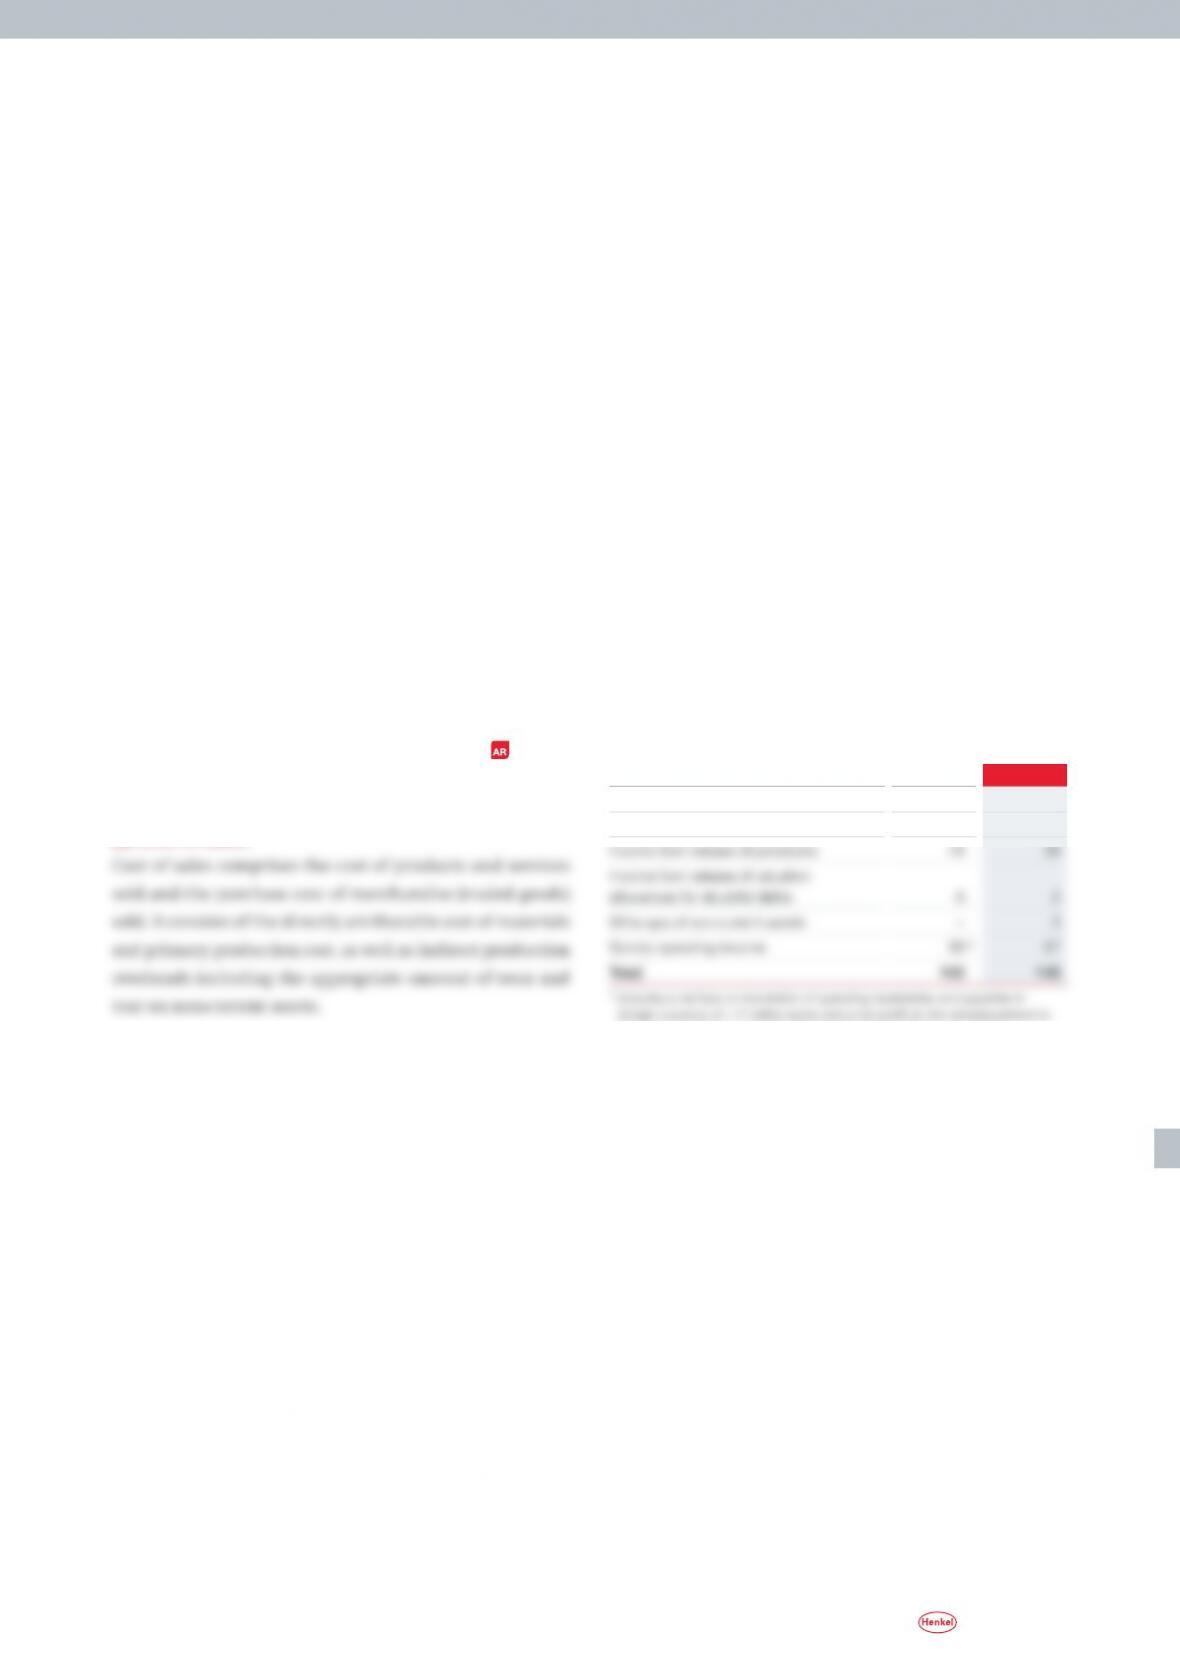
(6) Other operating income
Other operating income
in million euros 2008 2009
Gains on disposal of non-current assets
14 10
Profits on sale of businesses 8 –
fair value of operating derivative hedge transactions of 19 million euros
Effective fiscal 2009, the net loss on translation of operating
receivables and liabilities in foreign currency and the net
gain on measurement to fair value of operative derivative
hedging instruments are reported in the financial result, as
currency management is controlled centrally by Corporate
Treasury.
Profits on sale of businesses recognized in 2008 related
to the sale of our water treatment business. Sundry operat–
ing income refers to a number of individual transactions
from our operating business, for example payments on in-
surance claims, grants and subsidies, bonus credits and
similar income.
Notes to the
consolidated statement of income
92 Annual Report 2009
Notes to the consolidated financial statements » Notes to the consolidated statement of income
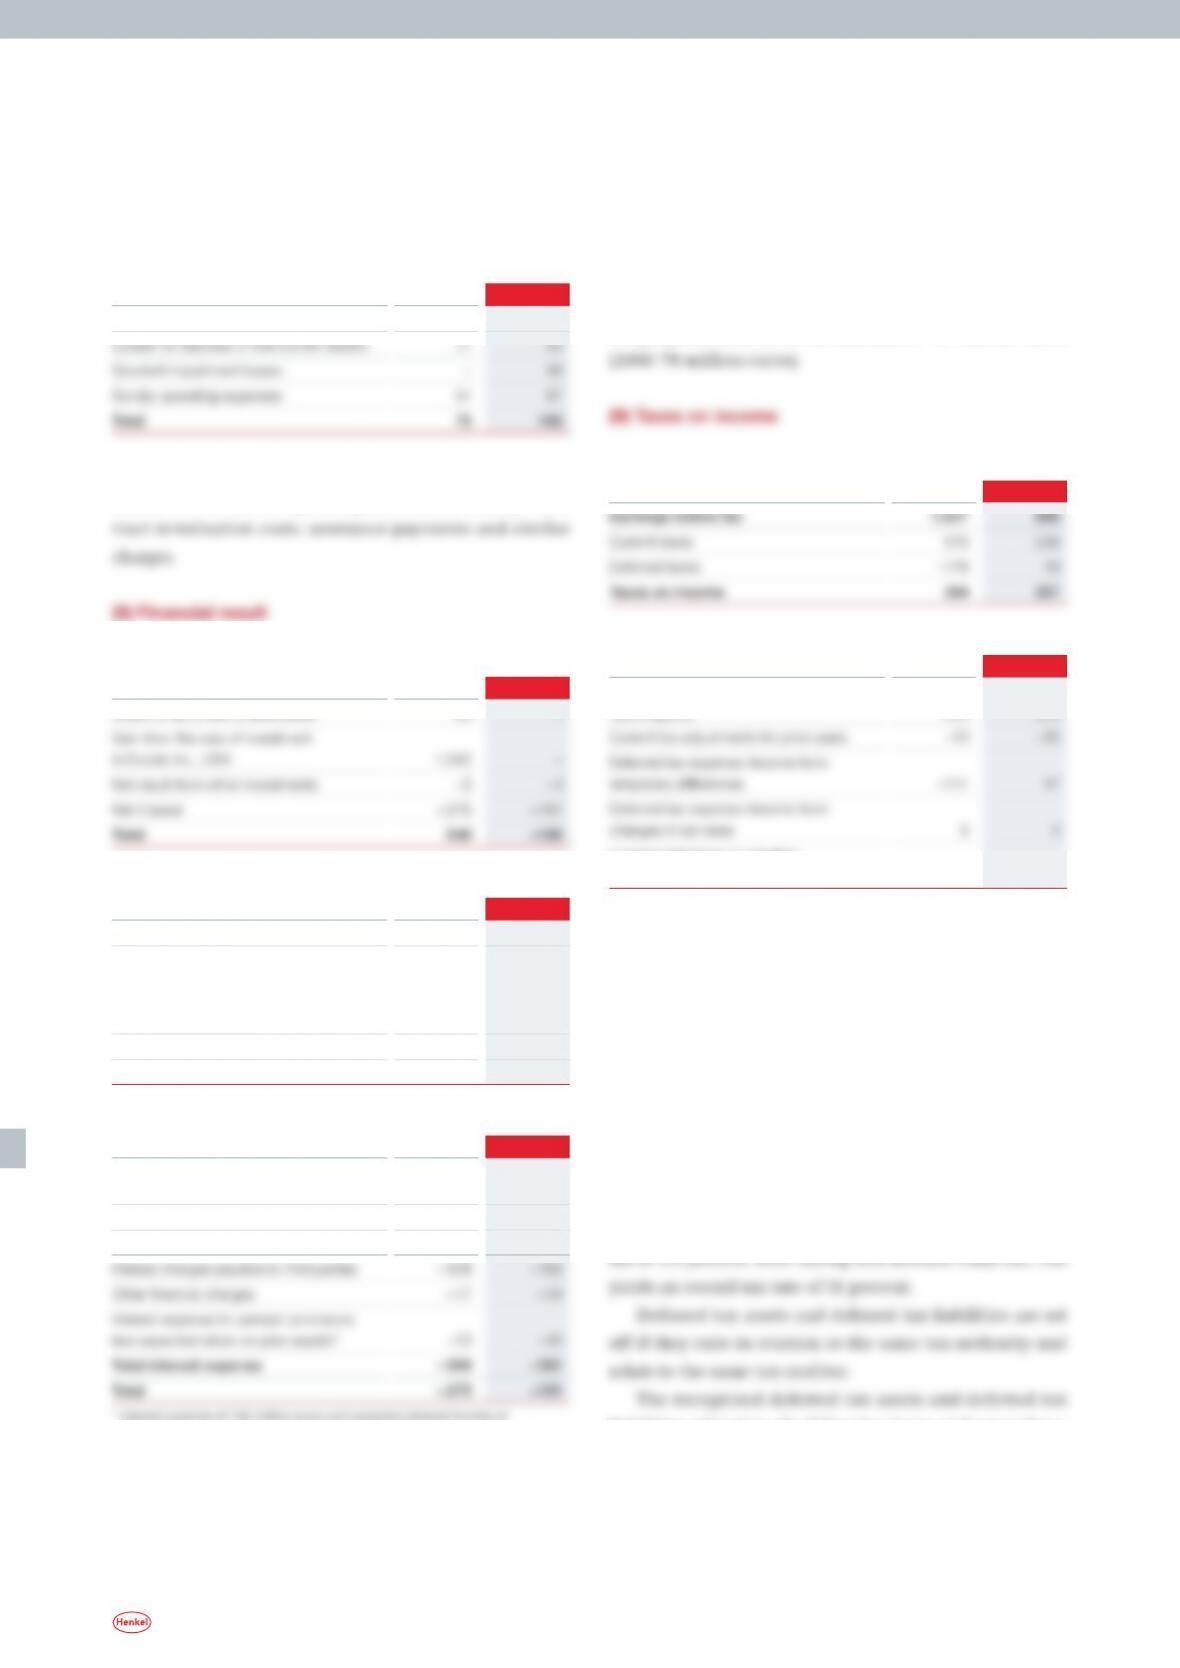
(7) Other operating charges
Other operating charges
in million euros 2008 2009
Write-downs of miscellaneous assets
4 –
Sundry operating expenses relate to a number of individual
transactions from our operating business, for example con–
Financial result
in million euros 2008 2009
Share of net profits of associates
83 –
Net result from other investments
in million euros 2008 2009
Income from other investments
3 1
Write-downs of shares in
non-consolidated affiliated
companies and investments
at amortized cost
– 3
–
Other
– 2 – 5
Total – 2 – 4
Net interest
in million euros 2008 2009
Interest and similar income
from third parties
54 47
Other financial income
37 23
Total interest income 91 70
147 million euros (2008: interest expense of 179 million euros and expected
interest income of 166 million euros)
Included in the total amount is the net result from the trans–
lation of accounts receivable and payable in the amount
of 22 million euros (2008: –101 million euros) and the net
result from the measurement to fair value of derivative
hedging instruments in the amount of –57 million euros
Earnings before taxes on income and analysis of taxes
in million euros 2008 2009
Main components of tax expense and income
in million euros 2008 2009
Current tax expense / income in the
reporting year
583 259
Increase / decrease in valuation
allowances on deferred tax assets
8 –13
In accordance with IAS 12 “Income Taxes,” deferred tax as-
sets and liabilities are recognized with respect to temporary
differences between the balance sheet valuation of an asset
or liability and its tax base, and with respect to consolida-
tion procedures affecting earnings. Deferred tax assets with
respect to unused tax losses and tax credits are measured
insofar as it is likely that sufficient taxable income will be
generated in future to realize the corresponding benefit.
Deferred taxes are calculated on the basis of the tax rates
that are applicable or anticipated in the individual countries
at the time of realization or utilization. In Germany there is
a uniform corporation tax rate of 15 percent plus a solidarity
liabilities related to the following items and unused tax
losses:
93
Annual Report 2009
Notes to the consolidated financial statements » Notes to the consolidated statement of income
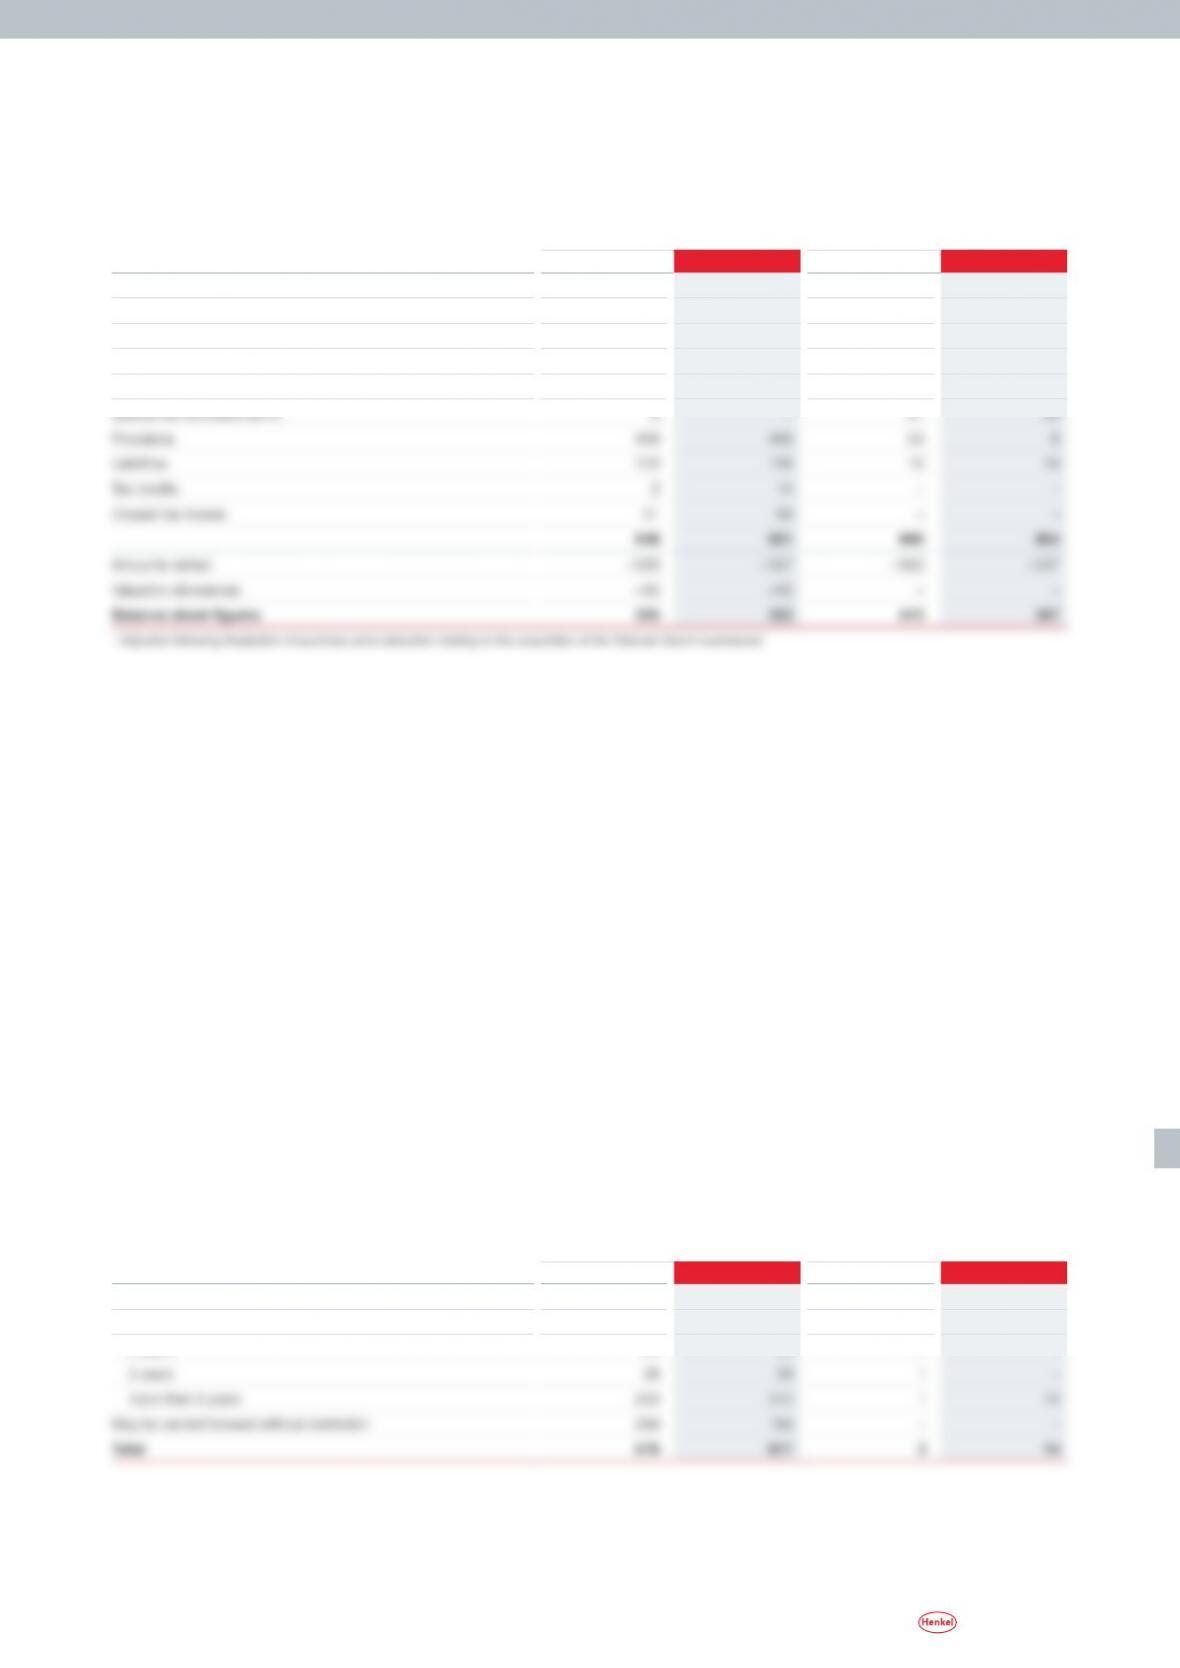
Allocation of deferred taxes
in million euros Deferred tax assets Deferred tax liabilities
Dec. 31, 2008 Dec. 31, 2009 Dec. 31, 20081) Dec. 31, 2009
Intangible assets
127 144 665 643
Property, plant and equipment
37 24 86 84
Financial assets
69 29 4 6
Inventories
29 36 8 4
Other receivables and miscellaneous assets
62 56 107 94
The deferred tax assets amounting to 446 million euros
(2008: 409 million euros) reported under provisions result
primarily from recognition and measurement differences
with respect to pensions and similar obligations.
The deferred tax liabilities amounting to 643 million
euros (2008: 665 million euros) reported under intangible
assets can be attributed chiefly to business combinations
such as the acquisition of the National Starch businesses
in 2008.
The valuation allowances on deferred tax assets of
62 million euros (2008: 60 million euros) are in respect of
temporary differences between the balance sheet valuation
of an asset or liability and its tax base, and are based on a
reassessment of future utilization.
Deferred taxes have not been recognized with respect
to unused tax losses of 347 million euros (2008: 358 mil–
lion euros), as it is not sufficiently probable that taxable
profit will be available against which they may be utilized.
Deferred taxes of 14 million euros (2008: 2 million euros)
have been recognized with respect to tax credits.
A deferred tax income of 78 million euros was recog–
nized directly in equity (2008: tax expense of 55 million
euros). This deferred tax income results in the amount of
70 million euros from actuarial losses with respect to pen-
sion obligations of 355 million euros, and in the amount
of 8 million euros from losses from cash flow hedges of
19 million euros.
The table below summarizes the expiry dates of un–
used tax losses and tax credits. This table includes unused
tax losses arising from the disposal of assets amounting
to 11 million euros (2008: 9 million euros) which may be
carried forward without restriction. In many countries,
different tax rates apply to losses on the disposal of assets
and to operating profits, and in some cases losses on the
disposal of assets may only be offset against profits on the
disposal of assets.
Expiry dates of unused tax losses and tax credits
Unused tax losses Tax credits
Dec. 31, 2008 Dec. 31, 2009 Dec. 31, 2008 Dec. 31, 2009
Must be utilized within
1 year
37 36 – –
2 years
32 63 – –
94 Annual Report 2009
Notes to the consolidated financial statements » Notes to the consolidated statement of income
The individual company reconciliations – prepared on the
basis of the tax rates applicable in each country and taking
into account consolidation procedures – have been sum–
marized in the statement below. The estimated tax charge,
based on the tax rate applicable to Henkel AG & Co. KGaA of
31 percent, is reconciled to the tax charge disclosed.
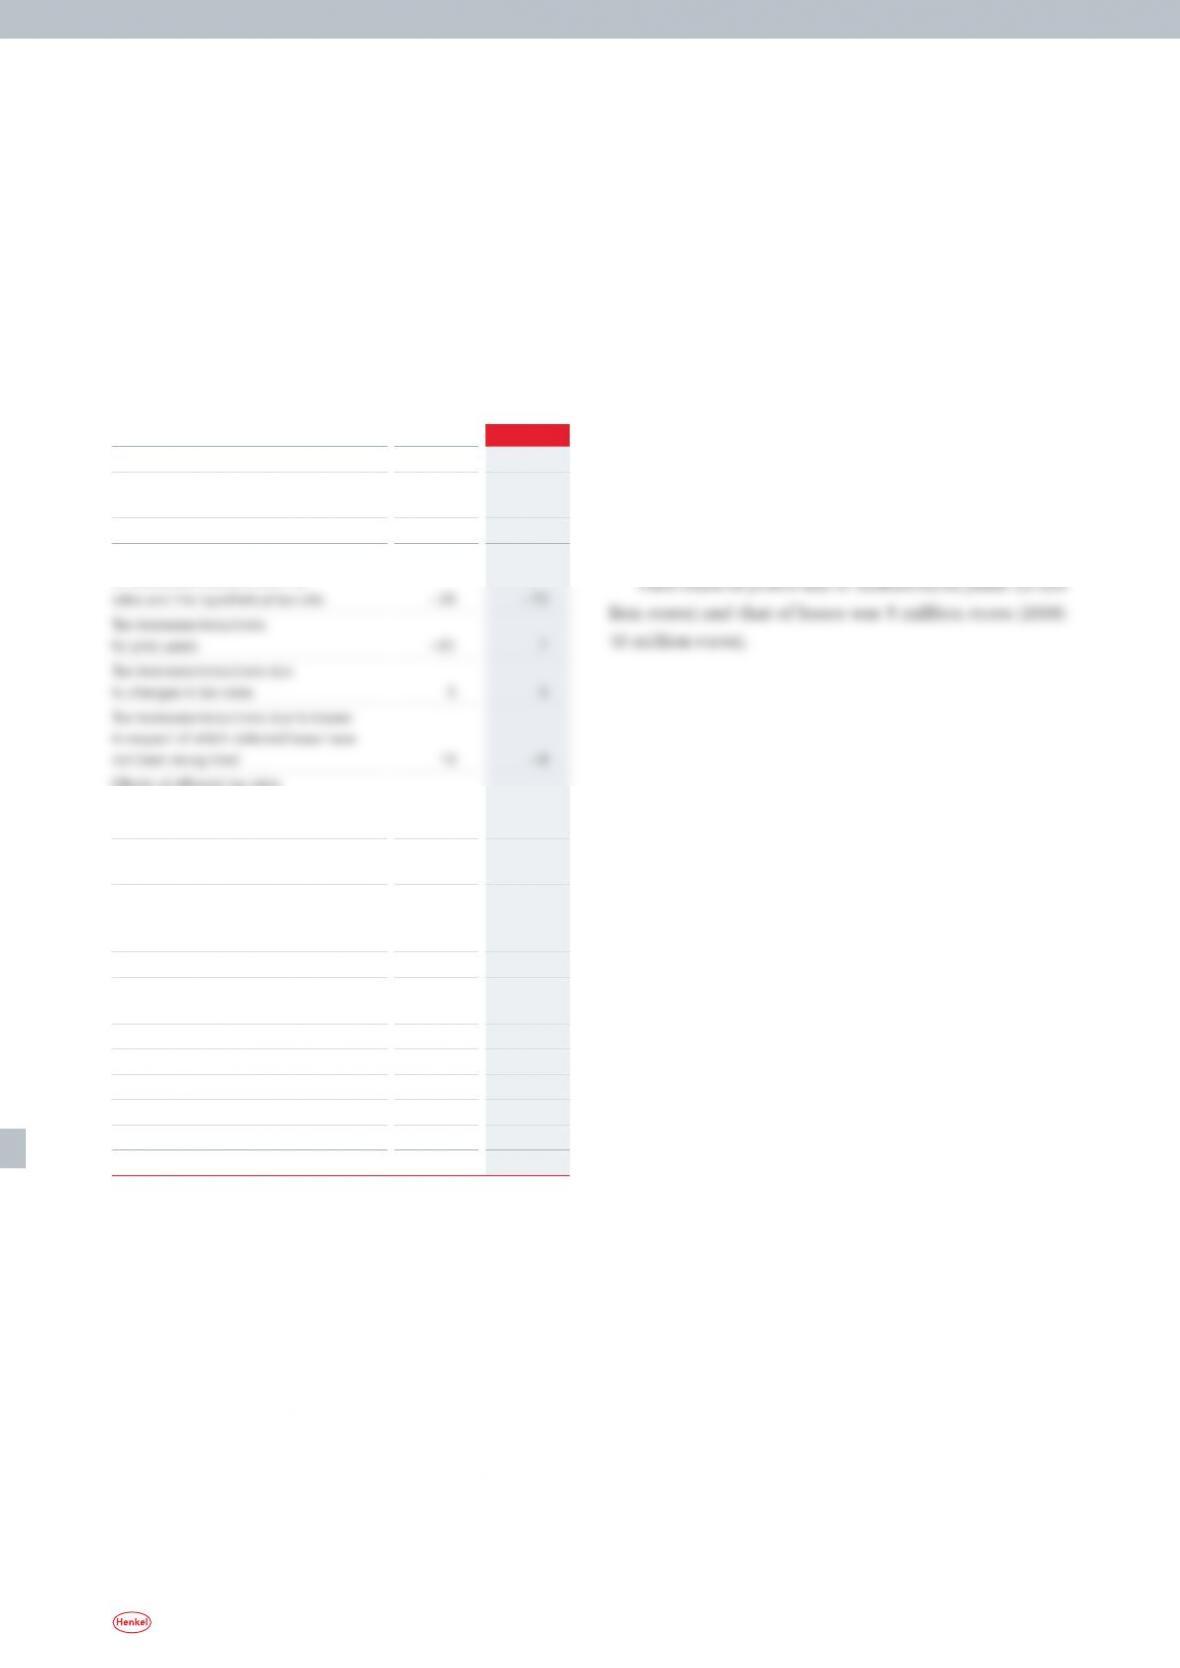
Calculation of the tax charge disclosed
in million euros 2008 2009
Earnings before taxes on income
1,627 885
Tax rate (including trade tax) on income
of Henkel AG & Co. KGaA
31 %
31 %
Estimated tax charge 504 274
Tax increases/reductions due
to differences between local tax
Effects of different tax rates
on net result from investments
(at-equity investments)
– 25 –
Tax increases/reductions due to
tax-free income and other items
– 22 – 22
Tax increases/reductions due to
non-deductible expenses and
other items
52 74
of which
Non-deductible write-down
of intangible assets
– 14
Trade tax additions
10 13
Non-deductible withholding tax
14 14
Other non-deductible expenses
28 33
Tax effect of sale of Ecolab shares
– 43 –
Tax charge disclosed 394 257
Effective tax rate 24.22 % 29.04 %
The increase in the effective tax rate in 2009 to 29.04 per–
cent (2008: 24.22 percent) can be attributed inter alia to the
non-deductible write-down of intangible assets and to the
absence of the effect resulting from the at-equity stake in
Ecolab (in 2008: –1.5 percentage points). The normalized
effective tax rate for 2009 is 27.5 percent.
Deferred tax liabilities have not been recognized on the
retained profits of foreign subsidiaries. The retained profits
are available to the subsidiaries for further investment.
(10) Minority interests
The amount shown here represents the share of profits and
losses attributable to minority shareholders.
95
Annual Report 2009
Notes to the consolidated financial statements » Notes to the consolidated balance sheet
Non-current assets
All non-current assets with definite useful lives are amor–
tized or depreciated using the straight-line method on the
basis of estimated useful lives standardized throughout
Useful life
in years
Intangible assets with definite useful lives 3 to 20
Residential buildings 50
Office buildings 40
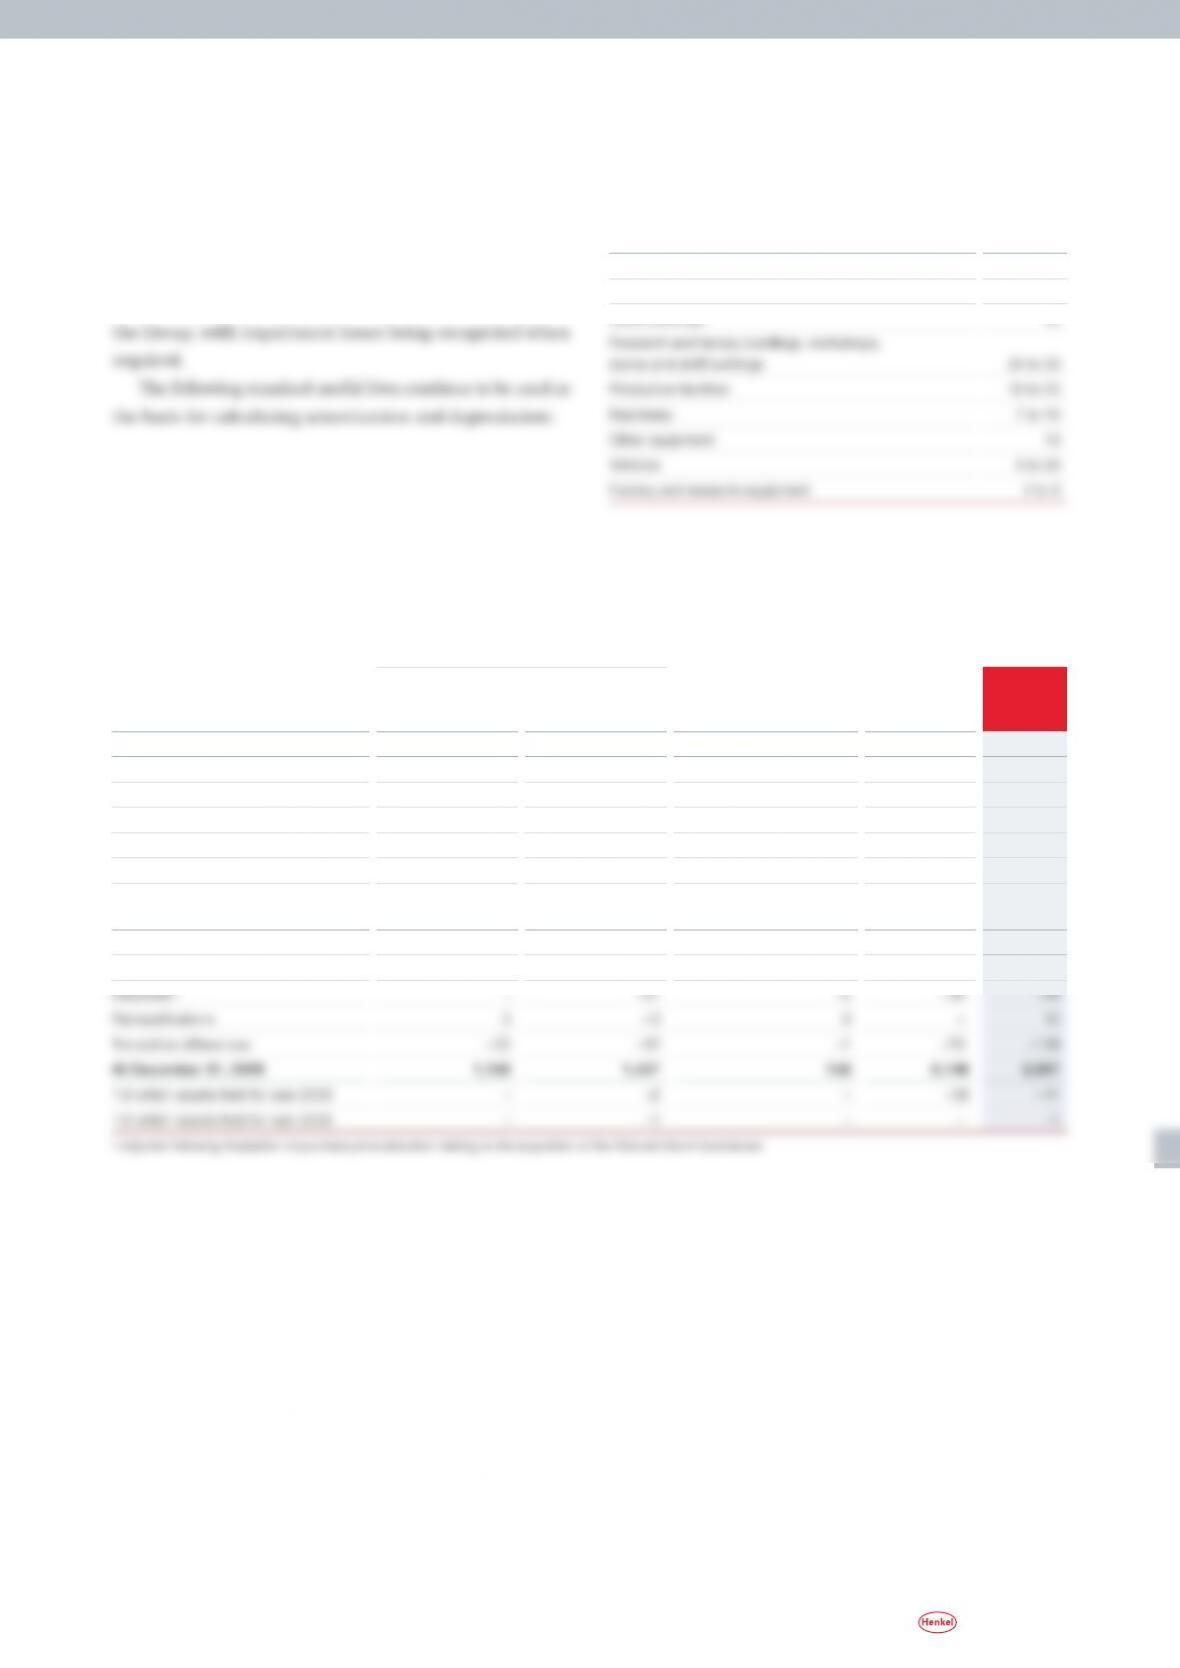
(11) Intangible assets
Cost
in million euros Trademark rights and other rights
Assets with
indefinite
useful lives
Assets with
definite
useful lives
Internally generated
intangible assets with
definite useful lives
Goodwill
Total
At January 1, 2008 1,057 852 123 3,392 5,424
Changes in the Group/Acquisitions 86 597 – 2,638
2)
3,321
Additions – 10 10 –
20
Disposals1) – – 41 – – – 41
Reclassifications – 5 7 4 –
6
Translation differences 63 43 –1 192
297
At December 31, 2008/
January 1, 2009 1,201 1,468 136 6,222
2) 9,027
Changes in the Group/Acquisitions – – –1 40
39
Additions – 11 16 1
28
Notes to the consolidated balance sheet
The accounting policies for balance sheet items are described in the relevant Note.
96 Annual Report 2009
Notes to the consolidated financial statements » Notes to the consolidated balance sheet
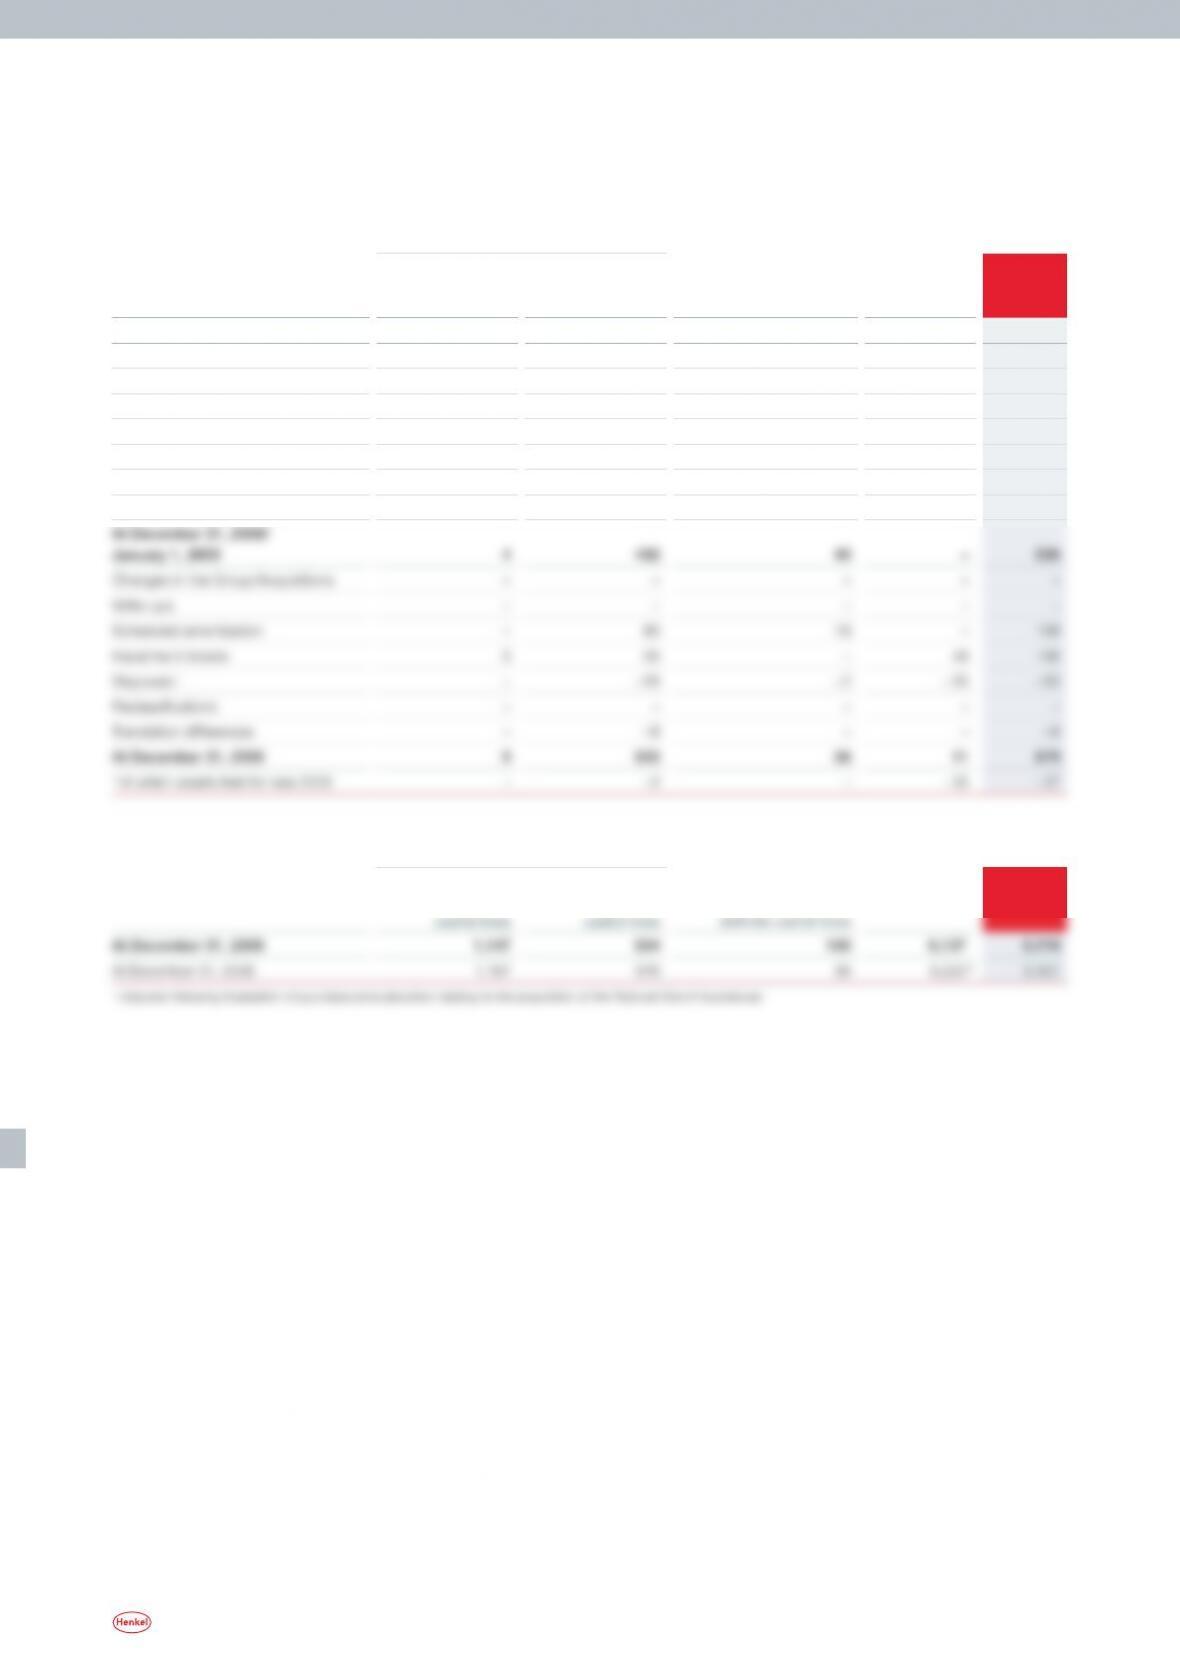
Accumulated amortization
in million euros Trademark rights and other rights
Assets with
indefinite
useful lives
Assets with
definite
useful lives
Internally generated
intangible assets with
definite useful lives
Goodwill
Total
At January 1, 2008 4 457 23 – 484
Changes in the Group/Acquisitions – – – – –
Write-ups – – – – –
Scheduled amortization – 78 17 – 95
Impairment losses – 4 – – 4
Disposals – – 39 – – – 39
Reclassifications – – – – –
Translation differences – – 8 – – – 8
Net book value
in million euros Trademark rights and other rights
Assets with
indefinite
Assets with
definite
Internally generated
intangible assets with
Goodwill
Total
Trademarks and other rights acquired for valuable consider–
ation are stated initially at acquisition cost, while internally
generated software is stated at production cost. Thereafter,
goodwill and trademark rights and other rights with in–
definite useful lives are subject to an impairment test at
least once a year (impairment-only approach). In the course
of our annual impairment test, we reviewed the carrying
values of goodwill and trademark rights and other rights
with indefinite useful lives. The following table shows the
cash-generating units together with the associated goodwill
and trademark rights and other rights with indefinite useful
lives at book value at the balance sheet date.