Unlock document.
This document is partially blurred.
Unlock all pages and 1 million more documents.
Get Access
Chapter 31 NAME
Behavioral Economics
Introduction. In this section we present some problems designed to help
you think about the nature of rational and not-so-rational choice. You
will meet a hyperbolic procrastinator and an exponential procrastinator.
Do these people remind you of anyone you know? You will meet Jake,
who is aware that he has a self-control problem with beer-drinking. For
those who have not experienced Jake’s problem, have you ever avoided
putting a full plate of chocolate chip cookies in front of you, because you
know what will happen if you start eating them? Have you ever had
trouble making a choice because there are too many options available?
How would you react if Harriet Hardnose had you over a barrel? How
rationally do you think the other people that you deal with are likely to
behave?
31.1 (2) It is early Monday morning and Darryl Dawdle must write
a term paper. Darryl’s instructor does not accept late papers and it is
crucial for Darryl to meet the deadline. The paper is due on Thursday
morning, so Darryl has three days to work on it. He knows that it will
take him 12 hours to do the research and write the paper. Darryl hates
working on papers and likes to postpone unpleasant tasks. But he also
knows that it is less painful to spread the work over all three days rather
than doing it all on the last day. For any day, t,letxtbe the number
of hours that he spends on the paper on day t,andxt+1,andxt+2 the
number of hours he spends on the paper the next day and the day after
that. At the beginning of day t, Darryl’s preferences about writing time
over the next 3 days are described by the utility function
2x2
3x2
(a) Suppose that on Monday morning, Darryl makes a plan by choosing
xM,xT,andxWto maximize his utility function
2x2
3x2
subject to the constraint that he puts in a total of 12 hours work on the
paper. This constraint can be written as xM+xT+xW= 12. How
If he is maximizing his utility subject to this constraint, his marginal
disutility for working must be the same on each day. Write two equations,
one that sets his marginal disutility for working on Tuesday equal to
that of working on Monday and one that sets his marginal disutility for
382 BEHAVIORAL ECONOMICS (Ch. 31)
working on Wednesday equal to that of working on Monday. Use these
two equations plus the budget constraint xM+xT+xW=24tosolvefor
xM,xT,andxW.)
(b) On Monday, Darryl spent 2 hours working on his term paper. On
Tuesday morning, when Darryl got up, he knew that he had 10 hours of
work left to do. Before deciding how much work to do on Tuesday, Darryl
consulted his utility function. Since it is now Tuesday, Darryl’s utility
function is
2x2
3x2
where xT,xW,andxTh are hours spent working on Tuesday, Wednesday
and Thursday. Of course work done on Thursday won’t be of any use.
To meet the deadline, Darryl has to complete the remaining work on
Tuesday and Wednesday. Therefore the least painful way to complete his
assignment on time is to choose xTand xWto maximize
2x2
subject to xT+xW= 10. To do this, he sets his marginal disutility for
working on Tuesday equal to that for working on Wednesday. This gives
xT+xW= 10 to determine the number of hours that Darryl will work
on Tuesday 31/3and on Wednesday 62/3. On Monday, when
Darryl made his initial plan, how much did he plan to work on Tuesday?
(c) Suppose that on Monday morning Darryl realizes that when Tuesday
comes, he will not follow the plan that maximizes his Monday preferences,
but will choose to allocate the remainder of the task so as to maximize
U(xT,x
W,0) = −x2
T−1
2x2
W
subject to the constraint that xT+xW=12−xM. Taking this into
account, Darryl makes a new calculation of how much work to do on
Monday. He reasons as follows. On Tuesday, he will choose xTand
xWso that his marginal disutility of working on Tuesday equals that on
Monday. To do this he will choose xW/xT=2. Darryl uses this
equation, along with the constraint equation to xT+xW=12−xM
to solve for the amounts of work he will actually do on Tuesday and
Wednesday if he does xMhours on Monday. When he does this, he finds
that if he works xMhours on Monday, he will work xT(xM)=1
3(12−xM)
and xW(xM)=2
3(12 −xM) hours on Wednesday. Now, for each possible
choice of xM, Darryl knows how much work he will do on Tuesday and
NAME 383
Wednesday. Therefore, on Monday, he can calculate his utility as the
following function of xM
UM(xM)=−x2
M−1
2xT(xM)2−1
3xW(xM)2.
Set the derivative of this expression with respect to xMto find that Darryl
maximizes his utility by working 2.03 hours on Monday.
(d) Does Darryl’s three-period utility function have exponential discount-
is the discount rate δ; if hyperbolic, what is the parameter k?k=1.
31.2 (2) On Monday morning, Polly Putitov faces the same assignment
as Darryl Dawdle. It will also take her 12 hours to finish the term paper.
However on day t, her preferences about time spent writing over the next
3 days are represented by
U(xt,x
t+1,x
t+2)=−x2
t−1
2x2
t+1 −1
4x2
t+2.
(a) Does Polly’s three-period utility function have exponential or hyper-
discount rate δ; if hyperbolic, what is the parameter k?δ=1/2.
(b) On Monday morning Polly makes a plan for finishing the term paper
that maximizes her Monday utility function
U(xM,x
T,x
W)=−x2
M−1
2x2
T−1
4x2
W
subject to xM+xT+xW= 12. How many hours does Polly plan to work
(c) Polly spent 12/7 hours working on the project on Monday and com-
pleted the amount of work she planned to do on Monday. On Tuesday
morning, her utility function is
U(xT,x
W,x
Th)=−x2
T−1
2x2
W−1
4x2
Th.
Since work on Thursday won’t help to get the paper done before the
deadline, she will set xTh = 0, and she will choose xTand xWto maximize
−x2
T−1
2x2
W
384 BEHAVIORAL ECONOMICS (Ch. 31)
subject to the constraint that xT+xWis equal to 12−(12/7). How much
will she work on Tuesday? 12 ×2/7=3.43.On Wednesday?
31.3 (2) Jake likes parties and he likes to drink beer. He knows that if
he drinks too much beer he will not feel well the next day and won’t be
able to get any work done. When Jake is at home, soberly thinking about
the day-after effects of drinking, his preferences for drinking xglasses of
beer at a party are represented by the utility function U0(x)=10x−x2.
Jake is invited to a party on Saturday night, and he knows that there will
be free beer. His alternative is to spend a quiet evening with a teetotaling
friend. Spending the quiet evening with the friend would give him a utility
of 20.
(a) If he goes to the party and drinks the amount of beer that maximizes
U0(x), how many glasses will he drink? 5. What will his utility
be? 25. Is this higher or lower than the utility he would have by staying
(b) Jake has noticed that beer has a strange effect on him. It changes
his utility function. When he drinks more beer he seems to get thirstier
and forget the morning-after costs. In fact, for any number of beers t,
after he has drunk tbeers, his utility function for drinking a total of x
beers becomes Ut(x)=(10+t)x−x2. For example, after he has drunk
5 beers, his utility for drinking a total of xbeers will be 15x−x2,and
his marginal utility for drinking more beer will be 15 −2x.Since
this marginal utility is positive when x= 5, he will choose to drink more
than 5 beers. How many beers must he drink so that his marginal utility
of drinking more beer will be zero? 10. Suppose that before going to
the party, Jake knows that the number of beers he would drink is not
the number that his sober self tells him is optimal, but that he would
drink until his beer-altered preferences tell him to quit. Using his sober
preferences, what utility does he expect to get if he goes to the party?
0. Would he be better off spending the quiet evening at home?
Yes.
31.4 (1) A rare, but fatal, disease afflicts 1 person in 100,000. Re-
searchers have developed a powerful diagnostic test for this disease. Ev-
eryone who has the disease will test positive. Ninety-nine percent of those
NAME 385
who do not have the disease will test negative and one percent will test
positive. Harold Dilemma was given this test during a routine physical
examination and he tested positive. Harold was horrified.
(a) Harold has read about an available surgical procedure. His insurance
will cover the financial cost of this surgery. The surgery would certainly
eliminate the disease if he has it, but whether or not he has the disease,
there is a probability of 1/200 that he would not survive the surgery. Be-
fore doing detailed calculations, do you think that undergoing the surgery
(b) To find the probability that Harold actually has the disease, given
that he tests positive for it, let us reason as follows. The disease afflicts
1 person in 100,000, so in a population of 1,000,000 people, the number
of people who have the disease can be expected to be about 10 .
Suppose that the test is administered to all 1,000,000 people. Given that
one percent of those who do not have the disease will test positive, the
total number of people who test positive for the disease can be expected
to be about 10,000 . Therefore, of all those who test positive for
the disease, the fraction who actually have it is 1/1,000 .So,
given that he tests positive, what is the probability that Harold has the
disease? 1/1,000 . Would Harold improve his survival probability
by undergoing surgery? Explain. No, If he has the
(c) Suppose that this disease afflicted one person in 10,000 rather than one
in 100,000. Then if Harold tested positive, what would be the probability
that he has the disease? 1/100. Would he then improve his survival
probability by undergoing the surgery? Yes.
31.5 (2) Some economists find experimental evidence of systematic dif-
ferences between the amounts that people are willing to pay for an object
and the amounts that they would have to be paid to give it up, if it is
theirs. This is known as the “endowment effect.” Professor Daniel Mc-
Fadden of the University of California devised a classroom experiment to
test for an endowment effect. He randomly sorted students in a large class
into two groups of equal size. Students in one group were given a pencil,
embossed with the class name. McFadden then organized a pencil mar-
ket. Each student who got a pencil was asked to write down the lowest

386 BEHAVIORAL ECONOMICS (Ch. 31)
price at which she would sell her pencil. Students without a pencil were
asked to write down the highest price that they would be willing to pay
for one. Students were told that the instructor would construct a “supply
curve” by arraying the offers from low to high and a “demand curve” by
arraying the bids from high to low. The equilibrium price is the price
at which the supply curve meets the demand curve. Buyers who bid at
least the equilibrium price would get a pen at the equilibrium price and
sellers who offered to sell at prices at or below equilibrium would receive
the equilibrium price for their pens. With these rules, it is in the interest
of every student to bid his true valuation.
(a) McFadden noted that since students who received pencils were ran-
domly selected, the distribution of willingness to pay for a pencil can be
expected to be similar for those who were and those who were not given
pencils. If there is no endowment effect, the lowest price at which a pencil
owner is willing to sell her pencil is equal to the highest price that she
would pay for a pencil. Since preferences in the two groups are approx-
imately the same, we would expect that in equilibrium after the pencils
are bought and sold, the number of pencils held by those who were not
given pencils would be about equal to the number held by those who were
given pencils. If this is the case, what fraction of the non-pencil-owners
02040
60 80 100 120
Pencils
20
40
60
80
100
120
Price
Demand Curve (black line)
Supply Curve (blue line)
50
50
25
75
Supply Curve
fired line)
(b) In Professor McFadden’s classroom, the number of pencils traded
turned out to be much smaller than the number that would be expected
without an endowment effect. An example will show how an endowment
effect might explain this difference. Consider a classroom with 200 stu-
dents randomly split into two groups of 100. Before pencils are handed
out, the distribution of students’ willingness to pay for pencils is the same
within each group. In particular, for any price P(measured in pennies)
between 0 and 100, the number of students in each group who are willing
NAME 387
to pay Por more for a pencil is 100 −P. Suppose that there is no endow-
ment effect. The demand curve of those without pencils is given by the
the demand curve. The pencil-owners have 100 pencils. If they have the
same preferences as the non-pencil-owners, then at price p, they will want
to keep D(P) pencils for themselves. The number that they will supply
is therefore S(P) = 100 −D(P). Substituting from the equation that we
found for D(P), this expression simplifies to S(P)= P.Inthe
grid you find here, use blue ink to draw the supply curve. Supply equals
(c) Suppose that there is an endowment effect that works as follows:
Pencil-owners develop an attachment to their pencils once they get them.
The lowest price that any pencil-owner will accept for her pencil is three
times the amount that she was willing to pay before she got the pencil.
On the figure, use red ink to show the supply curve for pencils, given this
endowment effect. What is the equation for this red supply curve? S(p)=
p/3Assuming that the demand curve of non-pencil-owners does not
31.6 (2) Mark Ting works for Sucker’s Jams and Jellies and is preparing
a supermarket display to highlight the company’s many offerings. Mark’s
previous exhibit was criticized by his boss, Bianca Regina who said “Jam
to the left of me, jam to the right of me, but never jam in front of me!”
So now Mark is under strong pressure to do well. He hired an expensive
economic consultant who discovered that if xtypes of jam are exhib-
ited, the probability that a given passerby will stop and look is given by
max{x/20,1}.Furthermore, if someone stops and looks, the probability
that he will buy is given by max{1−(x/20),0}.
(a) If xtypes of jam are exhibited and 1,000 people walk by, how many
x>20.
(b) If xtypes of jam are exhibited, how many of the people who pass by
388 BEHAVIORAL ECONOMICS (Ch. 31)
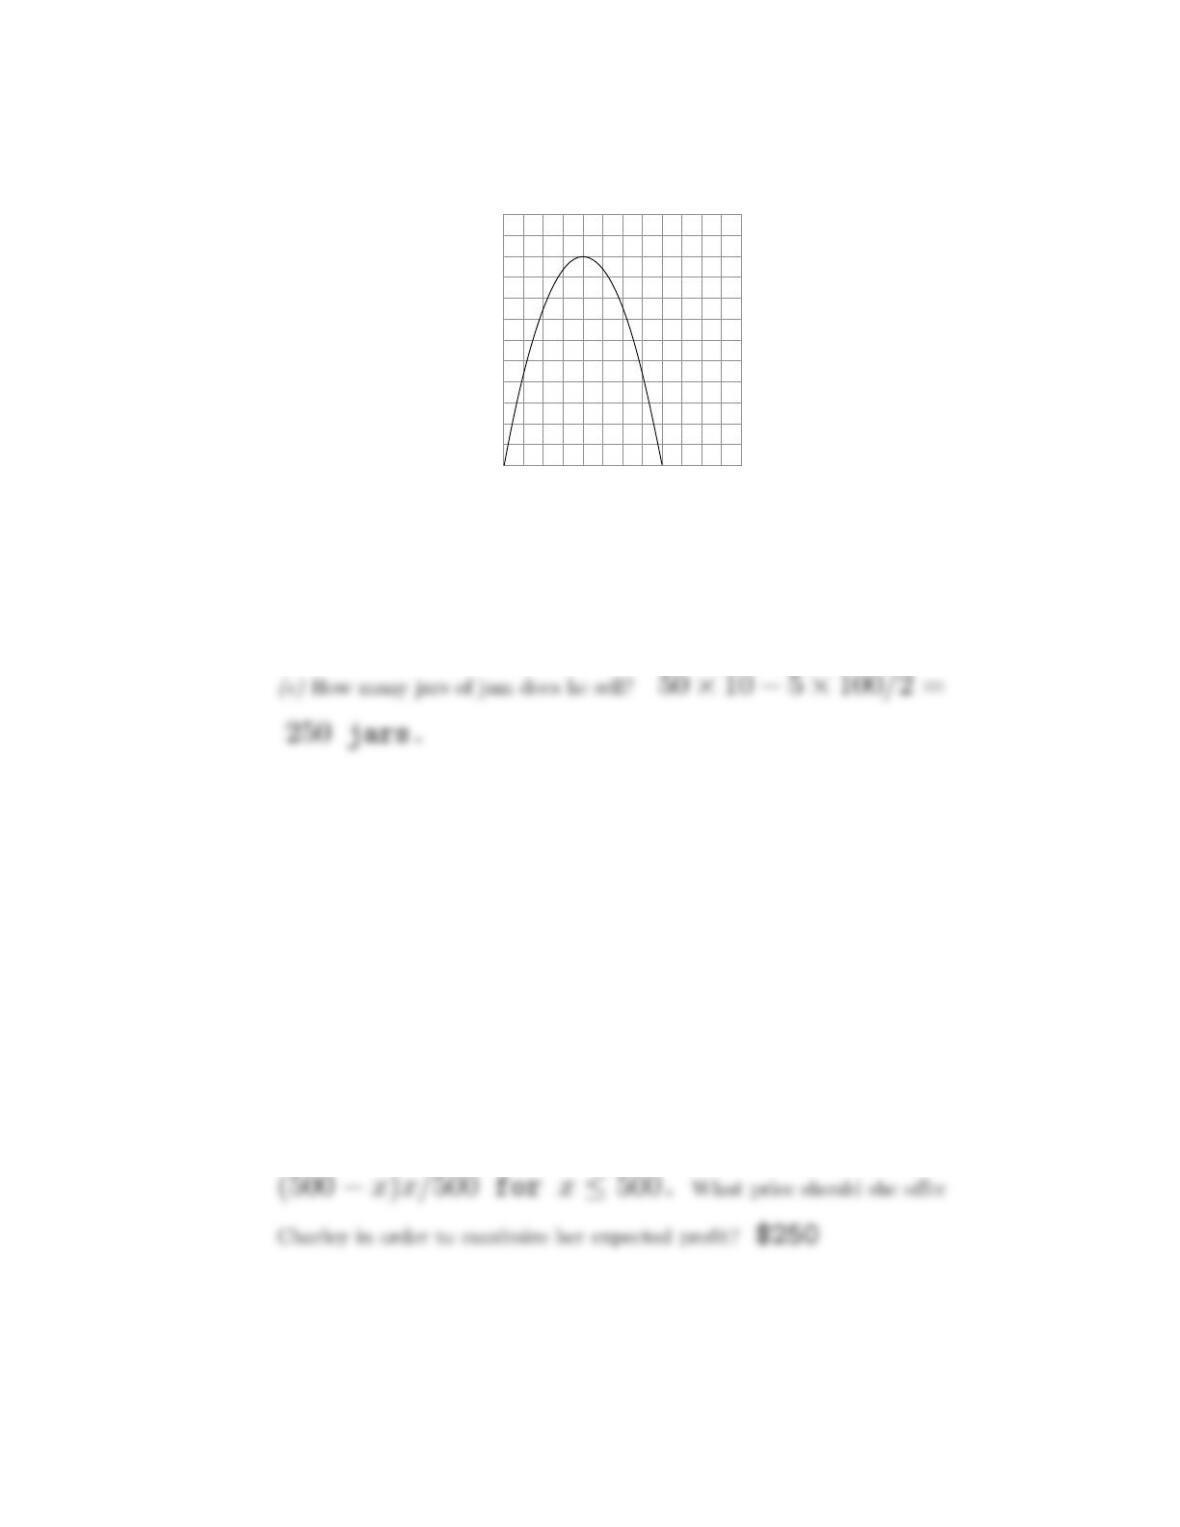
(c) In the graph below, plots sales as a function of x.
0510
15 20 25 30
x
50
100
150
200
250
300
Number of Sales
(d) If Mark chooses xto maximize sales, what value should he choose?
x=10.
31.7 (2) Charley Citrus has to leave town quickly and cannot take his
car with him. Since he does not have time to seek another buyer, he
must either sell it to his neighbor Harriet Hardnose or simply destroy it.
Charley and Harriet both know that the car is worth $500 to Harriet.
There is no time for negotiation. Harriet must make one offer for the car
and Charley will decide either to sell it to her at that price or destroy
it. Harriet has no sympathy for Charley and his dilemma, but she does
know that Charley has a temper and she fears that if she offers too little,
Charley might get angry and destroy the car. In particular, she believes
that the probability that Charley will sell her the car is x/500 for any
x≤$500. Harriet realizes that if she can buy the car for $x, her profit
will be $500 −x, but if he destroys the car, her profit is zero.
(a) Write an expression for Harriet’s expected profit as a function of x.
(b) Suppose that Harriet thinks that Charley is sure to sell the car if she
offers more than $300 and that the probability that Charley will sell her
the car is x/300 for x≤300.
NAME 389
(c) Write an expression for Harriet’s expected profit as a function of x.
(d) Suppose that Harriet thinks that Charley is sure to sell the car if she
offers more than $200 and that the probability that Charley will sell her
the car is x/200 for x≤200. What price should she offer in order to
31.8 (1) A group of people are asked to play the following game. Each
person in the group picks a number between 0 and 100. There is a large
reward for getting an answer that is closest to 2/3 of the average answer
given by the other members of the group.
(a) Sam Smartypants thinks that the other players in the game are really
stupid. He believes that they will choose numbers between 0 and 100 at
random, with an expected value of 50. Sam will maximize his expected
(b) Oona Onestep realizes that the average cannot exceed 100 and so half
the average cannot exceed 50. She thinks that the other people in the
group are about as smart as Sam Smartypants. Given that these people
(c) Talullah Twostep thinks that nobody could be as stupid as Sam Smar-
typants, but that everyone else will reason just like Oona Onestep. Talul-
lah notices however that if everybody else acts like Oona, then she should
not do the same thing that Oona does, but should instead choose a num-
(d) Raquel Rational notes that Sam, Oona, and Talullah all think they
are smarter than everybody else. She asks herself, “What number would
I choose if I thought everyone reasons in the same way that I do?” For
(e) This game is known as the “Beauty Contest Game.” The Beauty Con-
test game has been played in many economics laboratory experiments. It
has also been played by several thousand people who submitted reader
entries in three separate contests conducted by business newspapers in the
UK and Spain and by Spektrum der Wissenschaft, the German edition of
Scientific American. Readers were asked to submit numbers between 0

390 BEHAVIORAL ECONOMICS (Ch. 31)
and 100 with a prize awarded to the number closest to 2/3 of the aver-
age. The game has also been played in laboratory experiments by groups
such as undergraduates at Cal Tech and UCLA, students in Germany and
Singapore, high school students, the Cal Tech board of trustees, and port-
folio managers. In these experiments, typically only a small proportion
of participants respond with numbers of 50 or more. In graphs showing
frequencies of the possible responses, there are spikes at 33.3, at 22.2, and
a modest spike at zero. The mean number selected by readers of Spektrum
der Wissenschaft was 22.08. Mean scores among the various laboratory
groups varied considerably from a low of 21.9 to a high of 46.1. Which
its name, and how each of the groups did, look at “Progress in Behav-
ioral Game Theory,” a paper in the Journal of Economic Perspectives,
Autumn 1997, by Professor Colin Camerer of Cal Tech.)


