Chapter 25 NAME
Monopoly
Introduction. The profit-maximizing output of a monopolist is found by
solving for the output at which marginal revenue is equal to marginal cost.
Having solved for this output, you find the monopolist’s price by plugging
the profit-maximizing output into the demand function. In general, the
marginal revenue function can be found by taking the derivative of the
total revenue function with respect to the quantity. But in the special case
of linear demand, it is easy to find the marginal revenue curve graphically.
With a linear inverse demand curve, p(y)=a−by, the marginal revenue
curve always takes the form MR(y)=a−2by.
25.1 (0) Professor Bong has just written the first textbook in Punk
Economics. It is called Up Your Isoquant. Market research suggests that
the demand curve for this book will be Q=2,000 −100P,wherePis
its price. It will cost $1,000 to set the book in type. This setup cost is
necessary before any copies can be printed. In addition to the setup cost,
there is a marginal cost of $4 per book for every book printed.
(a) The total revenue function for Professor Bong’s book is R(Q)=
(b) The total cost function for producing Professor Bong’s book is C(Q)=
(c) The marginal revenue function is MR(Q)= 20 −Q/50 and
the marginal cost function is MC(Q)= 4.The profit-maximizing
25.2 (0) Peter Morgan sells pigeon pies from a pushcart in Central Park.
Morgan is the only supplier of this delicacy in Central Park. His costs are
zero due to the abundant supplies of raw materials available in the park.
(a) When he first started his business, the inverse demand curve for pigeon
pies was p(y) = 100 −y, where the price is measured in cents and y
312 MONOPOLY (Ch. 25)
0 50 75 100 125
Pigeon pies
25
50
75
100
Cents
25 150
Black
lines
Blue line
Red line
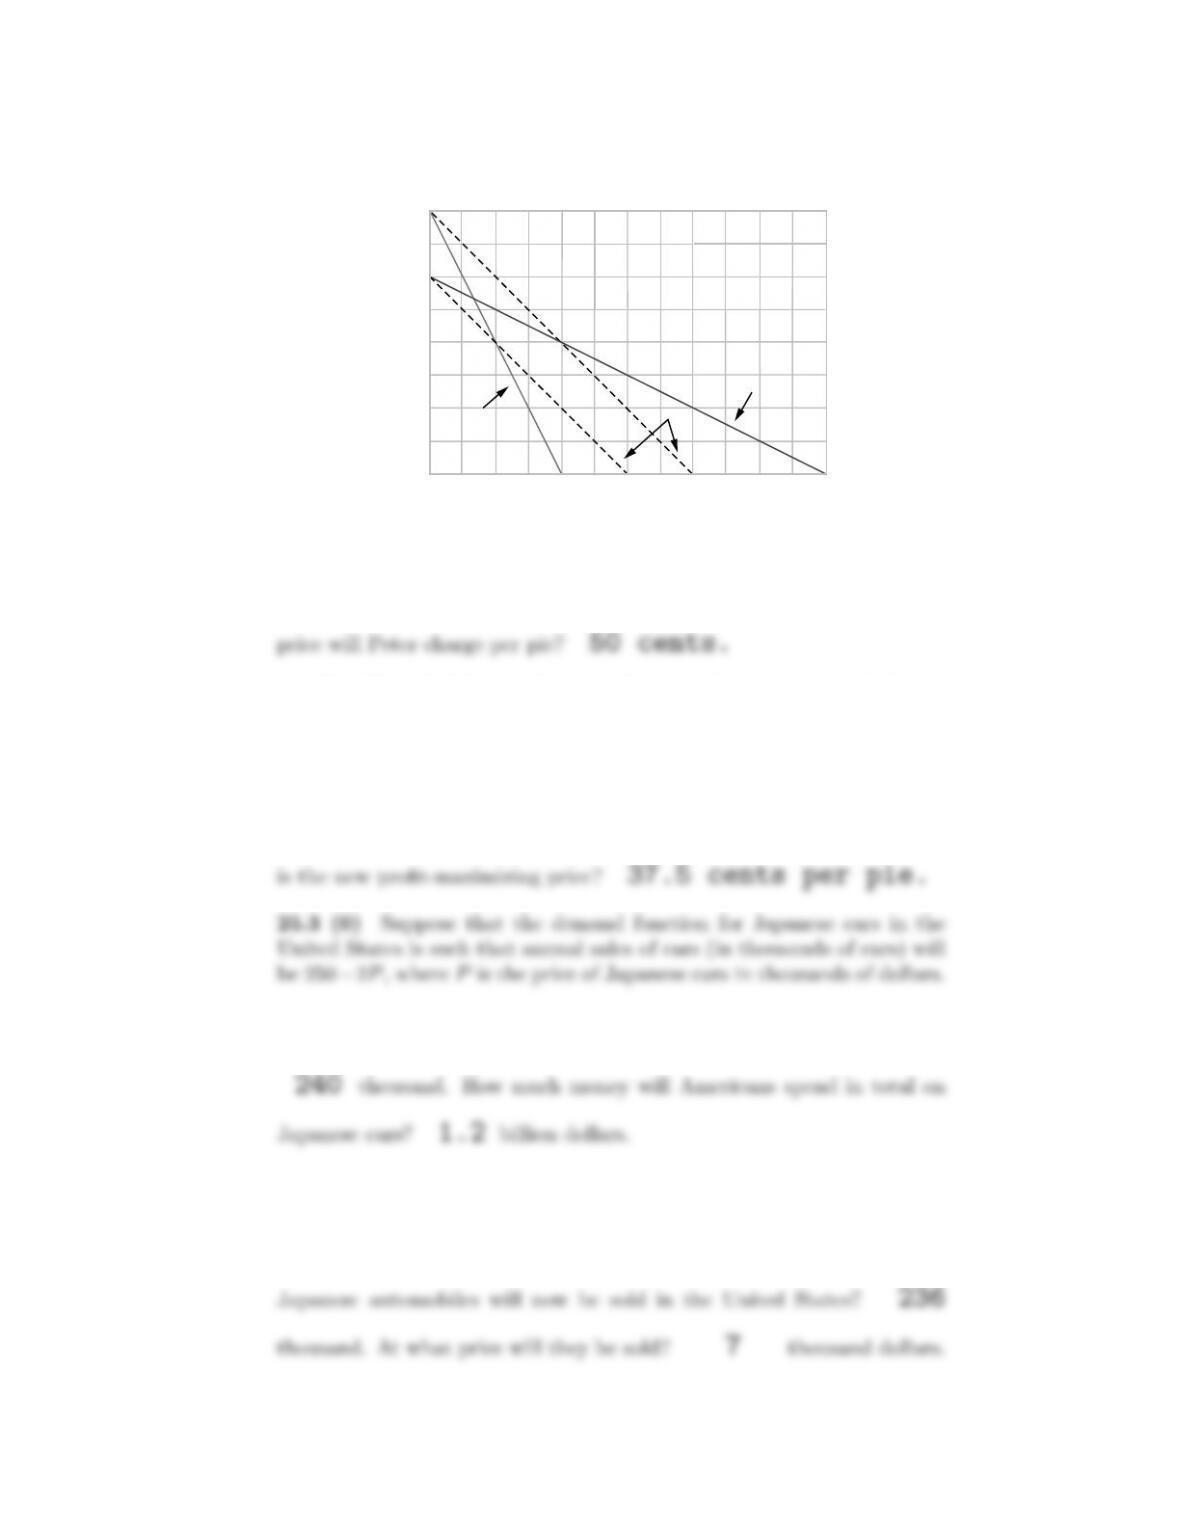
(b) What level of output will maximize Peter’s profits? 50. What
(c) After Peter had been in business for several months, he noticed that
the demand curve had shifted to p(y)=75−y/2. Use blue ink to plot
this curve in the graph above. Plot the new marginal revenue curve on
the same graph with black ink.
(d) What is his profit-maximizing output at this new price? 75. What
(a) If the supply schedule is horizontal at a price of $5,000 what will
be the equilibrium number of Japanese cars sold in the United States?
(b) Suppose that in response to pressure from American car manufactur-
ers, the United States imposes an import duty on Japanese cars in such a
way that for every car exported to the United States the Japanese man-
ufacturers must pay a tax to the U.S. government of $2,000. How many
NAME 313
(c) How much revenue will the U.S. government collect with this tariff?
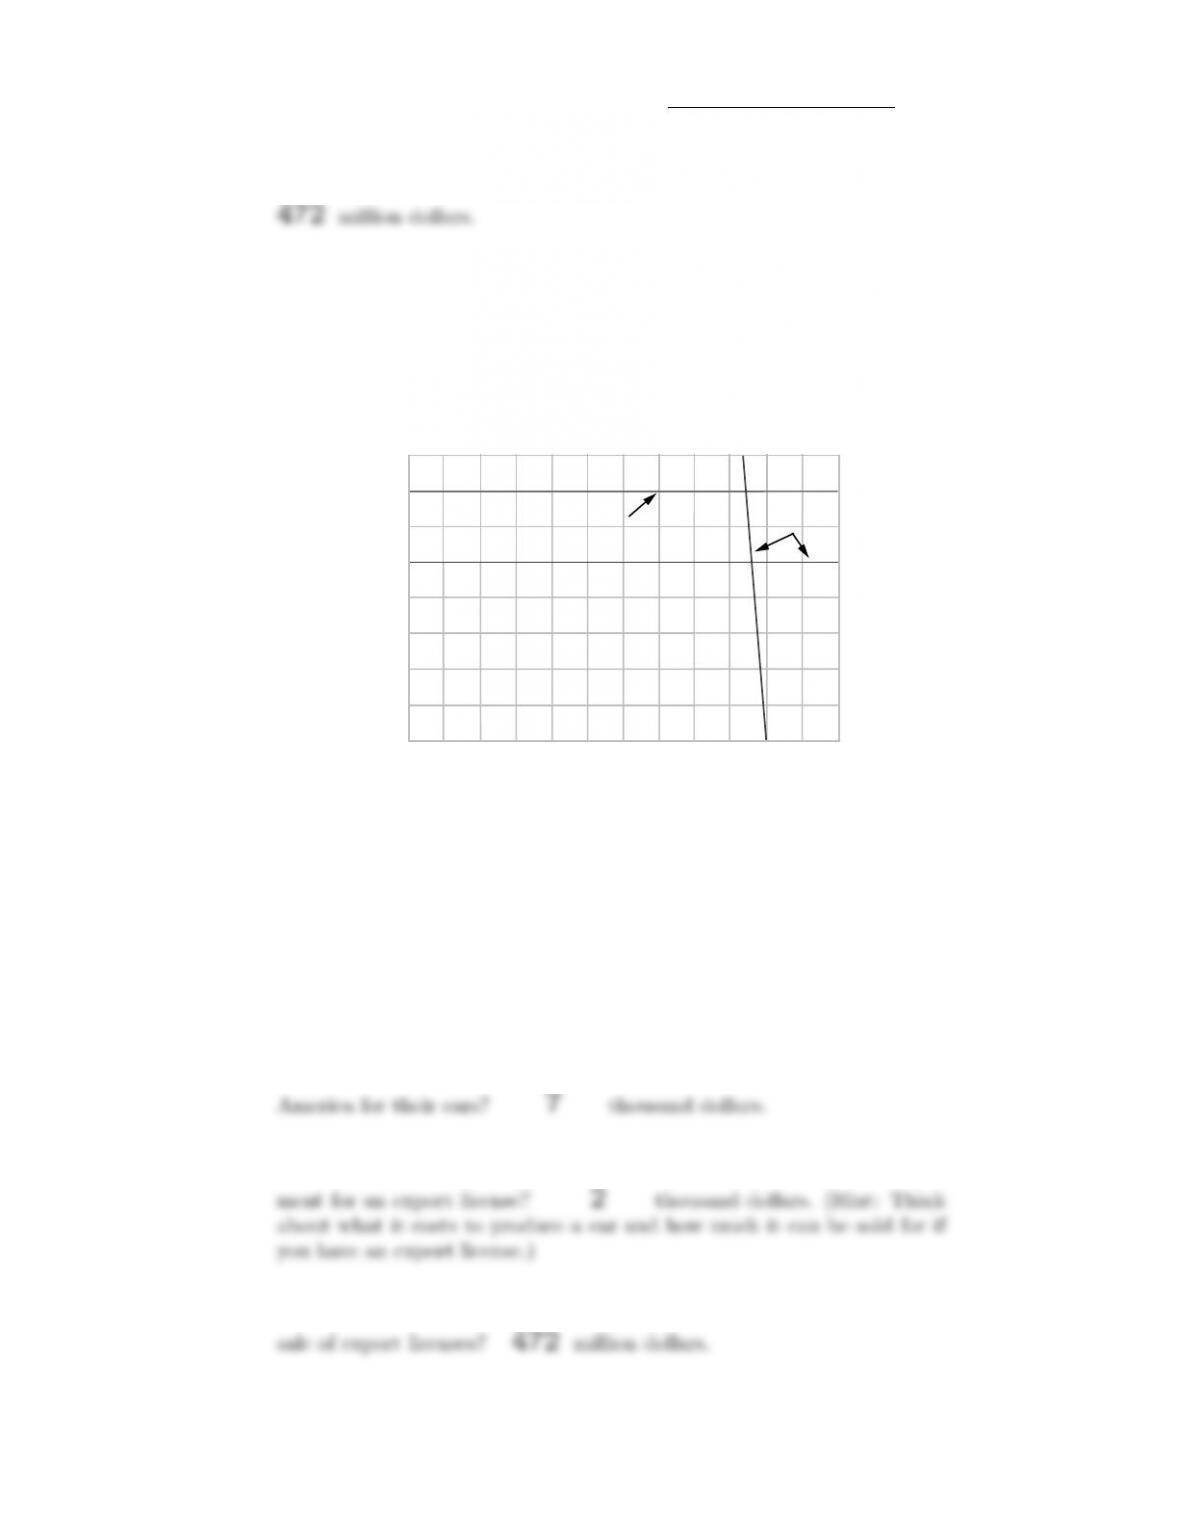
(d) On the graph below, the price paid by American consumers is mea-
sured on the vertical axis. Use blue ink to show the demand and supply
schedules before the import duty is imposed. After the import duty is
imposed, the supply schedule shifts and the demand schedule stays as
before. Use red ink to draw the new supply schedule.
0 100 150 200 250
Japanese autos (thousands)
2
4
6
8
Price (thousands)
50 300
7
5
Blue
lines
Red line
Demand
Supply
Supply with duty
(e) Suppose that instead of imposing an import duty, the U.S. government
persuades the Japanese government to impose “voluntary export restric-
tions” on their exports of cars to the United States. Suppose that the
Japanese agree to restrain their exports by requiring that every car ex-
ported to the United States must have an export license. Suppose further
that the Japanese government agrees to issue only 236,000 export licenses
and sells these licenses to the Japanese firms. If the Japanese firms know
the American demand curve and if they know that only 236,000 Japanese
cars will be sold in America, what price will they be able to charge in
(f) How much will a Japanese firm be willing to pay the Japanese govern-
(g) How much will be the Japanese government’s total revenue from the
314 MONOPOLY (Ch. 25)
billion dollars.
(i) Why might the Japanese “voluntarily” submit to export controls?
25.4 (0) A monopolist has an inverse demand curve given by p(y)=
12 −yand a cost curve given by c(y)=y2.
(b) Suppose the government decides to put a tax on this monopolist so
that for each unit it sells it has to pay the government $2. What will be
(c) Suppose now that the government puts a lump sum tax of $10 on the
25.5 (1) In Gomorrah, New Jersey, there is only one newspaper, the
Daily Calumny. The demand for the paper depends on the price and the
amount of scandal reported. The demand function is Q=15S1/2P−3,
where Qis the number of issues sold per day, Sis the number of column
inches of scandal reported in the paper, and Pis the price. Scandals
are not a scarce commodity in Gomorrah. However, it takes resources to
write, edit, and print stories of scandal. The cost of reporting Sunits
of scandal is $10S. These costs are independent of the number of papers
sold. In addition it costs money to print and deliver the paper. These
cost $.10 per copy and the cost per unit is independent of the amount
of scandal reported in the paper. Therefore the total cost of printing Q
copies of the paper with Scolumn inches of scandal is $10S+.10Q.
(a) Calculate the price elasticity of demand for the Daily Calumny.
NAME 315
(b) Remember that MR =P(1 + 1
). To maximize profits, the Daily
Calumny will set marginal revenue equal to marginal cost. Solve for
the profit-maximizing price for the Calumny to charge per newspaper.
(c) If the Daily Calumny charges the profit-maximizing price and prints
100 column inches of scandal, how many copies would it sell? (Round
(d) Assuming that the paper charges the profit-maximizing price, write
an expression for profits as a function of Qand S.Profits=
.15Q−.10Q−10S.Using the solution for Q(S) that you found
in the last section, substitute Q(S)forQto write an expression for profits
(e) If the Daily Calumny charges its profit-maximizing price, and prints
the profit-maximizing amount of scandal, how many column inches of
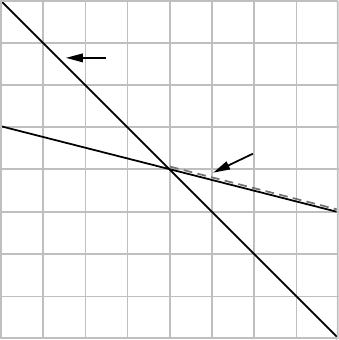
25.6 (0) In the graph below, use black ink to draw the inverse demand
curve, p1(y) = 200 −y.
(a) If the monopolist has zero costs, where on this curve will it choose to
(b) Now draw another demand curve that passes through the profit-
maximizing point and is flatter than the original demand curve. Use
a red pen to mark the part of this new demand curve on which the mo-
nopolist would choose to operate. (Hint: Remember the idea of revealed
preference?)
316 MONOPOLY (Ch. 25)
(c) The monopolist would have (larger, smaller) profits at the new demand
curve than it had at the original demand curve. Larger.
0 50 100 150 200
50
100
150
Quantity
Price
200
Red
Line
Black Line