Chapter 16 NAME
Equilibrium
Introduction. Supply and demand problems are bread and butter for
economists. In the problems below, you will typically want to solve for
equilibrium prices and quantities by writing an equation that sets supply
equal to demand. Where the price received by suppliers is the same as the
price paid by demanders, one writes supply and demand as functions of
the same price variable, p, and solves for the price that equalizes supply
and demand. But if, as happens with taxes and subsidies, suppliers face
different prices from demanders, it is a good idea to denote these two
prices by separate variables, psand pd. Then one can solve for equilibrium
by solving a system of two equations in the two unknowns psand pd.The
two equations are the equation that sets supply equal to demand and
the equation that relates the price paid by demanders to the net price
received by suppliers.
Example: The demand function for commodity xis q=1,000 −10pd,
where pdis the price paid by consumers. The supply function for xis
q= 100 + 20ps,wherepsis the price received by suppliers. For each unit
sold, the government collects a tax equal to half of the price paid by con-
sumers. Let us find the equilibrium prices and quantities. In equilibrium,
supply must equal demand, so that 1,000 −10pd= 100 + 20ps. Since the
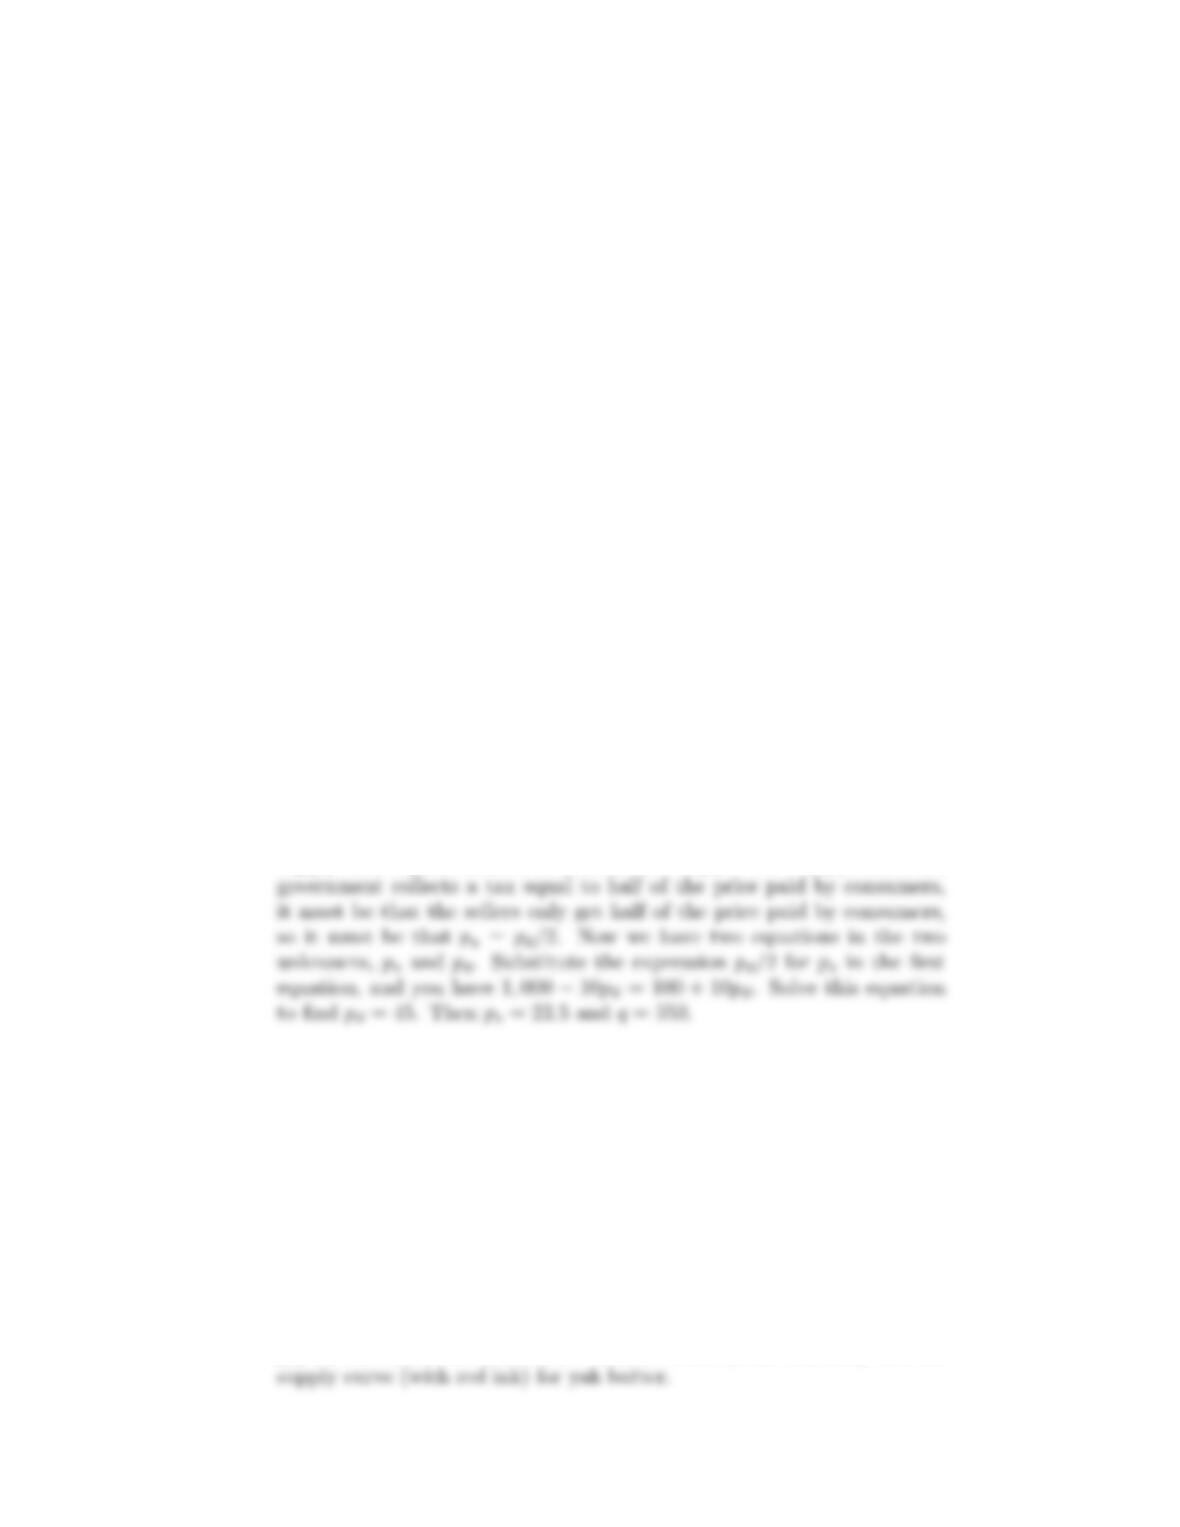
16.1 (0) The demand for yak butter is given by 120 −4pdand the
supply is 2ps−30, where pdis the price paid by demanders and psis
the price received by suppliers, measured in dollars per hundred pounds.
Quantities demanded and supplied are measured in hundred-pound units.
(a) On the axes below, draw the demand curve (with blue ink) and the
202 EQUILIBRIUM (Ch. 16)
0 40 60 80 100
Yak butter
20
40
60
80
Price
20 120
Blue line
Red line
p1
q1q2
p2
(b) Write down the equation that you would solve to find the equilibrium
(d) A terrible drought strikes the central Ohio steppes, traditional home-
land of the yaks. The supply schedule shifts to 2ps−60. The demand
schedule remains as before. Draw the new supply schedule. Write down
the equation that you would solve to find the new equilibrium price of
Locate the new equilibrium price and quantity on the graph and label
them p2and q2.
(f) The government decides to relieve stricken yak butter consumers and
producers by paying a subsidy of $5 per hundred pounds of yak butter
to producers. If pdis the price paid by demanders for yak butter, what
is the total amount received by producers for each unit they produce?
NAME 203
(g) Write down an equation that can be solved for the equilibrium price
(h) Suppose the government had paid the subsidy to consumers rather
than producers. What would be the equilibrium net price paid by con-
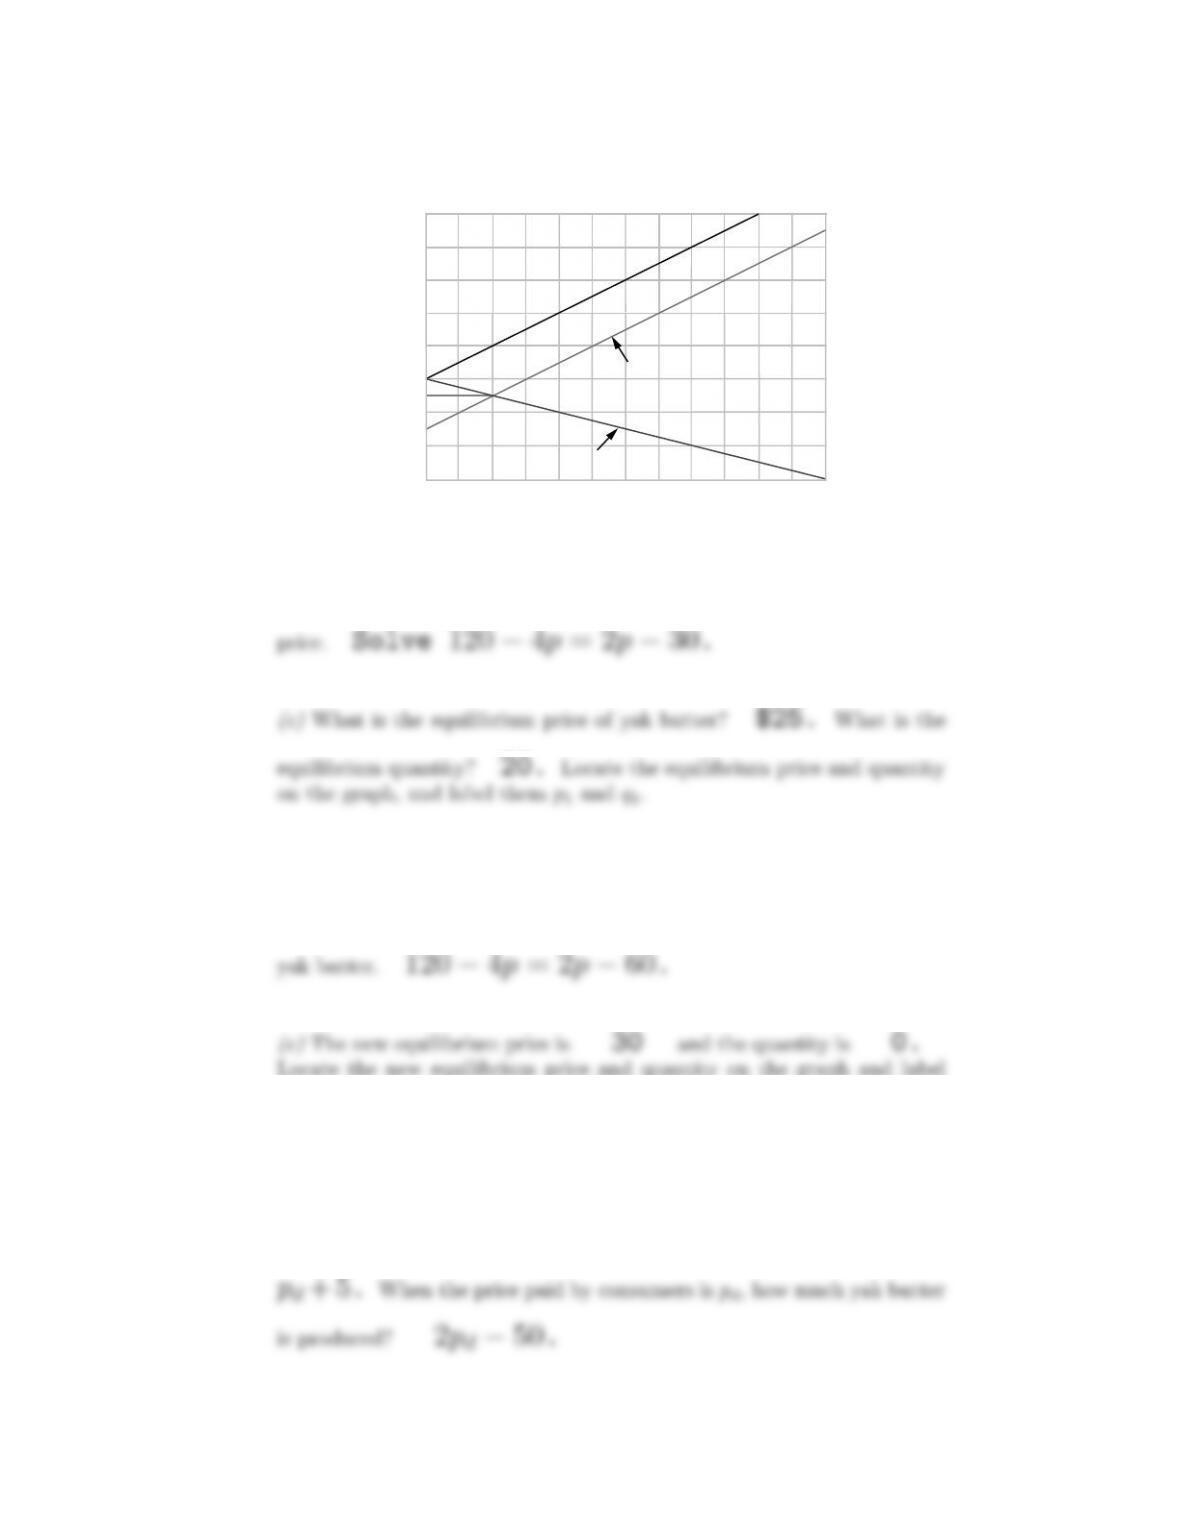
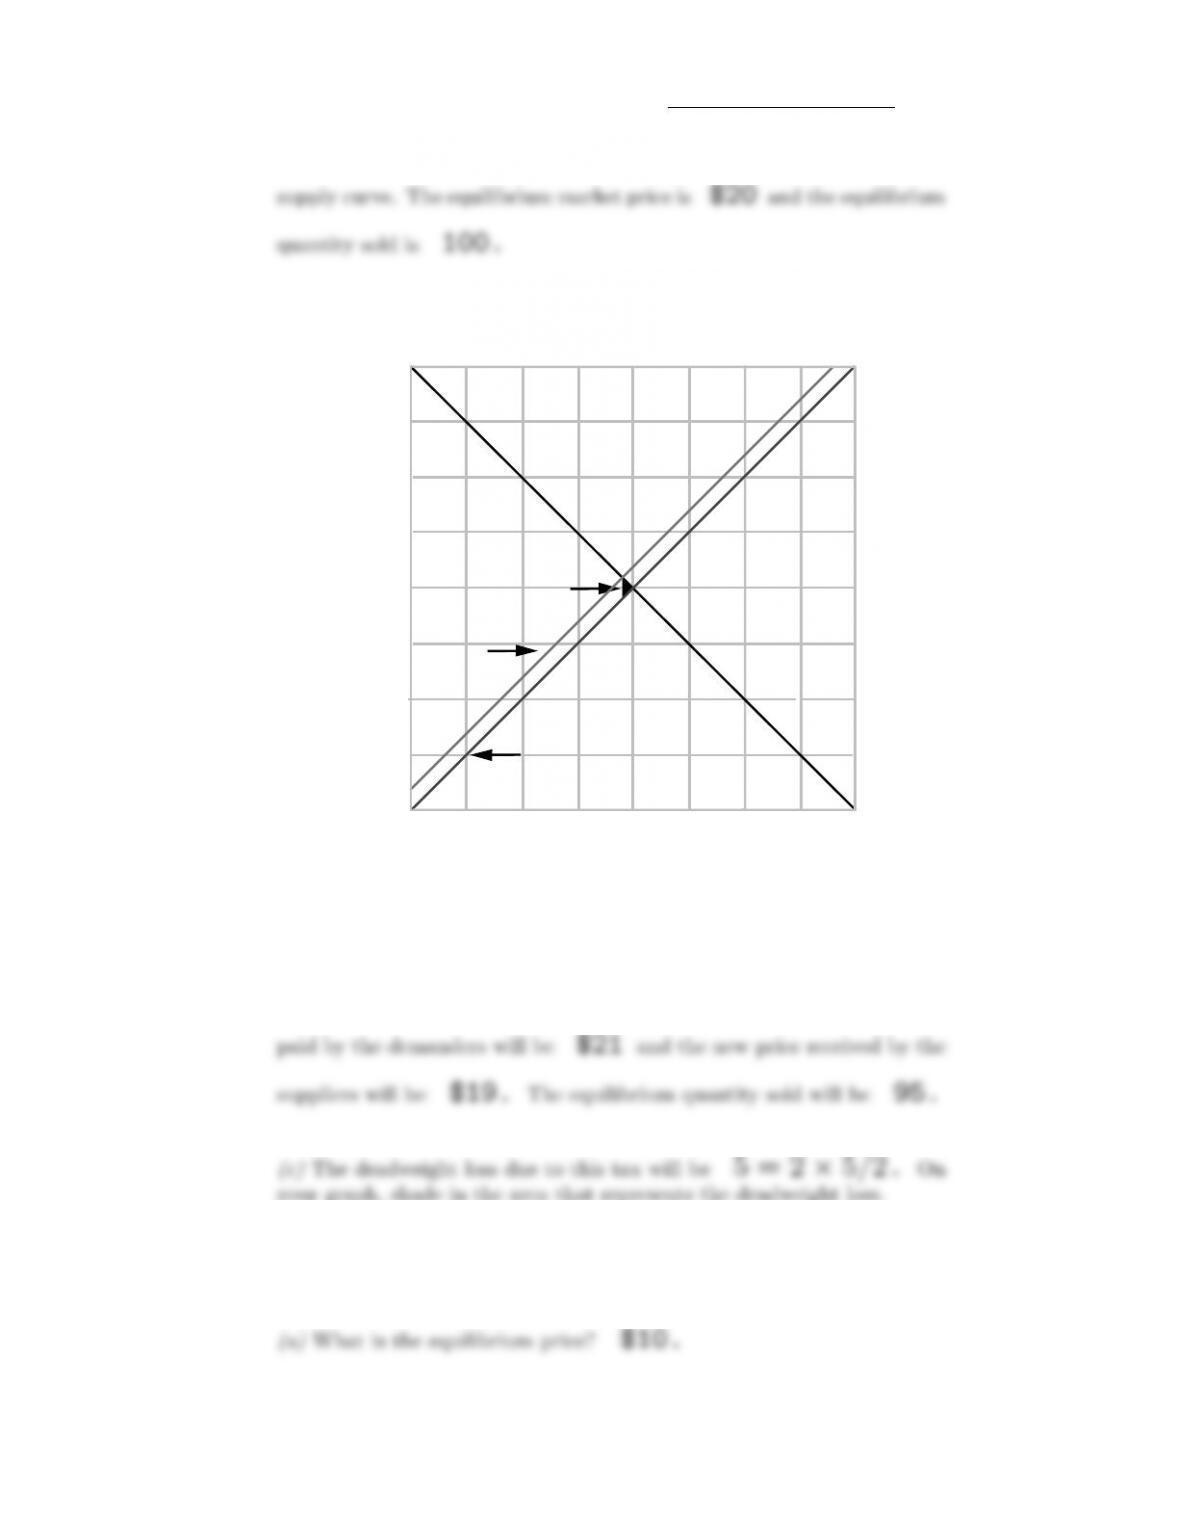
16.2 (0) Here are the supply and demand equations for throstles, where
pis the price in dollars:
D(p)=40−p
S(p)=10+p.
On the axes below, draw the demand and supply curves for throstles,
using blue ink.
0102030
40
10
20
30
40
Price
Throstles
Demand
Supply
Deadweight
loss
(a) The equilibrium price of throstles is 15 and the equilibrium
(b) Suppose that the government decides to restrict the industry to selling
204 EQUILIBRIUM (Ch. 16)
(c) The government wants to make sure that only 20 throstles are bought,
but it doesn’t want the firms in the industry to receive more than the
minimum price that it would take to have them supply 20 throstles. One
way to do this is for the government to issue 20 ration coupons. Then
in order to buy a throstle, a consumer would need to present a ration
coupon along with the necessary amount of money to pay for the good.
If the ration coupons were freely bought and sold on the open market,
(d) On the graph above, shade in the area that represents the deadweight
loss from restricting the supply of throstles to 20. How much is this ex-
pressed in dollars? (Hint: What is the formula for the area of a triangle?)
16.3 (0) The demand curve for ski lessons is given by D(pD) = 100−2pD
and the supply curve is given by S(pS)=3pS.
(b) A tax of $10 per ski lesson is imposed on consumers. Write an equation
that relates the price paid by demanders to the price received by suppliers.
(c) Solve these two equations for the two unknowns pSand pD. With
(d) A senator from a mountainous state suggests that although ski lesson
consumers are rich and deserve to be taxed, ski instructors are poor and
deserve a subsidy. He proposes a $6 subsidy on production while main-
taining the $10 tax on consumption of ski lessons. Would this policy have
any different effects for suppliers or for demanders than a tax of $4 per
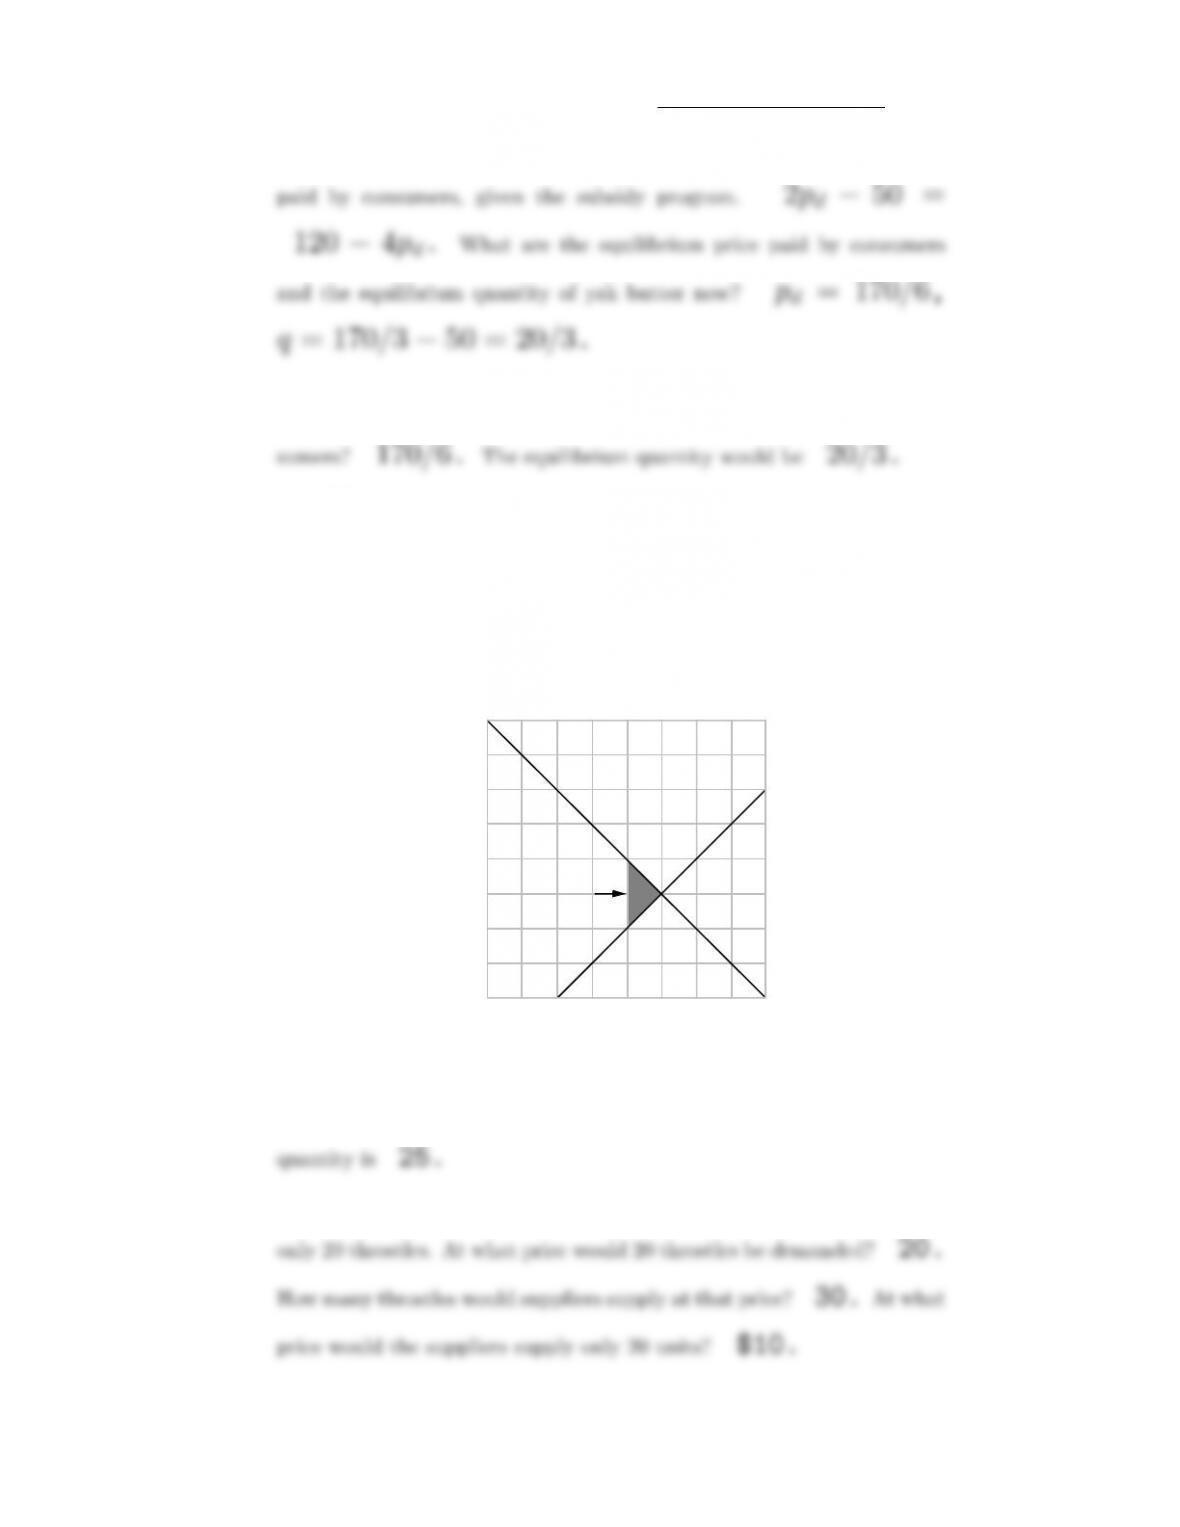
16.4 (0) The demand curve for salted codfish is D(P) = 200 −5Pand
the supply curve S(P)=5P.
NAME 205
(a) On the graph below, use blue ink to draw the demand curve and the
0 50 100 150 200
10
20
30
40
Price
Quantity of codfish
Demand
Blue Supply
Deadweight
loss
Red
supply
(b) A quantity tax of $2 per unit sold is placed on salted codfish. Use red
ink to draw the new supply curve, where the price on the vertical axis
remains the price per unit paid by demanders. The new equilibrium price
your graph, shade in the area that represents the deadweight loss.
16.5 (0) The demand function for merino ewes is D(P) = 100/P ,and
the supply function is S(P)=P.
206 EQUILIBRIUM (Ch. 16)
(c) An ad valorem tax of 300% is imposed on merino ewes so that the
price paid by demanders is four times the price received by suppliers.
What is the equilibrium price paid by the demanders for merino ewes
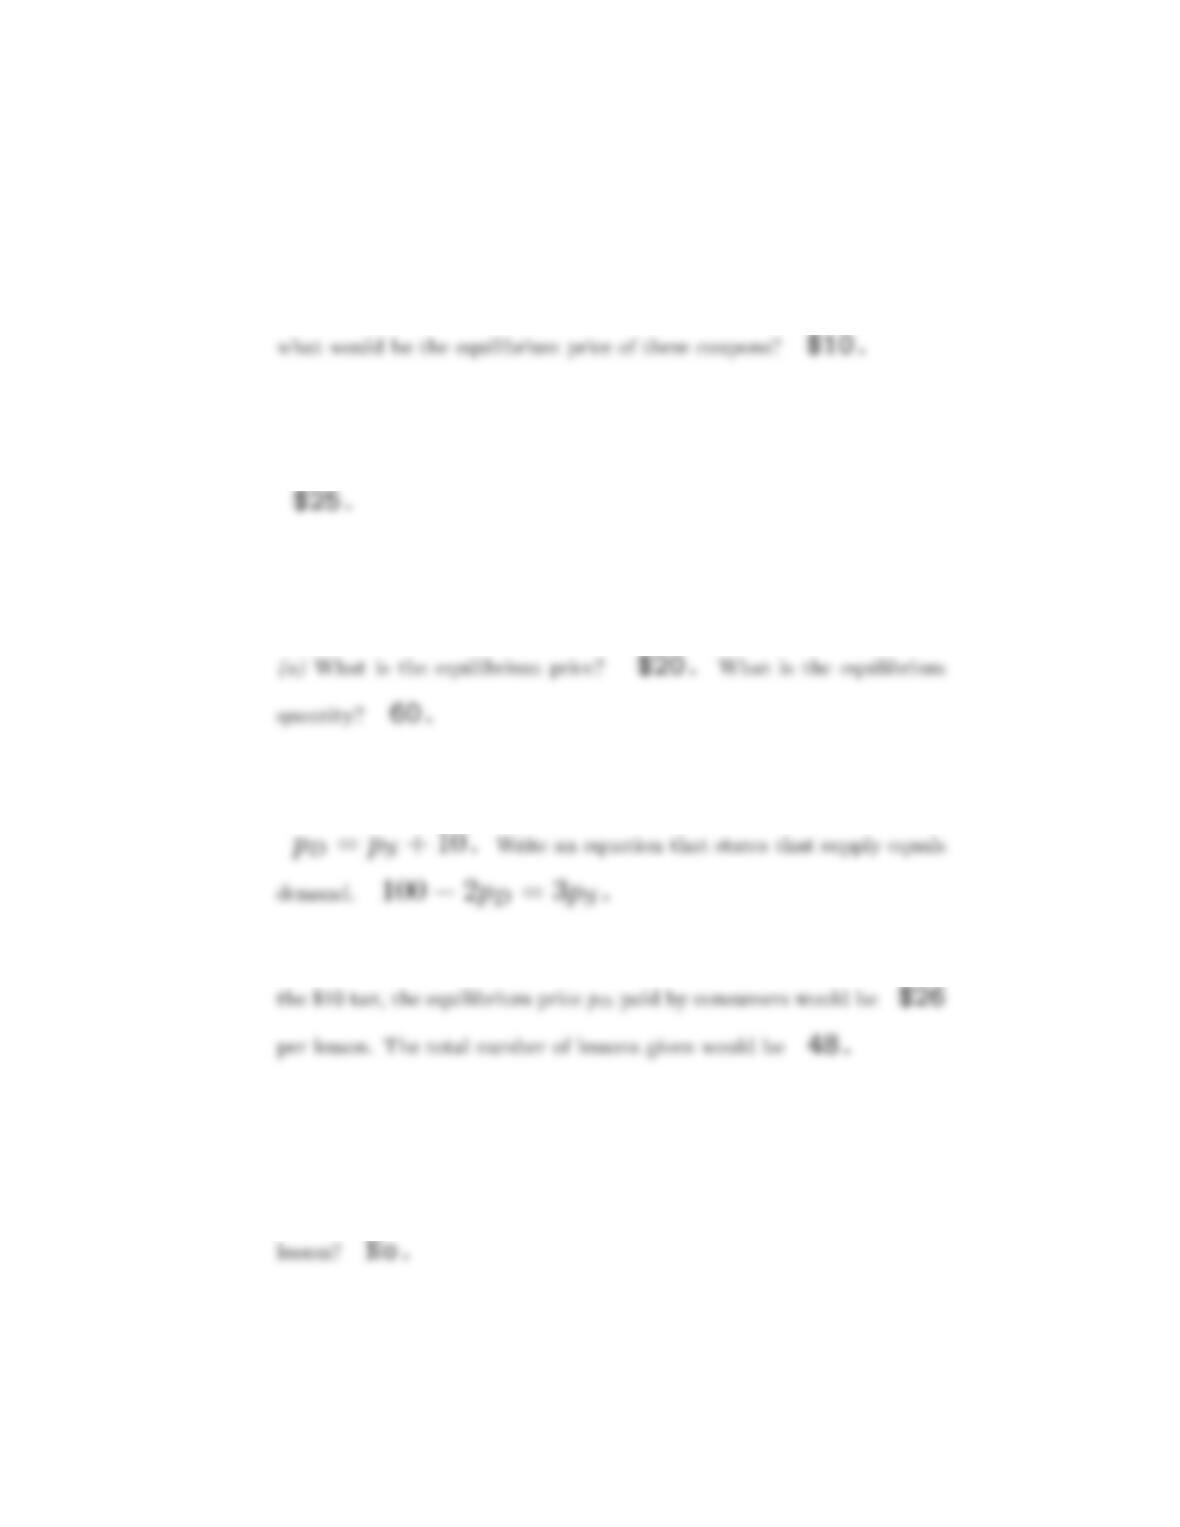
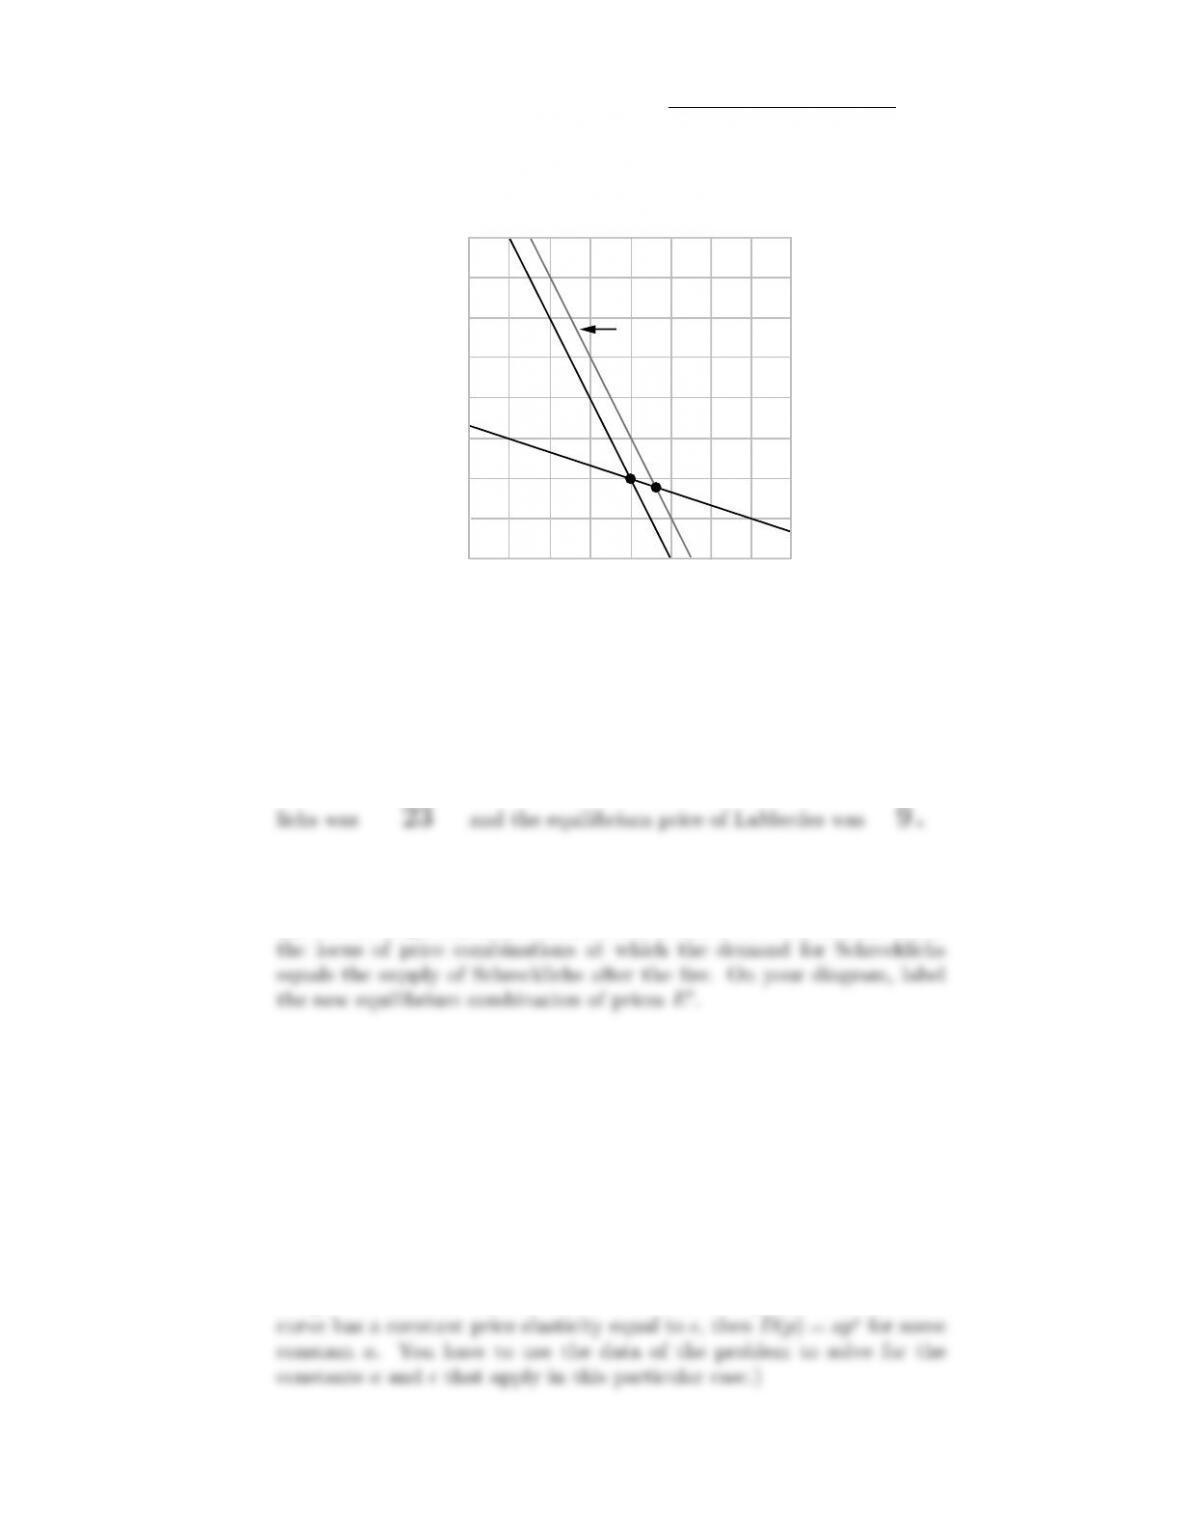
16.6 (0) Schrecklich and LaMerde are two justifiably obscure nineteenth-
century impressionist painters. The world’s total stock of paintings by
Schrecklich is 100, and the world’s stock of paintings by LaMerde is 150.
The two painters are regarded by connoisseurs as being very similar in
style. Therefore the demand for either painter’s work depends both on its
own price and the price of the other painter’s work. The demand function
for Schrecklichs is DS(P) = 200−4PS−2PL, and the demand function for
LaMerdes is DL(P) = 200 −3PL−PS,wherePSand PLare respectively
the price in dollars of a Schrecklich painting and a LaMerde painting.
(a) Write down two simultaneous equations that state the equilibrium
condition that the demand for each painter’s work equals supply.
(b) Solving these two equations, one finds that the equilibrium price of
(c) On the diagram below, draw a line that represents all combinations of
prices for Schrecklichs and LaMerdes such that the supply of Schrecklichs
equals the demand for Schrecklichs. Draw a second line that represents
those price combinations at which the demand for LaMerdes equals the
supply of LaMerdes. Label the unique price combination at which both
markets clear with the letter E.
NAME 207
0102030
40
10
20
30
40
Pl
Ps
e
Schrecklich
La Mendes
Red line
e’
(d) A fire in a bowling alley in Hamtramck, Michigan, destroyed one of
the world’s largest collections of works by Schrecklich. The fire destroyed
a total of 10 Schrecklichs. After the fire, the equilibrium price of Schreck-
(e) On the diagram you drew above, use red ink to draw a line that shows
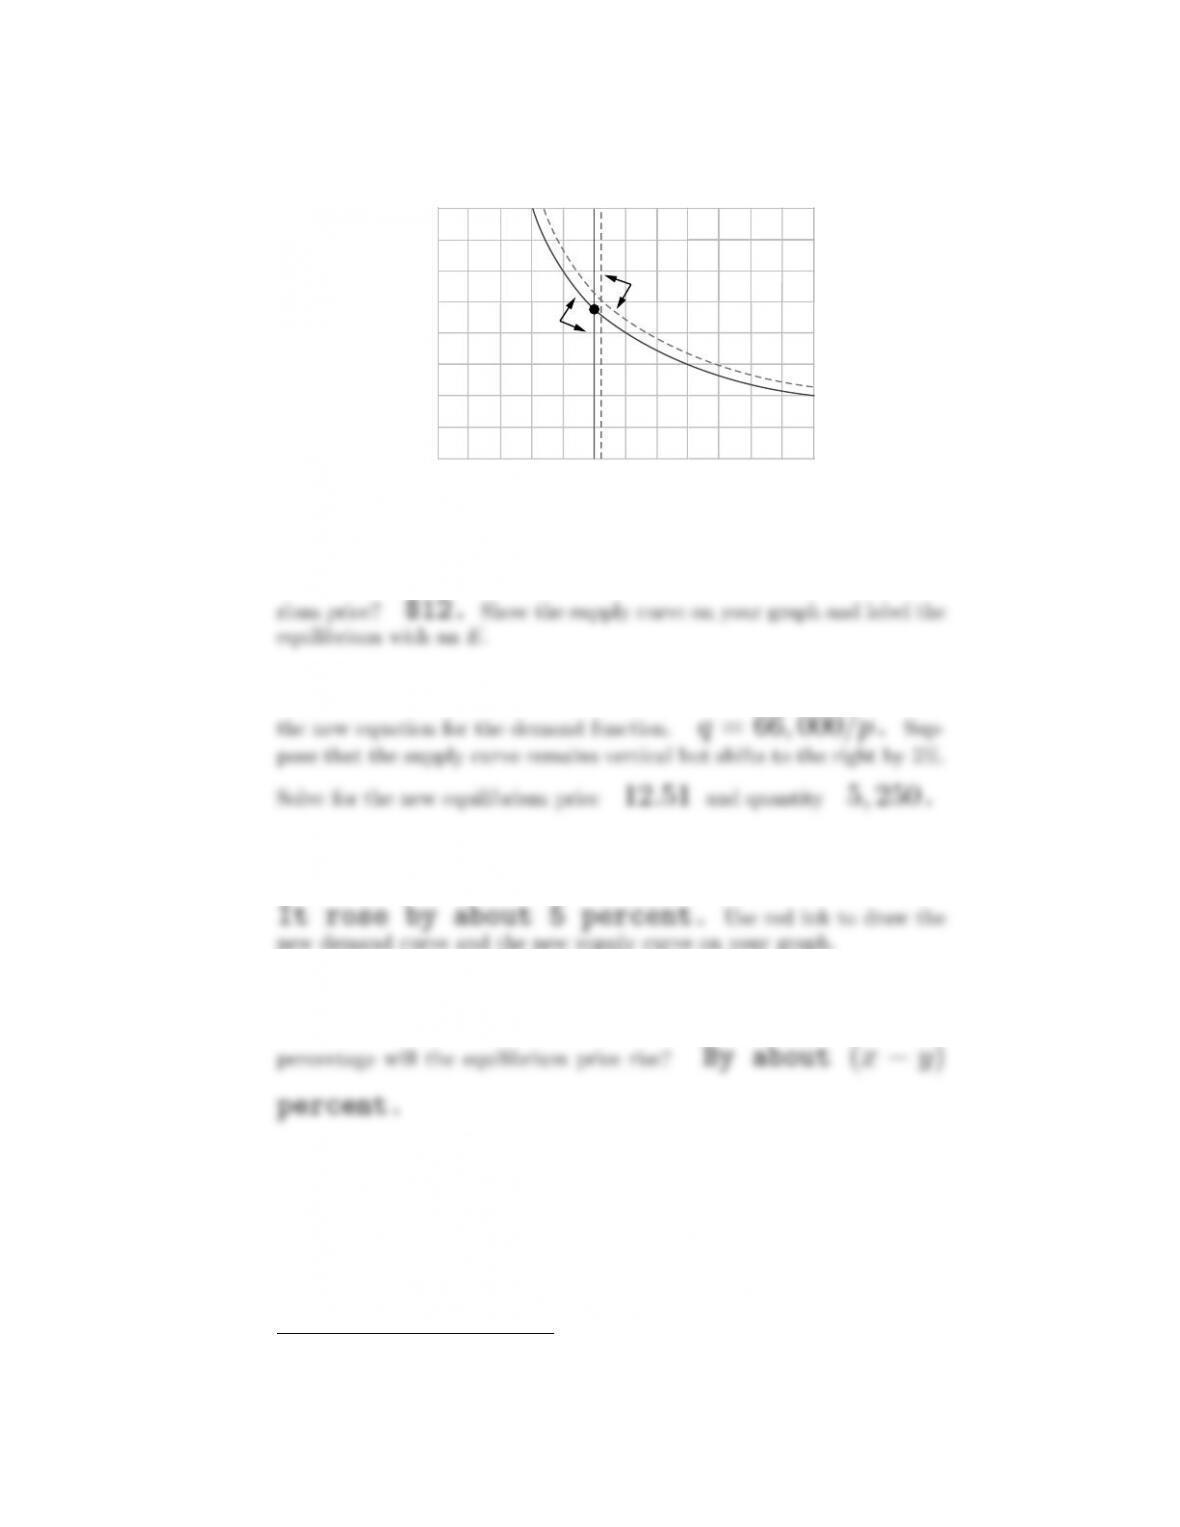
16.7 (0) The price elasticity of demand for oatmeal is constant and
equal to −1. When the price of oatmeal is $10 per unit, the total amount
demanded is 6,000 units.
(a) Write an equation for the demand function. q=60,000/p.
Graph this demand function below with blue ink. (Hint: If the demand
208 EQUILIBRIUM (Ch. 16)
046810
Quantity (thousands)
5
10
15
20
Price
212
e
Red lines
Blue lines
(b) If the supply is perfectly inelastic at 5,000 units, what is the equilib-
(c) Suppose that the demand curve shifts outward by 10%. Write down
(d) By what percentage approximately did the equilibrium price rise?
new demand curve and the new supply curve on your graph.
(e) Suppose that in the above problem the demand curve shifts outward
by x% and the supply curve shifts right by y%. By approximately what
16.8 (0) An economic historian* reports that econometric studies in-
dicate for the pre–Civil War period, 1820–1860, the price elasticity of
demand for cotton from the American South was approximately −1. Due
to the rapid expansion of the British textile industry, the demand curve
for American cotton is estimated to have shifted outward by about 5%
per year during this entire period.
* Gavin Wright, The Political Economy of the Cotton South,W.W.
Norton, 1978.
NAME 209
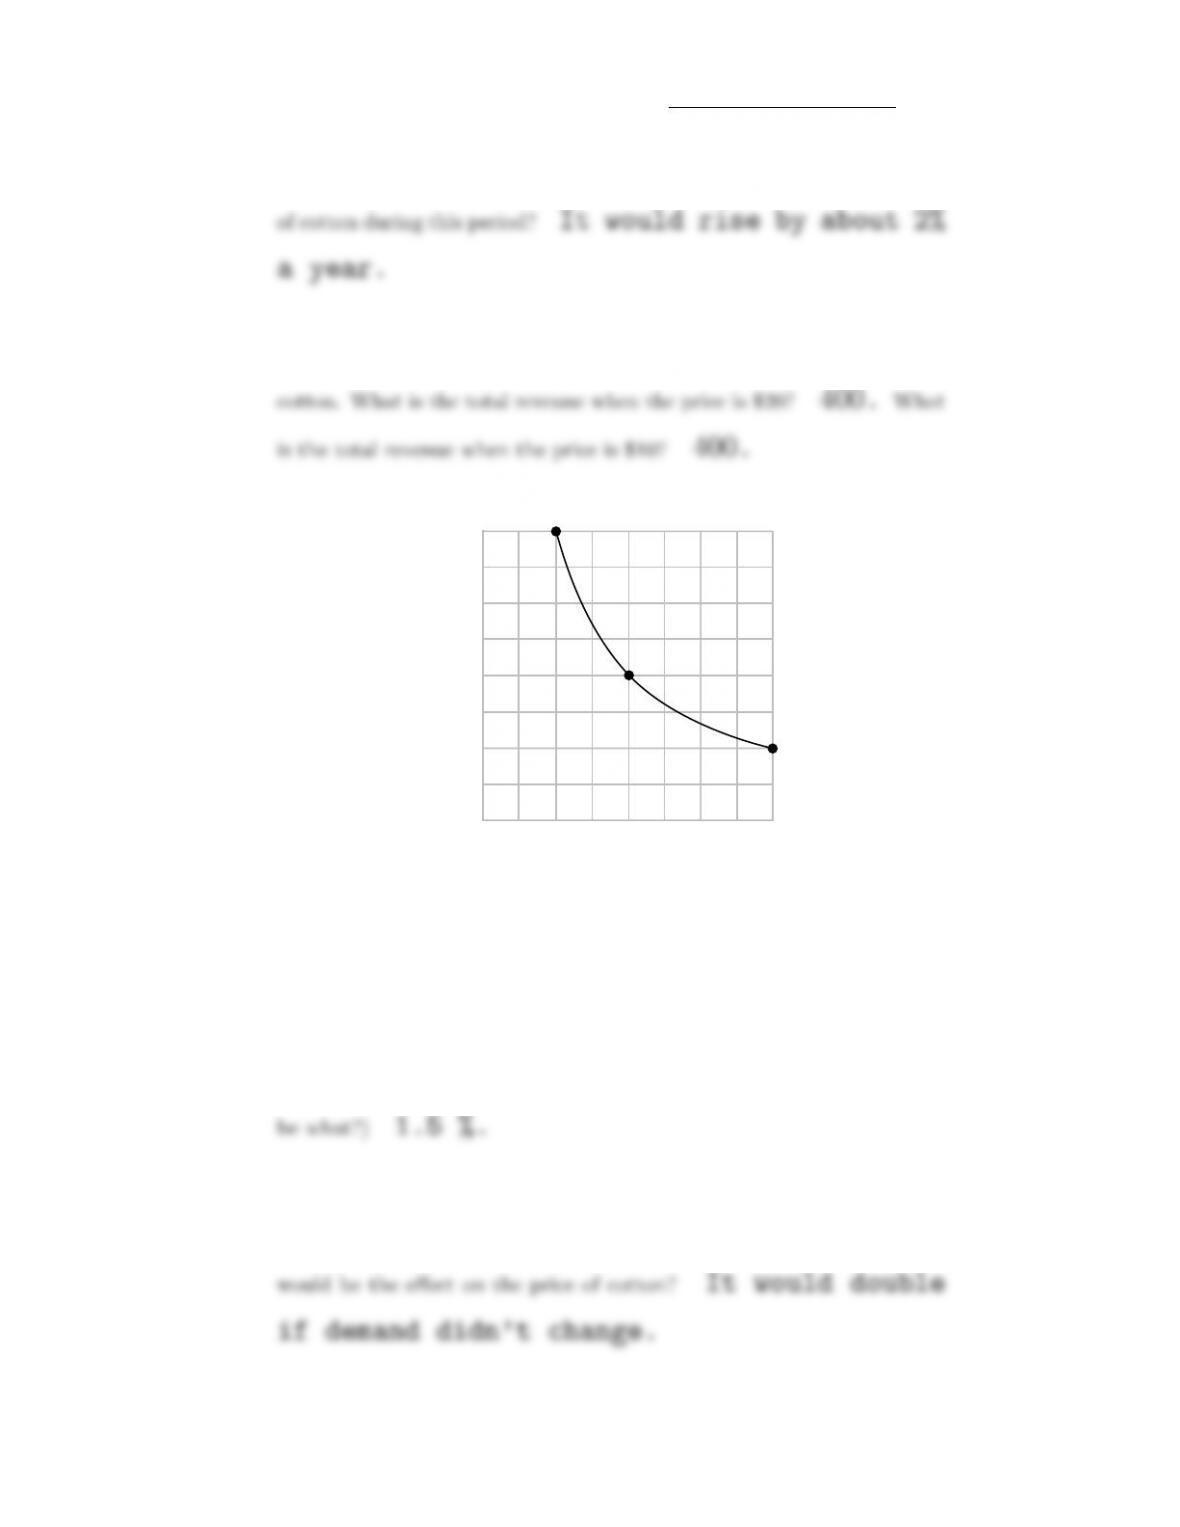
(a) If during this period, cotton production in the United States grew by
3% per year, what (approximately) must be the rate of change of the price
(b) Assuming a constant price elasticity of −1, and assuming that when
the price is $20, the quantity is also 20, graph the demand curve for
0102030
40
10
20
30
40
Price of cotton
Quantity of cotton
(c) If the change in the quantity of cotton supplied by the United States is
to be interpreted as a movement along an upward-sloping long-run supply
curve, what would the elasticity of supply have to be? (Hint: From 1820
to 1860 quantity rose by about 3% per year and price rose by 2%
per year. [See your earlier answer.] If the quantity change is a movement
along the long-run supply curve, then the long-run price elasticity must
(d) The American Civil War, beginning in 1861, had a devastating effect
on cotton production in the South. Production fell by about 50% and
remained at that level throughout the war. What would you predict