Chapter 7: Funds Analysis, Cash-Flow Analysis, and Financial Planning
72
© Pearson Education Limited 2008
6.
Central City Department Store
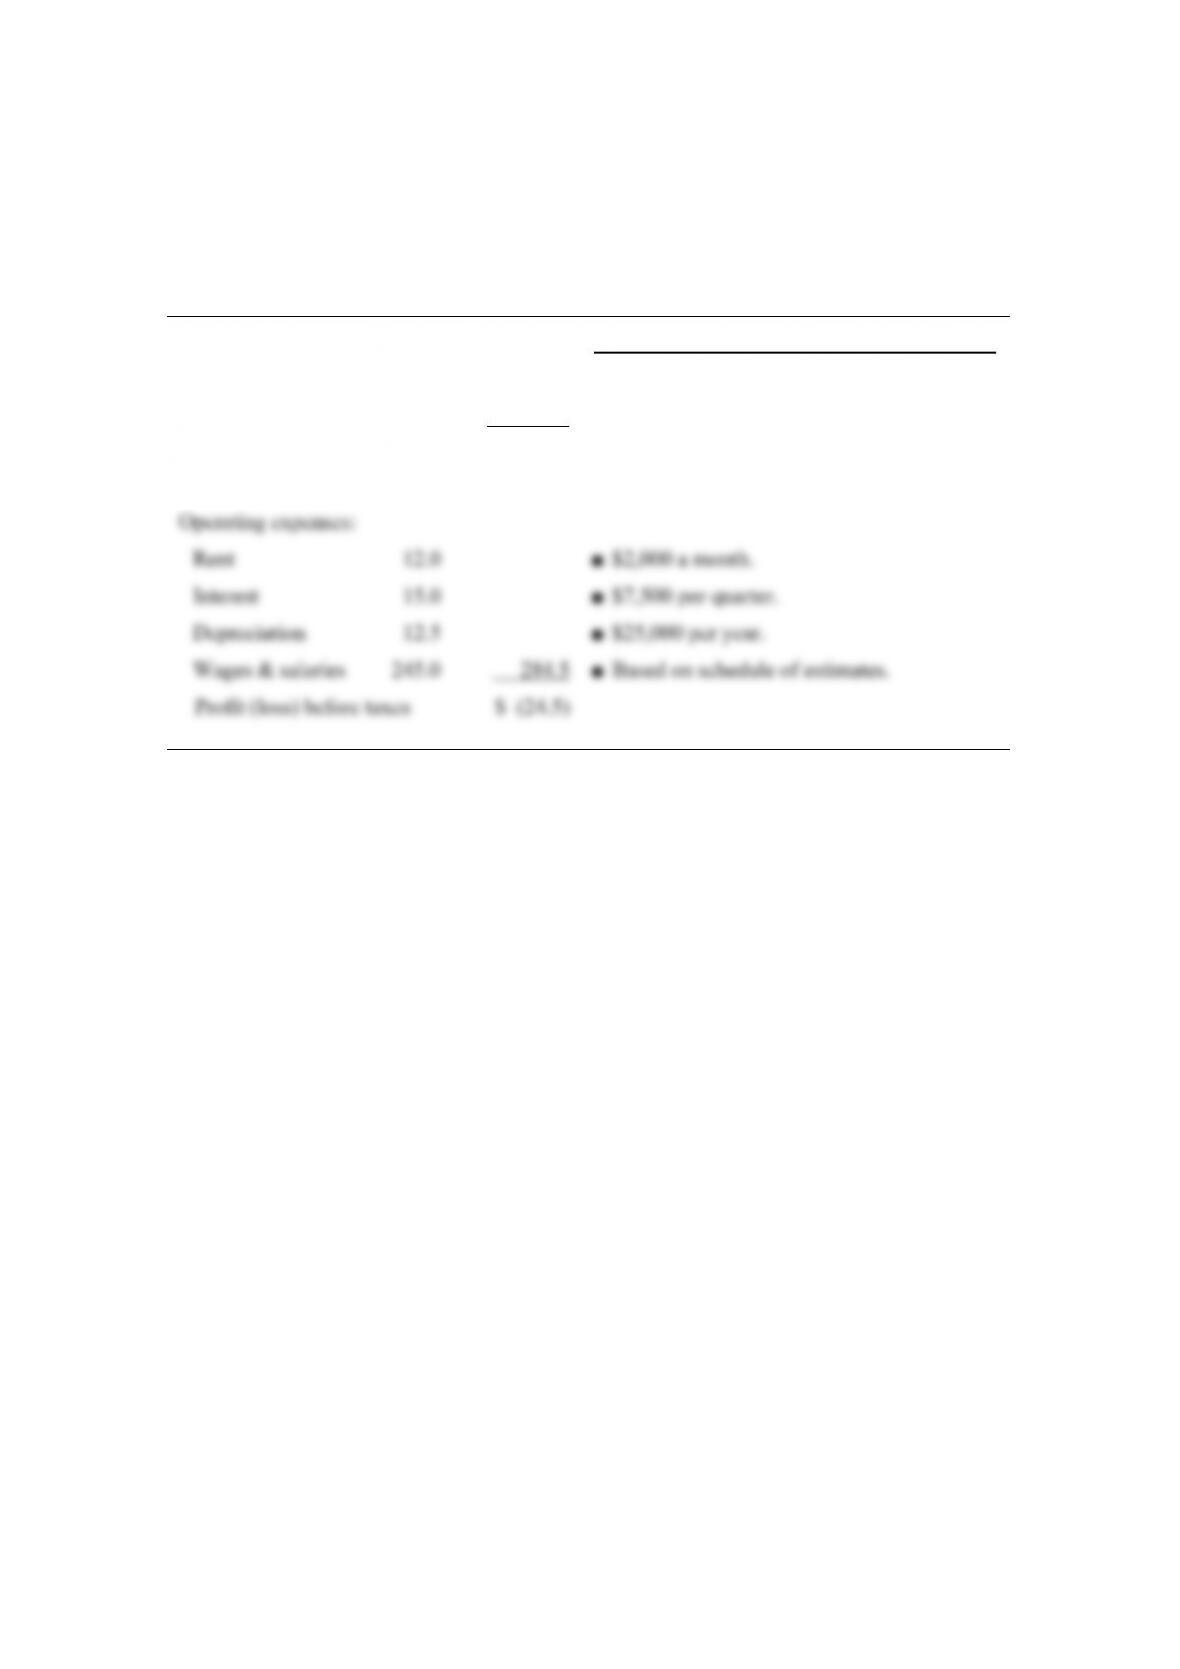
Forecast income statement for six months ending June 30, 20X2
(in thousands)
Assumptions and/or sources of information
Net sales $1,300.0 ■ Based on schedule of estimates.
Cost of goods sold 1,040.0 ■ Forecast at 80% of net sales —
see part (e) of Q. #5.
Gross profit 260.0
Van Horne and Wachowicz, Fundamentals of Financial Management, 13th edition, Instructor’s Manual
73
© Pearson Education Limited 2008
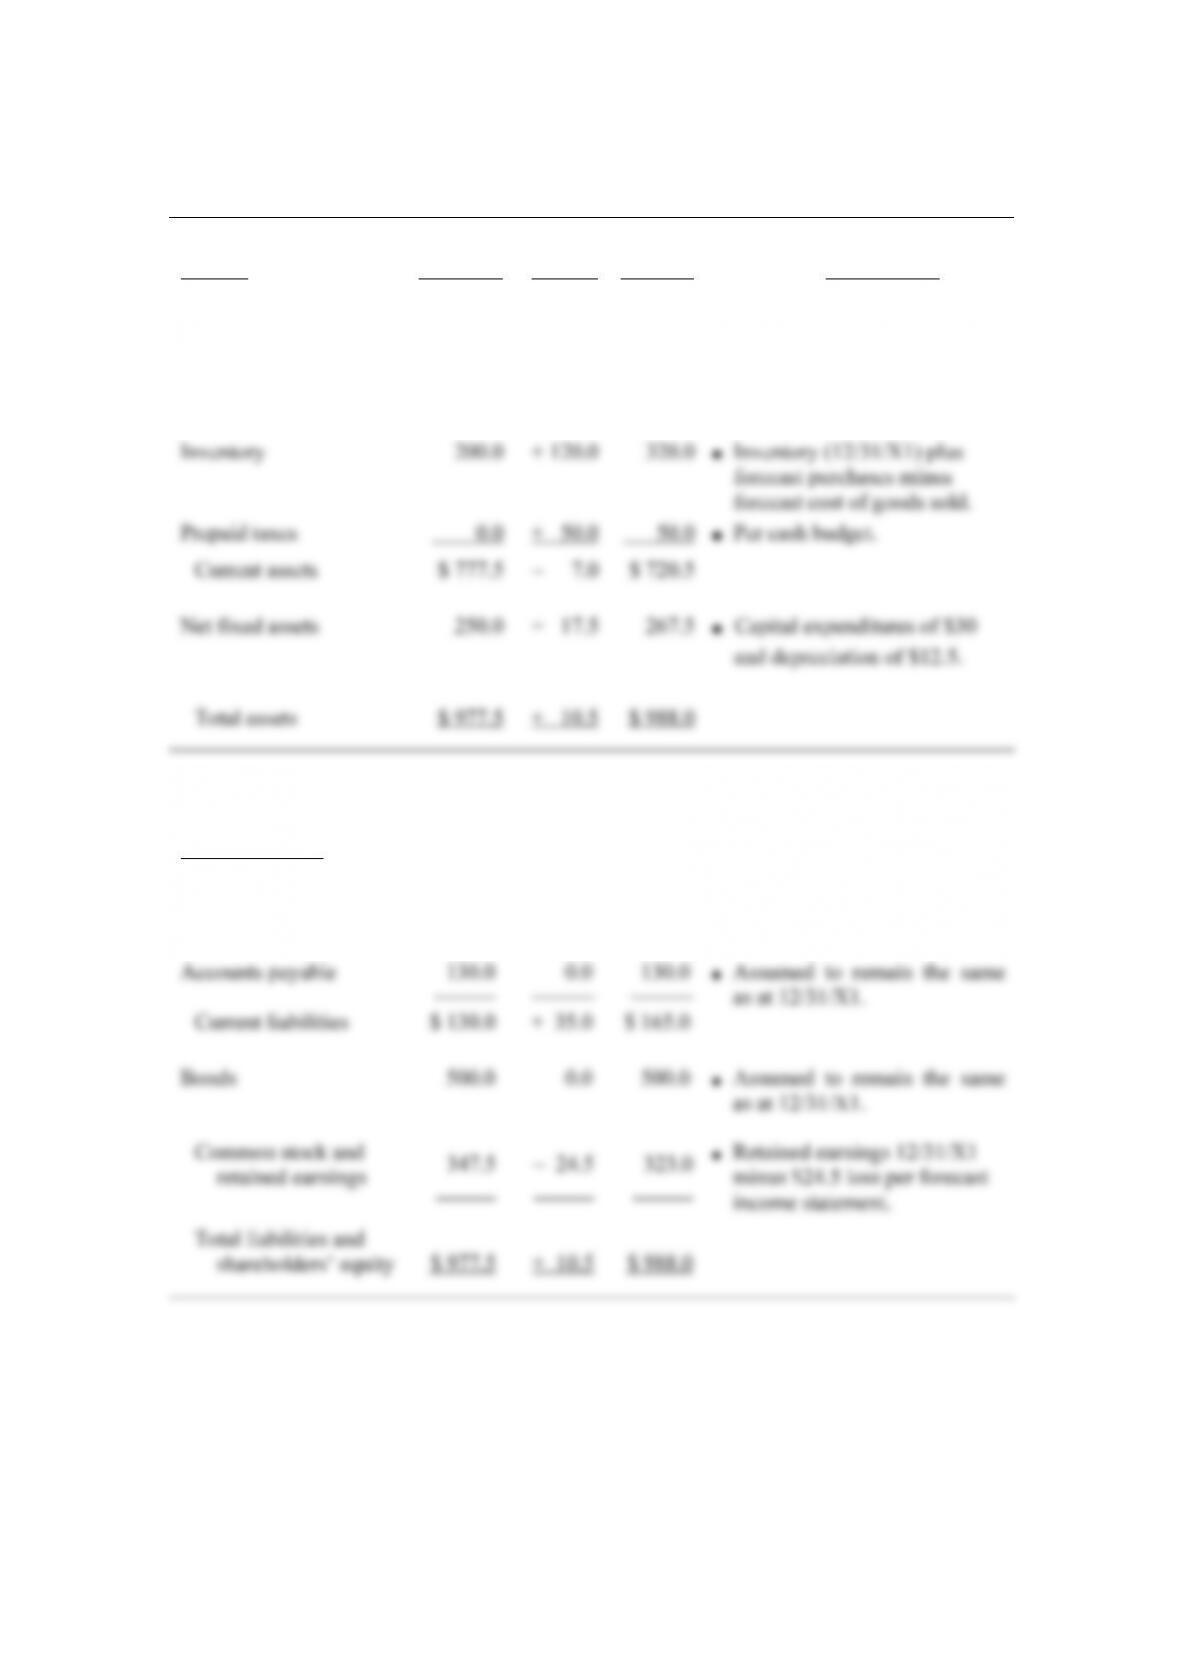
7. Central City Department Store Forecast balance sheet at June 30, 20X2 (in thousands)
Actual Forecast
Assets 12-31-X1 Change 6-30-X2 Assumptions
Cash $ 100.0 + 3.0 $ 103.0 ■ Based on cash budget.
Receivables 427.5 – 180.0 247.5 ■ 100% June credit sales plus
40% May credit sales, 10%
April credit sales.
—————————————————————-
Liabilities
Bank borrowings $ 0.0 + 35.0 $ 35.0 ■ Previous balance plus
additional financing needed.
Chapter 7: Funds Analysis, Cash-Flow Analysis, and Financial Planning
74
© Pearson Education Limited 2008
Solutions to Appendix Problems:
1 (0.06) (1.45) (2.381) 150
−
−
Moving to lower relative profitability and lower debt ratio, which may be a one-shot
occurrence, lowers dramatically the sustainable growth rate. The change in debt ratio
affects the level of overall assets, not just the growth component.
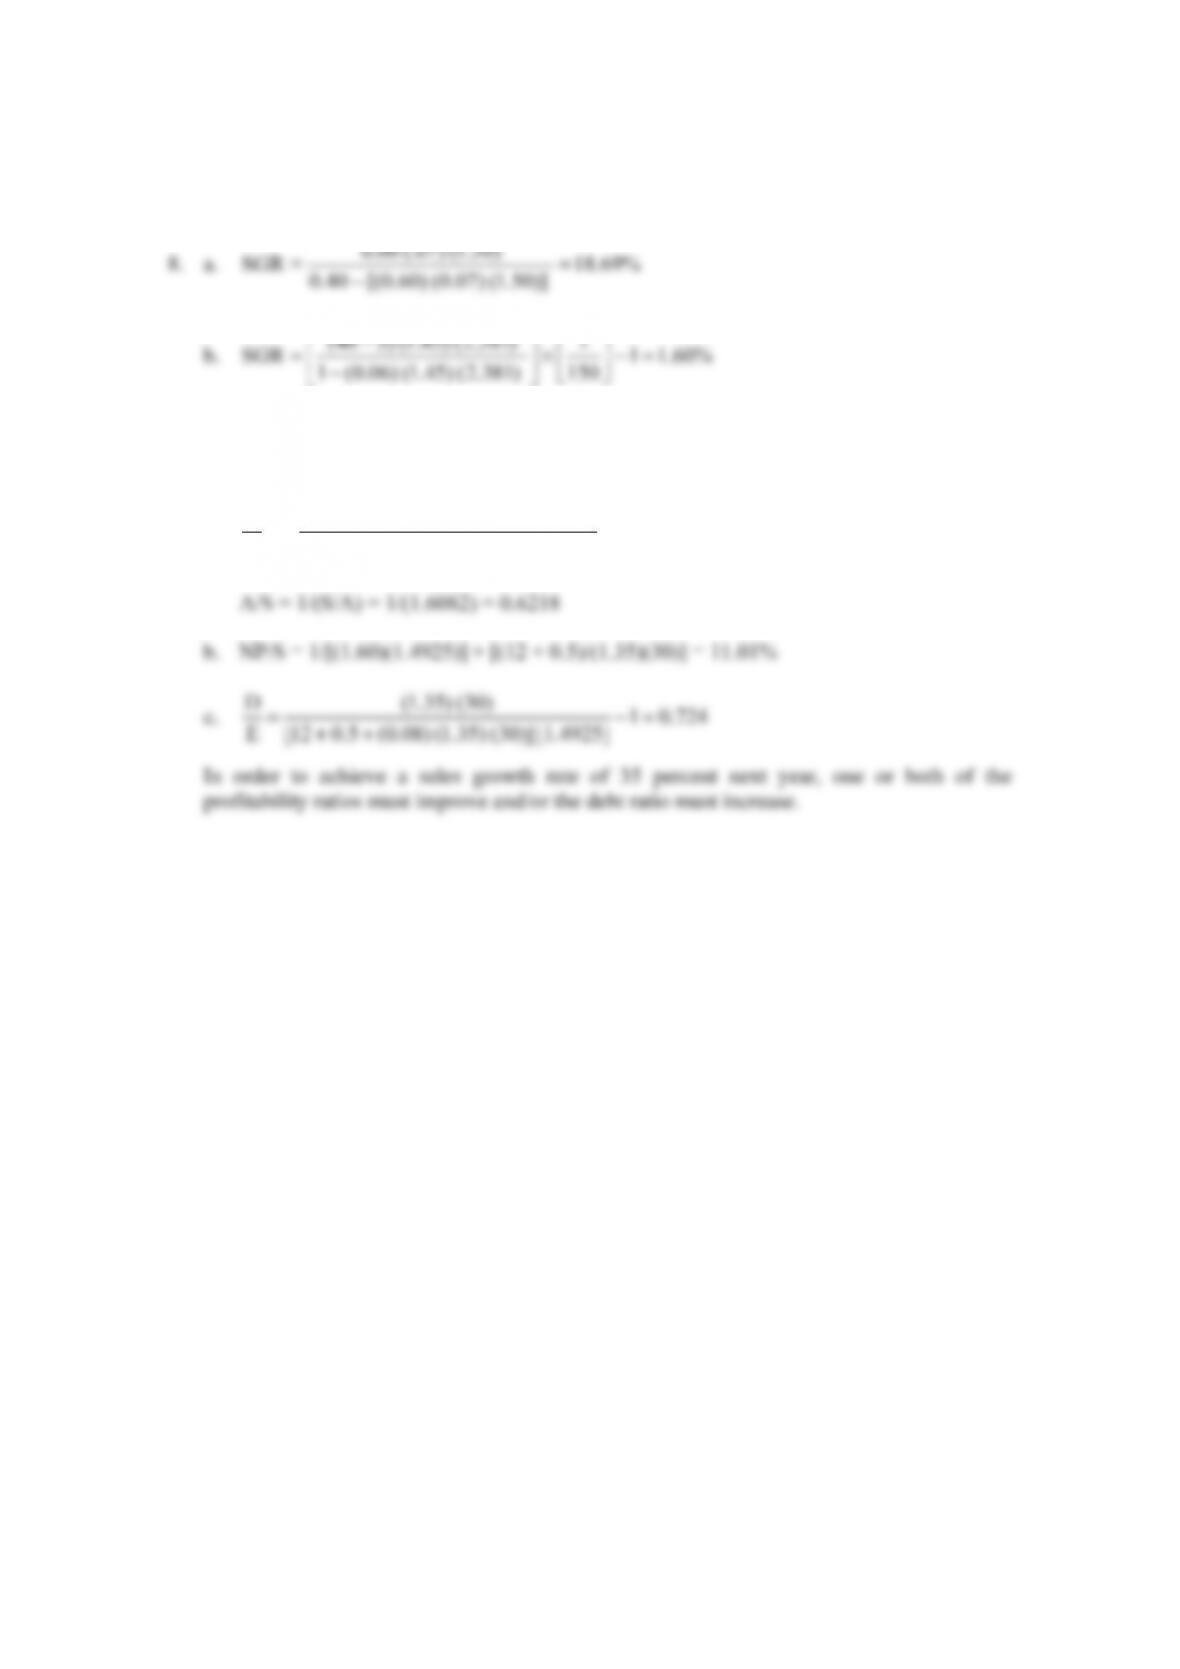
9. a. S (1.35)(30) 1.6082
A [1.60][12 0.5 (0.08) (1.35)(30)]
==
++
Van Horne and Wachowicz, Fundamentals of Financial Management, 13th edition, Instructor’s Manual
75
© Pearson Education Limited 2008
SOLUTIONS TO SELF-CORRECTION PROBLEMS
1. a.
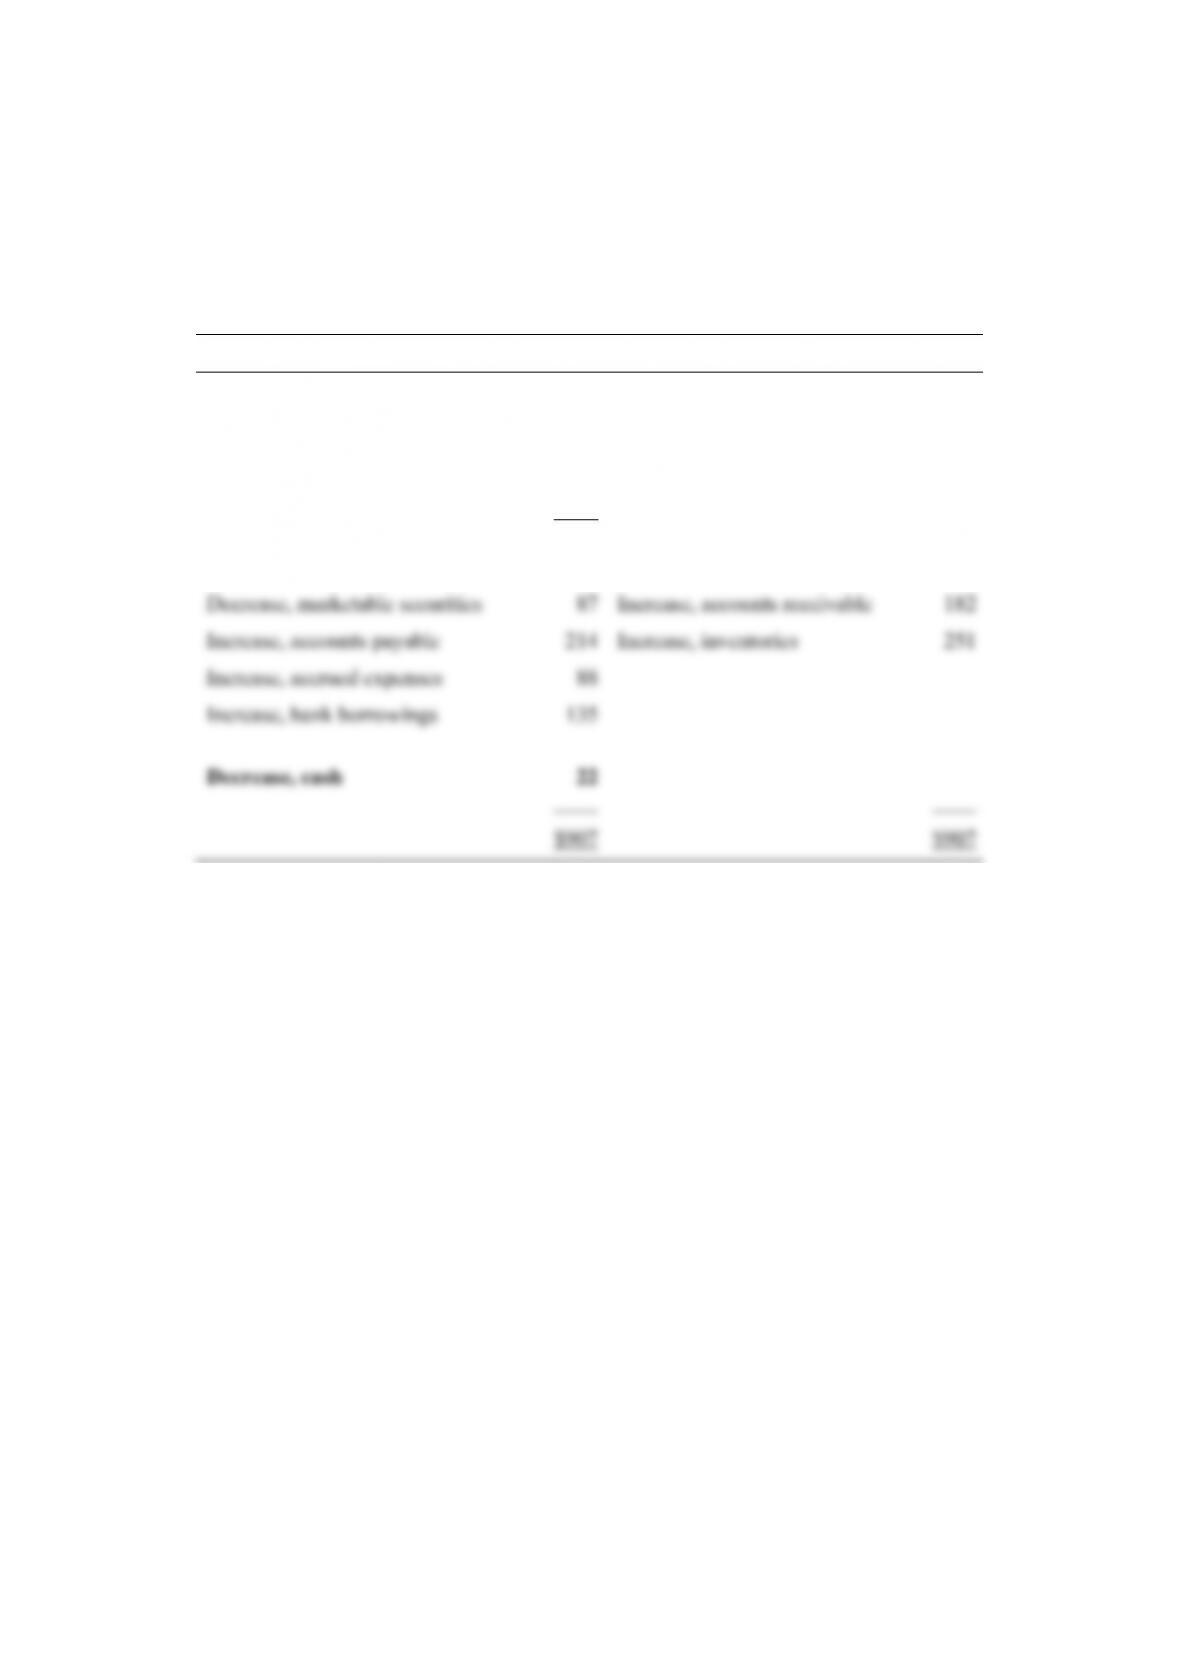
Sources and uses of funds statement for Dana-Stallings, Inc. (in thousands)
Sources Uses
Funds provided by operations:
Net profit $172
Depreciation 189 Additions to fixed assets $474
$361
The company has had substantial capital expenditures and increases in current assets. This
growth has far outstripped the growth in retained earnings. To finance this growth, the
company has reduced its marketable securities to zero, has leaned heavily on trade credit
(accounts payable), and has increased its accrued expenses and bank borrowings. All of this
is short-term financing of mostly long-term buildups in assets.
Chapter 7: Funds Analysis, Cash-Flow Analysis, and Financial Planning
76
© Pearson Education Limited 2008
b.
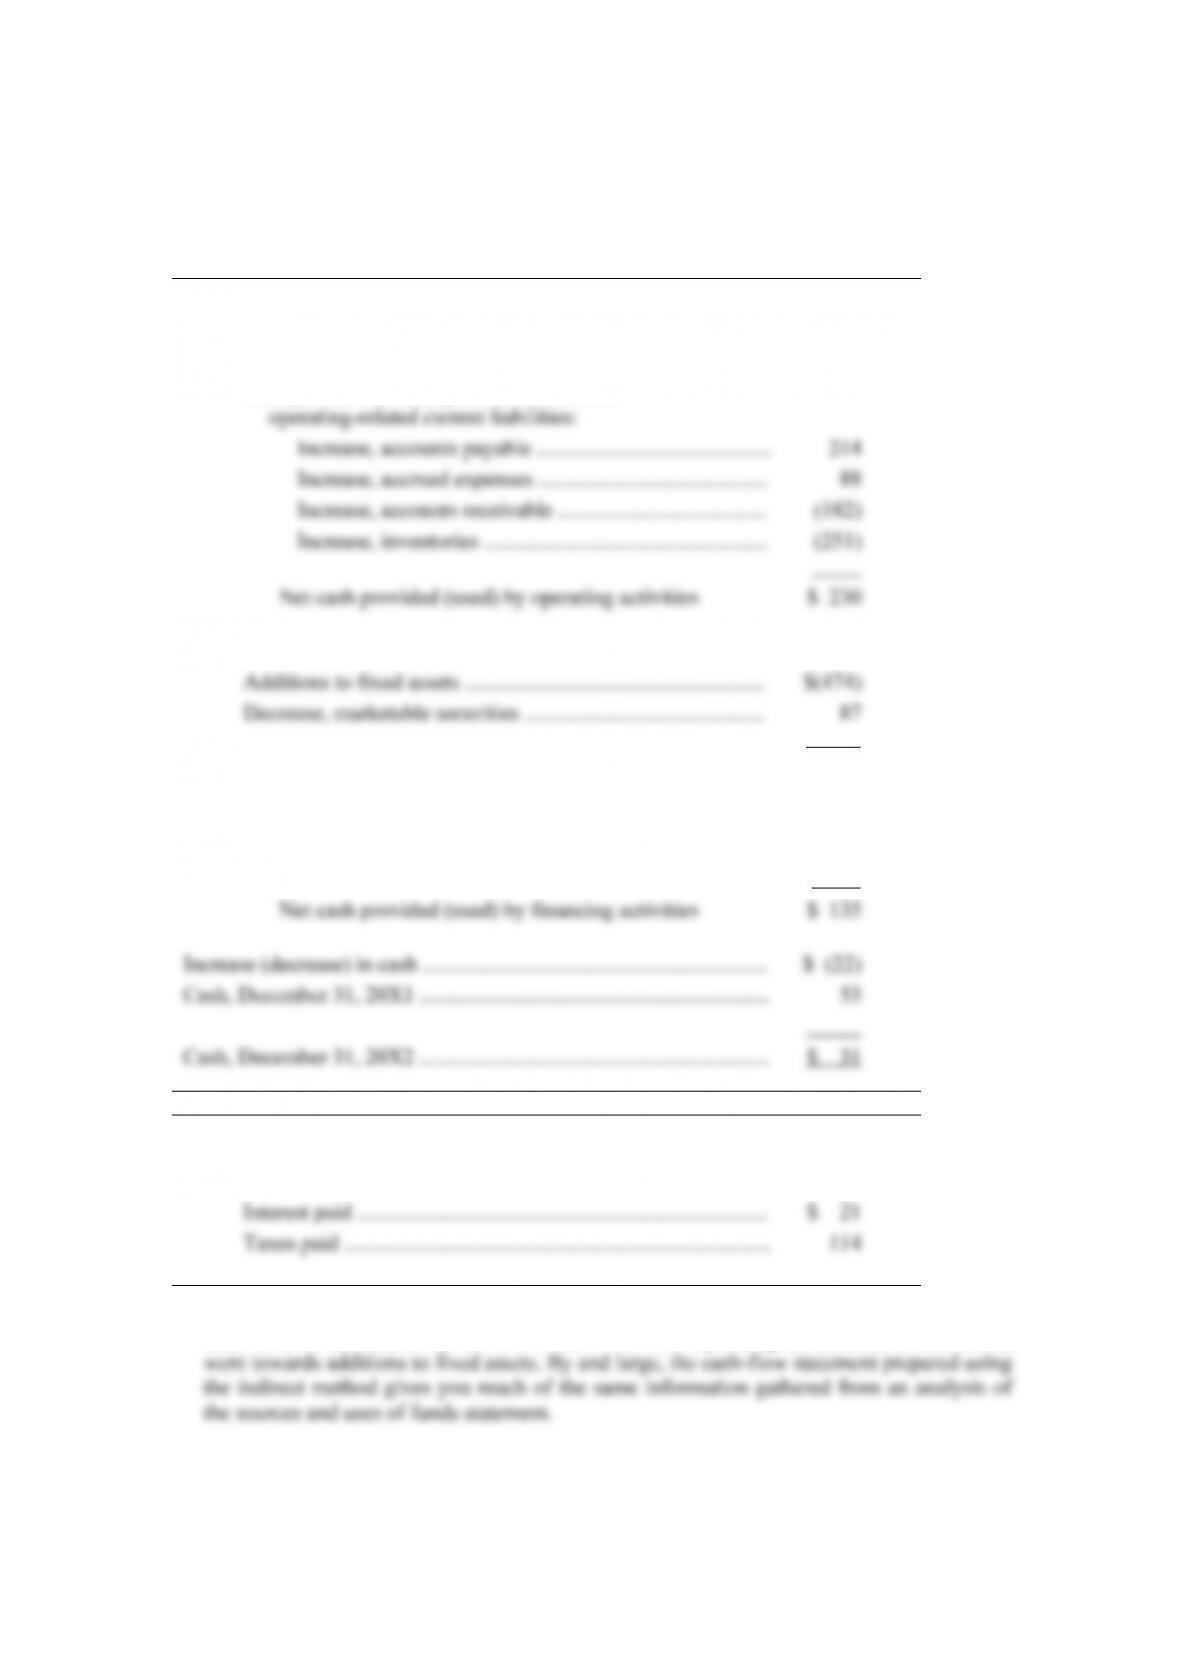
Statement of cash flows for Dana-Stallings, Inc. (in thousands)
CASH FLOW FROM OPERATING ACTIVITIES:
Net income ………………………………………………………………….. $ 172
Depreciation ……………………………………………………………….. 189
Cash provided (used) by current assets and
CASH FLOW FROM INVESTING ACTIVITIES:
Net cash provided (used) by investing activities $(387)
CASH FLOW FROM FINANCING ACTIVITIES:
Increase in short-term bank borrowings …………………………. $ 135
Supplemental cash flow disclosures:
In addition to the same points raised by an analysis of the sources and uses of funds
statement, we see that all of the firm’s cash flow from operating activities (and then some)
Van Horne and Wachowicz, Fundamentals of Financial Management, 13th edition, Instructor’s Manual
77
© Pearson Education Limited 2008
2. a.
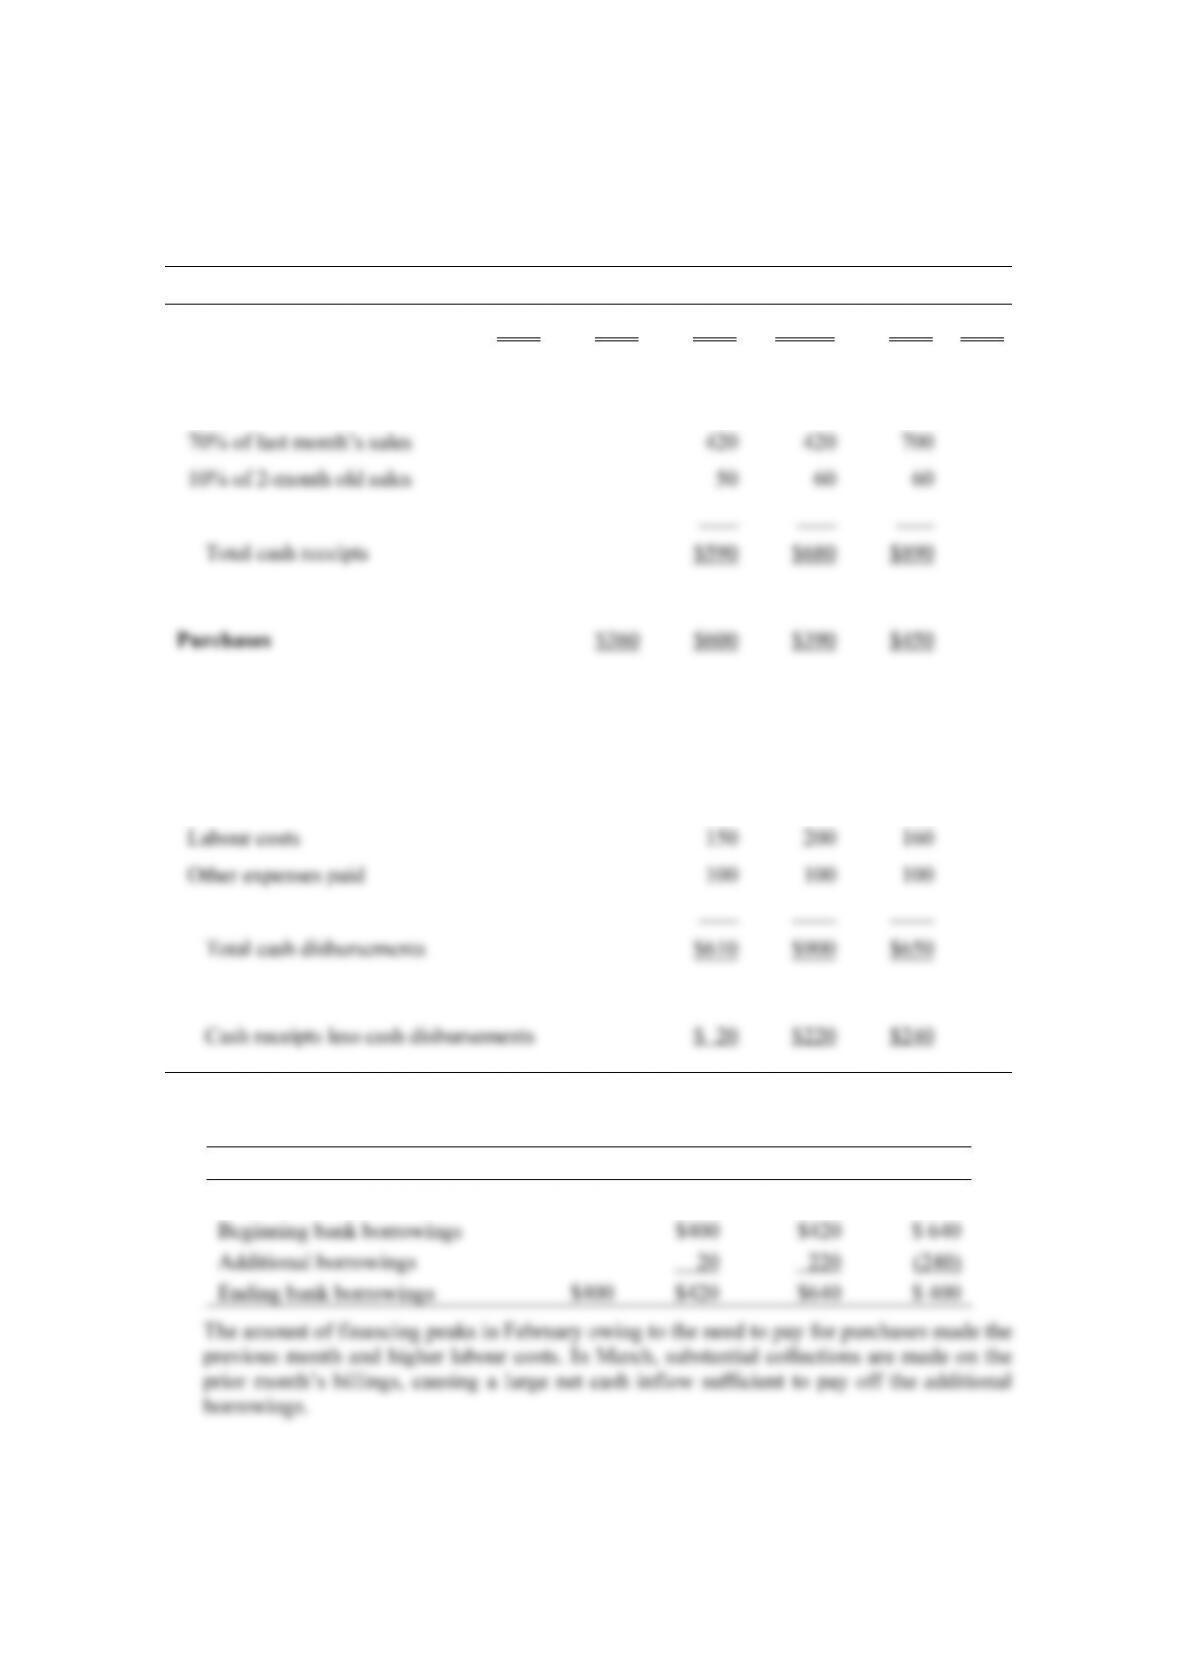
Cash budget (in thousands)
Nov Dec Jan Feb Mar Apr
Sales $500 $600 $600 $1,000 $650 $750
Cash Collections
20% of current month sales $120 $200 $130
Cash disbursements for purchases and
operating expenses
100% of last month’s purchases $360 $600 $390
b.
Dec Jan Feb Mar
Chapter 7: Funds Analysis, Cash-Flow Analysis, and Financial Planning
78
© Pearson Education Limited 2008
c.
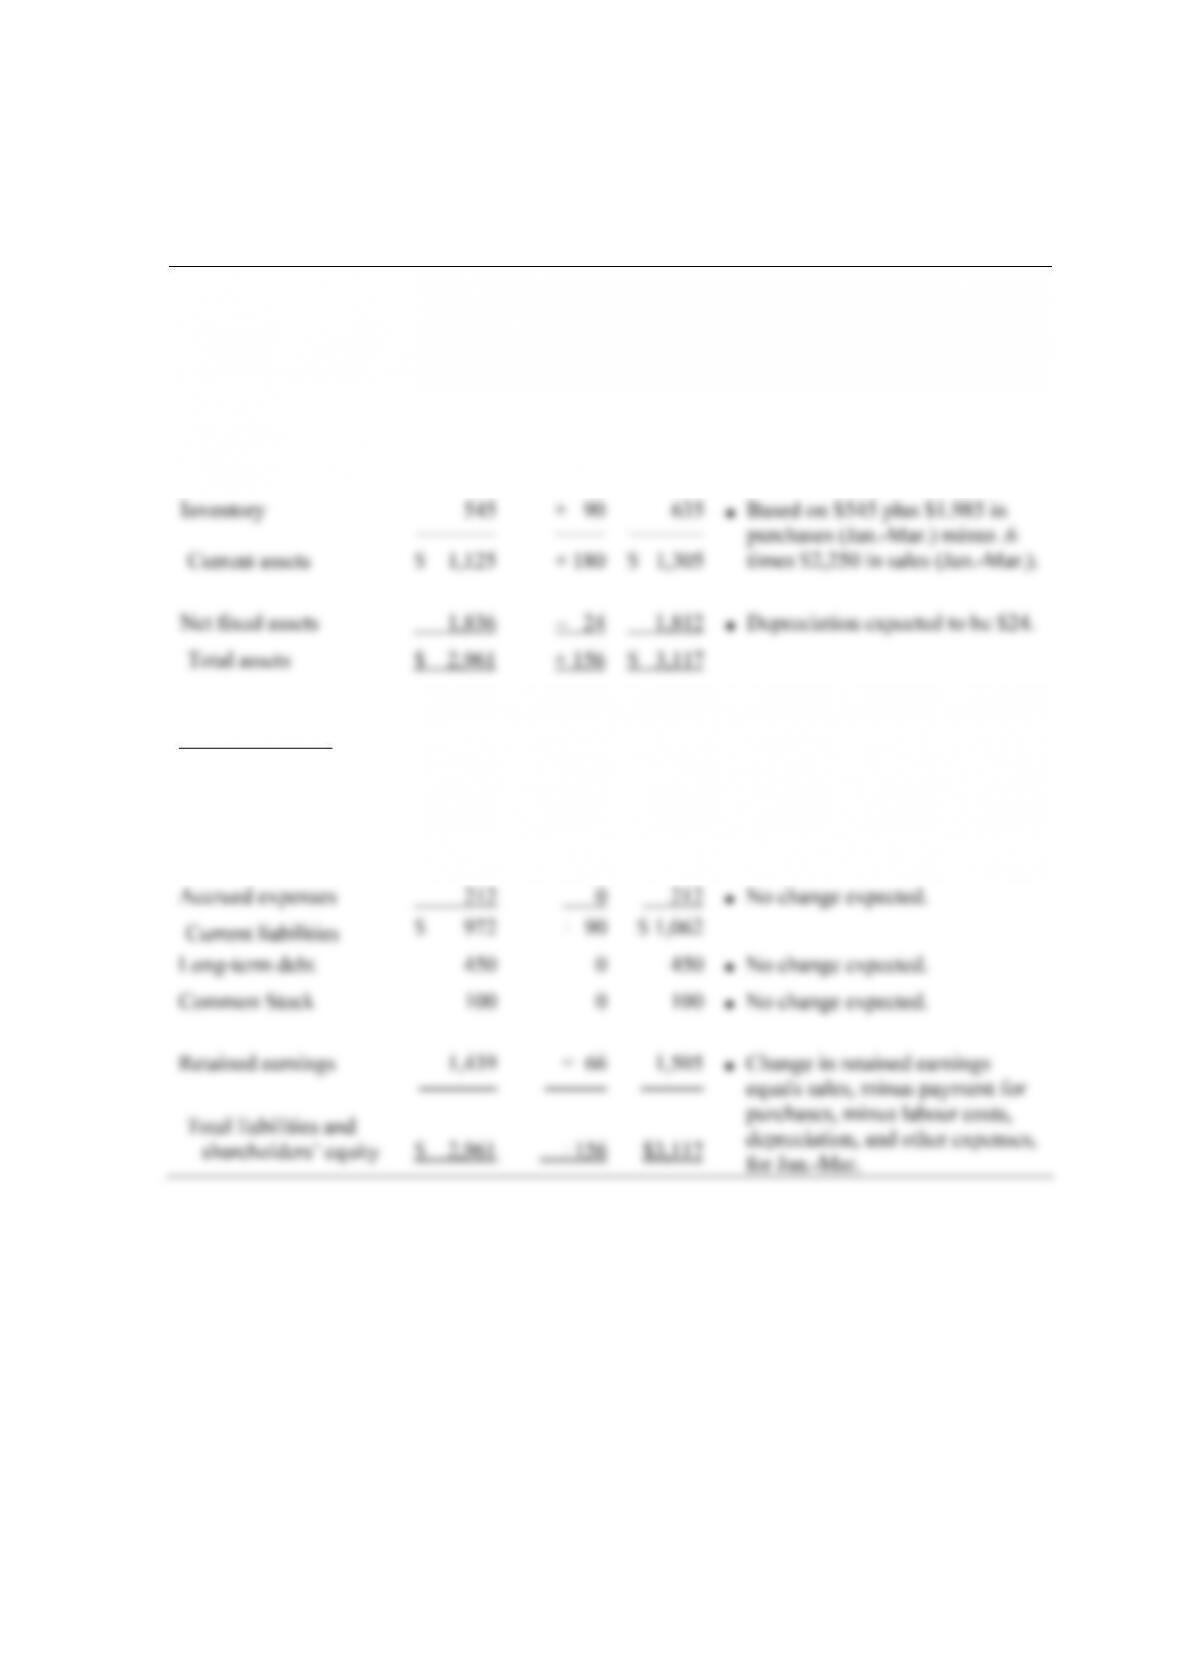
Forecast balance sheet at March 31 (in thousands)
Actual Forecast
Assets 12-31 Change 3-31 Assumptions
──────────── ───── ───── ───── ─────────────────
Cash $ 50 0 $ 50 ■ Set at estimated minimum
balance.
Receivables 530 + 90 620 ■ 80% March sales plus 10%
February sales.
——————————————————————————————————————-
Liabilities
Bank borrowings $ 400 0 $ 400 ■ Previous balance plus zero
additional financing needed.
Accounts payable 360 + 90 450 ■ 100% March purchases.
Van Horne and Wachowicz, Fundamentals of Financial Management, 13th edition, Instructor’s Manual
79
© Pearson Education Limited 2008
3.
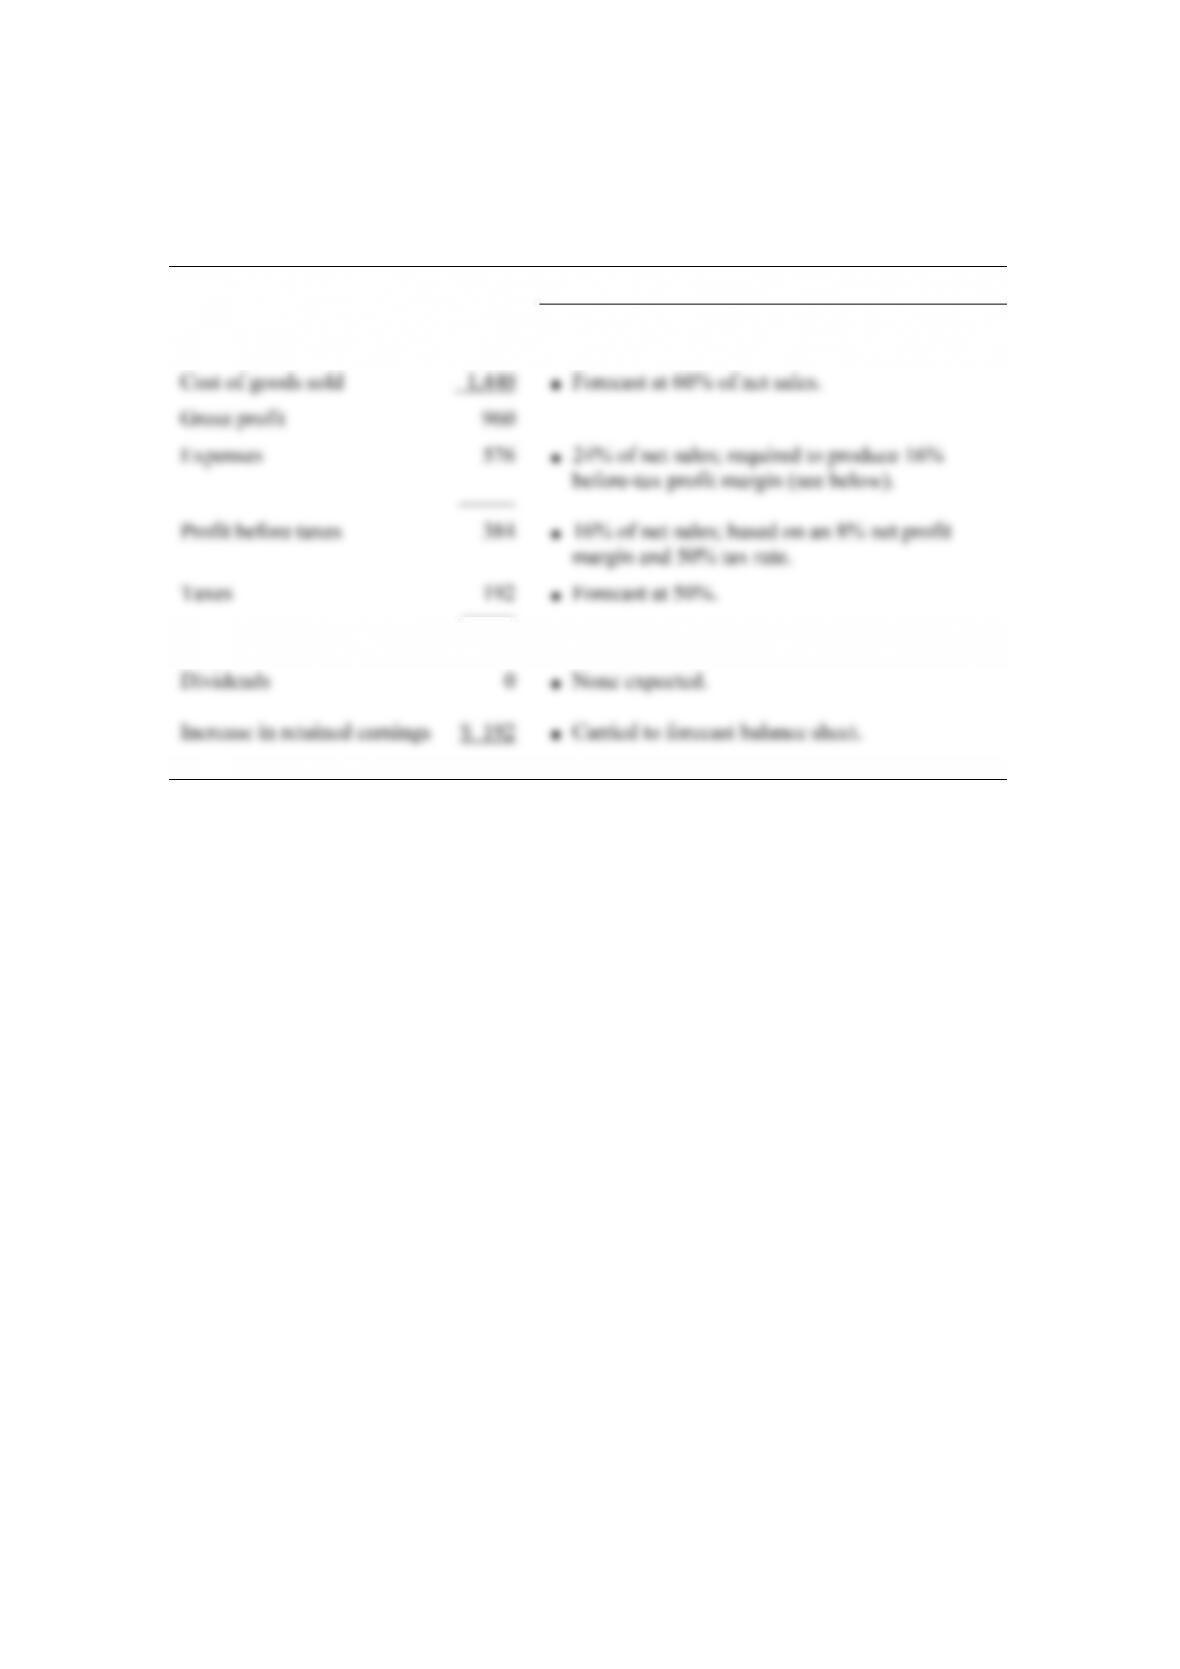
Forecast income statement (in thousands)
Assumptions
Net sales $2,400 ■ Based on sales forecast.
Profit after taxes $ 192 ■ Forecast at 8% of net sales.
Chapter 7: Funds Analysis, Cash-Flow Analysis, and Financial Planning
80
© Pearson Education Limited 2008
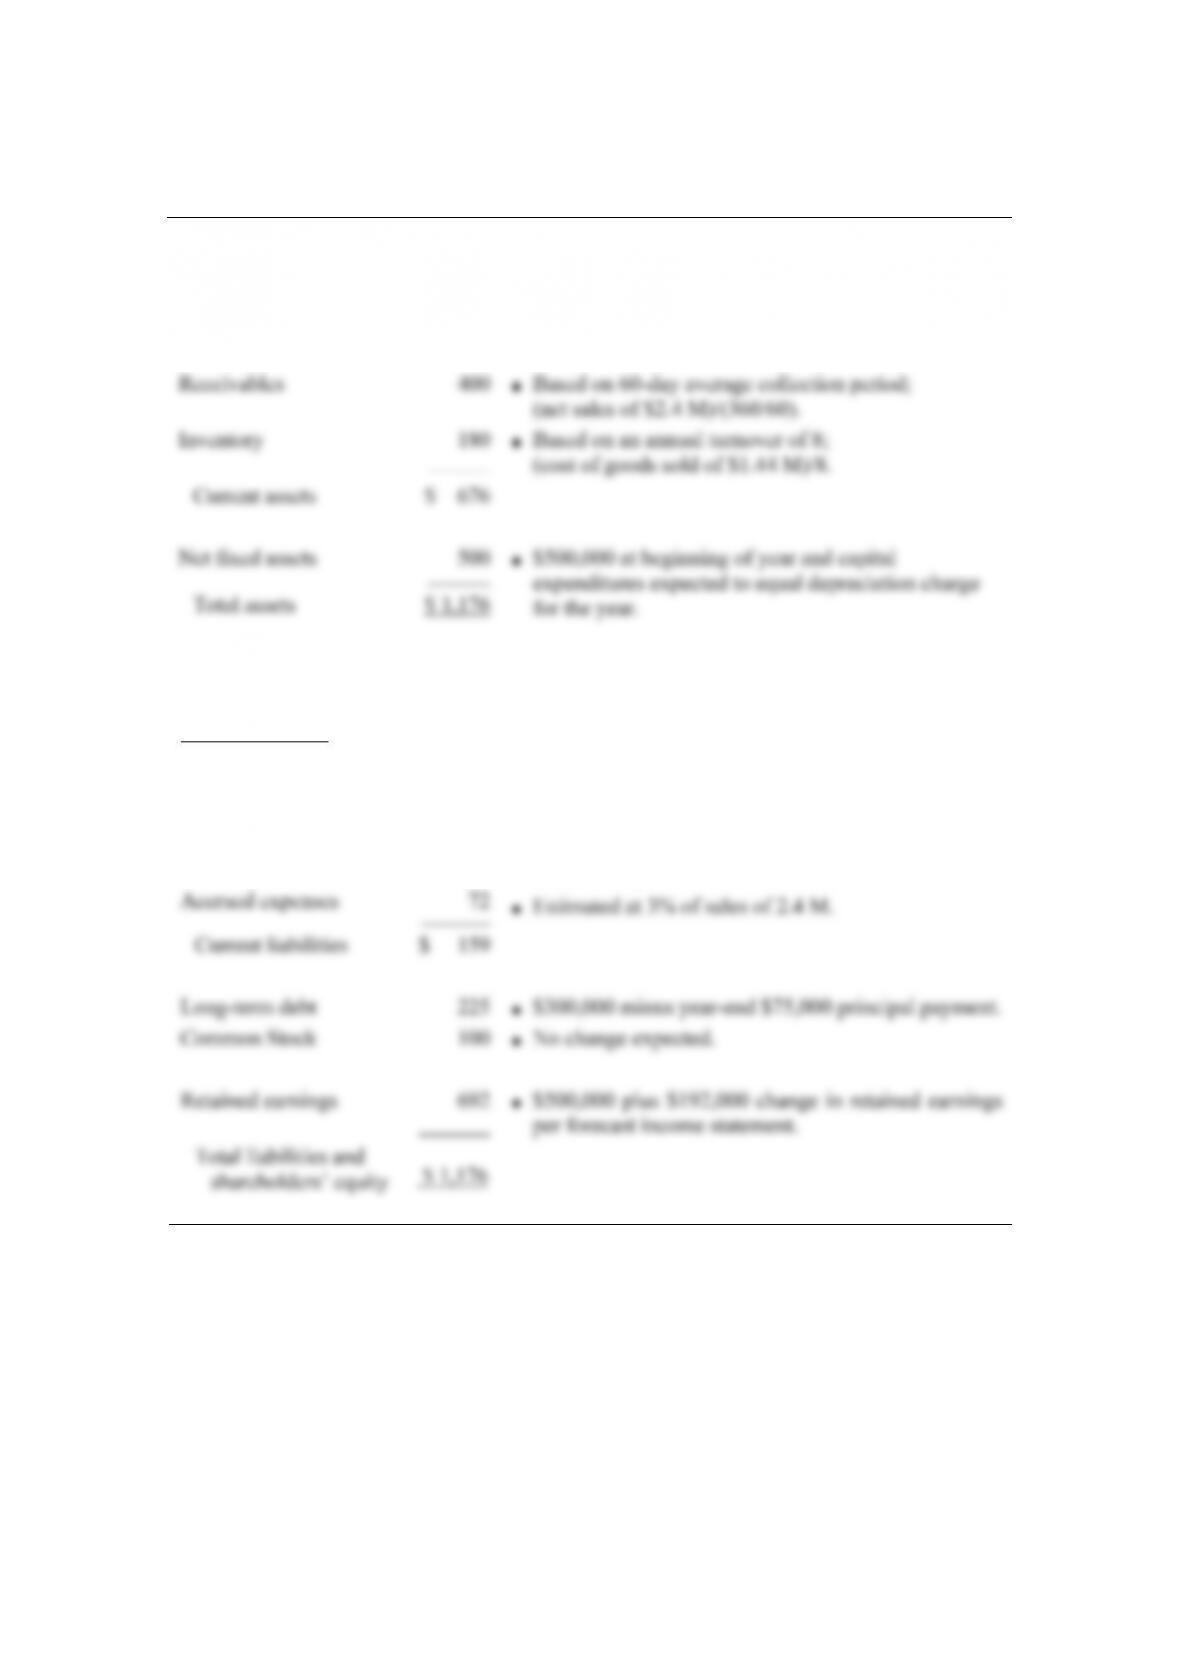
Forecast balance sheet (in thousands)
End of
Assets year Assumptions
──────────── ──── ───────────────────────────────
Cash $ 96 ■ Set at estimated minimum balance; 4% of annual
sales of $2.4 M.
—————————————————————-
Liabilities
Bank borrowings $ 27 ■ Plug figure equal to total assets minus all the
individual items listed below.
Accounts payable 60 ■ 1 month’s purchases;
(.5)(cost of goods sold of $1.44 M)/12.
shareholders’ equity

Van Horne and Wachowicz, Fundamentals of Financial Management, 13th edition, Instructor’s Manual
81
© Pearson Education Limited 2008
SOLUTIONS TO APPENDIX SELF-CORRECTION PROBLEMS
4. a. 0.75(0.04)(1.6667)
SGR = 0.6667 [0.75(0.04)(1.6667)] =
−8.11%
1 [(0.05)(1.8 0)(1.6129)] 30
−
The company has moved from steady state with higher target operating efficiency, a