
61
© Pearson Education Limited 2008
Funds Analysis, Cash-Flow Analysis, and
Financial Planning
Forecasting is very difficult, especially if it is about the
future.
ANONYMOUS
Chapter 7: Funds Analysis, Cash-Flow Analysis, and Financial Planning
62
© Pearson Education Limited 2008
ANSWERS TO QUESTIONS
1. Flow of funds (sources and uses) statements provide the analyst with information generally
being about year-to-year changes in assets and how these changes are financed. It is
2. A
statement of cash flows reports a firm’s cash inflows and outflows during a period of time
segregated into three categories: operating, investing, and financing activities. When used
3. The variable that most directly affects the cash budget is sales since the cash inflow is
4. Cash budgeting can lower the cost of borrowing for two reasons. By knowing ahead of time
7. The purpose of accounting statements is to provide information to creditors and investors so
that they may make a correct assessment of the risk and return characteristics of the firm.
The statement of cash flows may provide insights not apparent in studying either the income
8. Some managers prefer the flow of funds statement over the more complex cash-flow
9. Whether or not depreciation is a source of funds has been debated for many years by
accountants and financial analysts. Accountants argue that depreciation is an accounting
Van Horne and Wachowicz, Fundamentals of Financial Management, 13th edition, Instructor’s Manual
63
© Pearson Education Limited 2008
11. a. Source/Investing
b. Use/Financing
12. The cash budget deals with inflows and outflows of cash and not necessarily accounting
13. The financial manager should concentrate on accurate projections of sales as well as the
14. Probably the cash budget is a better measure of liquidity. The current ratio and quick ratio
15. Virtually everything in the cash budget depends on sales: receivables, production costs,
16. Forecast statements are projections of expected future income statements and balance
While both the cash budget and the forecast income statement are forecasts of the future, the
17. The two principal ways by which to prepare forecast statements are through a cash budget
Answers to Appendix Questions:
18. A sustainable growth rate (SGR) is the maximum percentage growth in sales that can occur
consistent with target operating, debt, and dividend ratios. With sustainable growth
Chapter 7: Funds Analysis, Cash-Flow Analysis, and Financial Planning
64
© Pearson Education Limited 2008
19. Steady-state modeling assumes that balance sheet and performance ratios do not change
20. The input variables are beginning sales and beginning equity. Target variables are the ratio
SOLUTIONS TO PROBLEMS
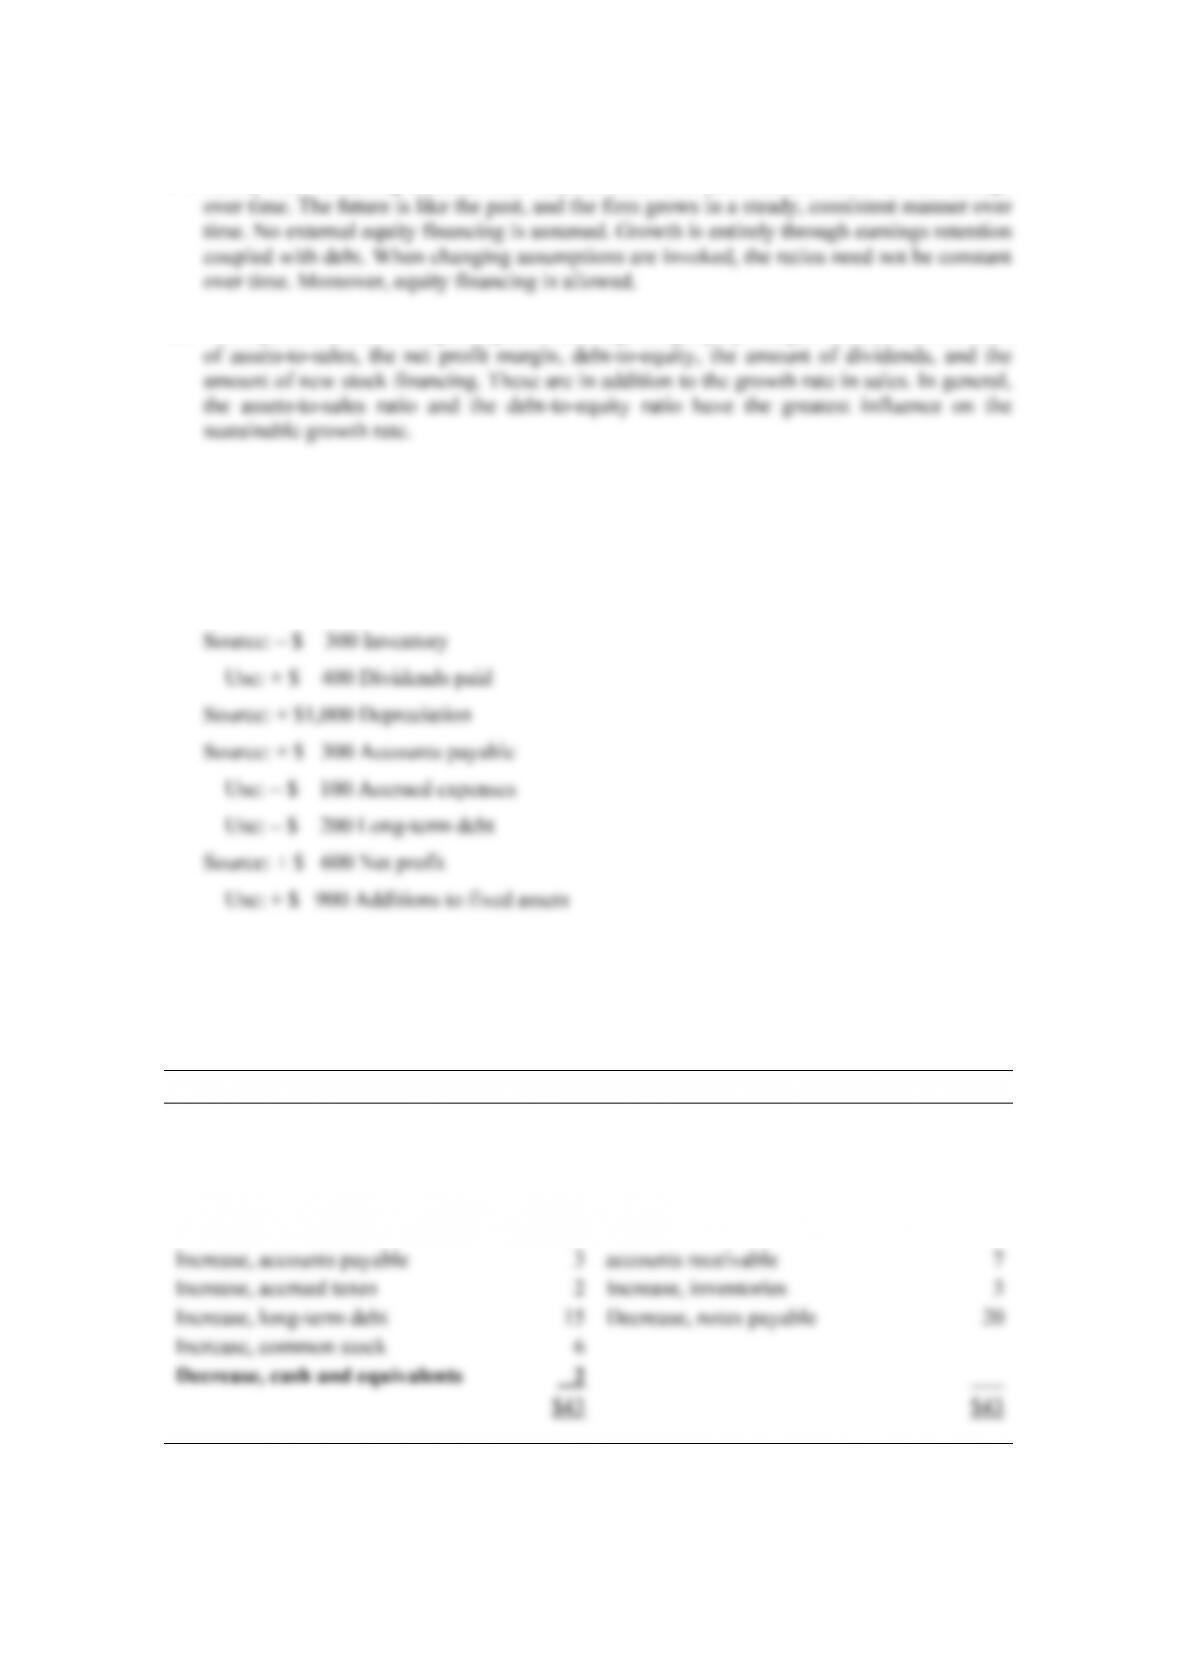
1. Source: – $ 100 Cash
Use: + $ 700 Accounts receivable
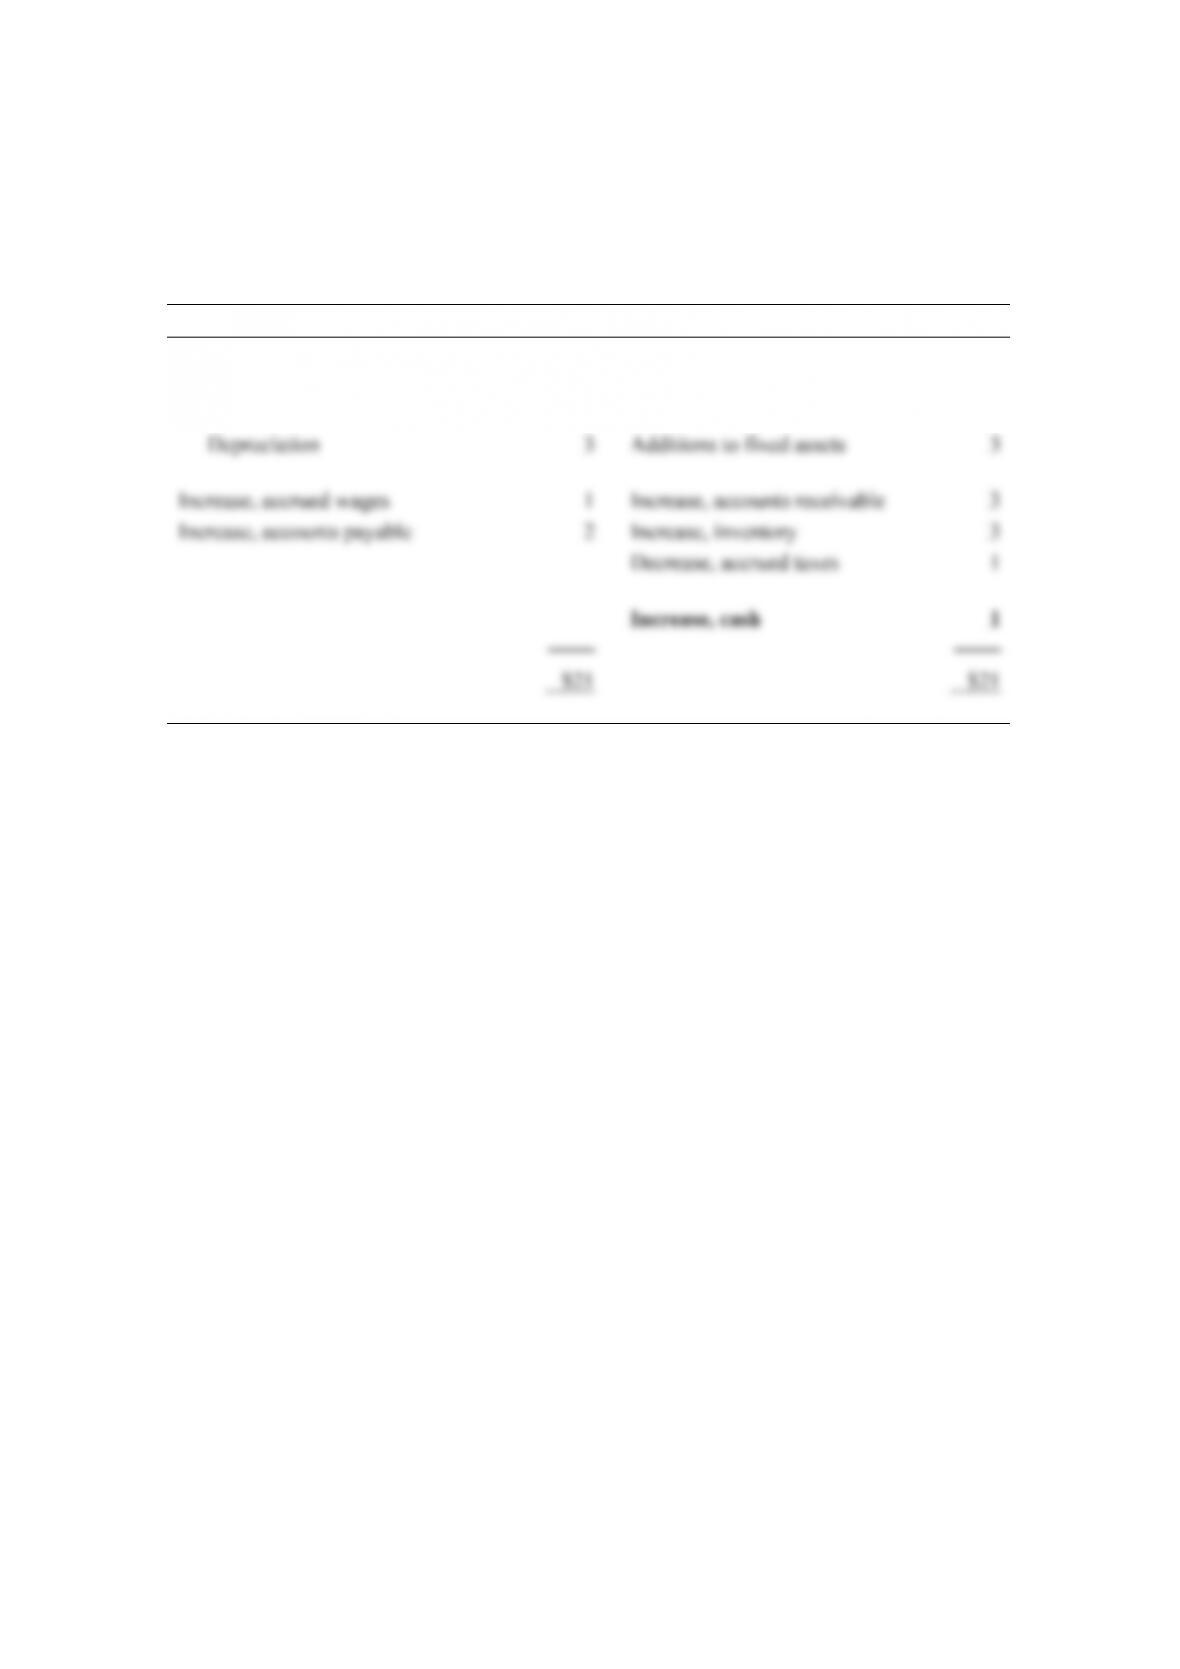
2. a.
Svoboda Corporation
Sources and uses of funds statement
for December 31, 20X1 to December 31, 20X2 (in millions)
Sources Uses
Funds provided by operations:
Net profit $ 7 Dividends $ 3
Depreciation 5 Additions to fixed assets 10
Decrease, other assets 3 Increase,
Van Horne and Wachowicz, Fundamentals of Financial Management, 13th edition, Instructor’s Manual
65
© Pearson Education Limited 2008
b.
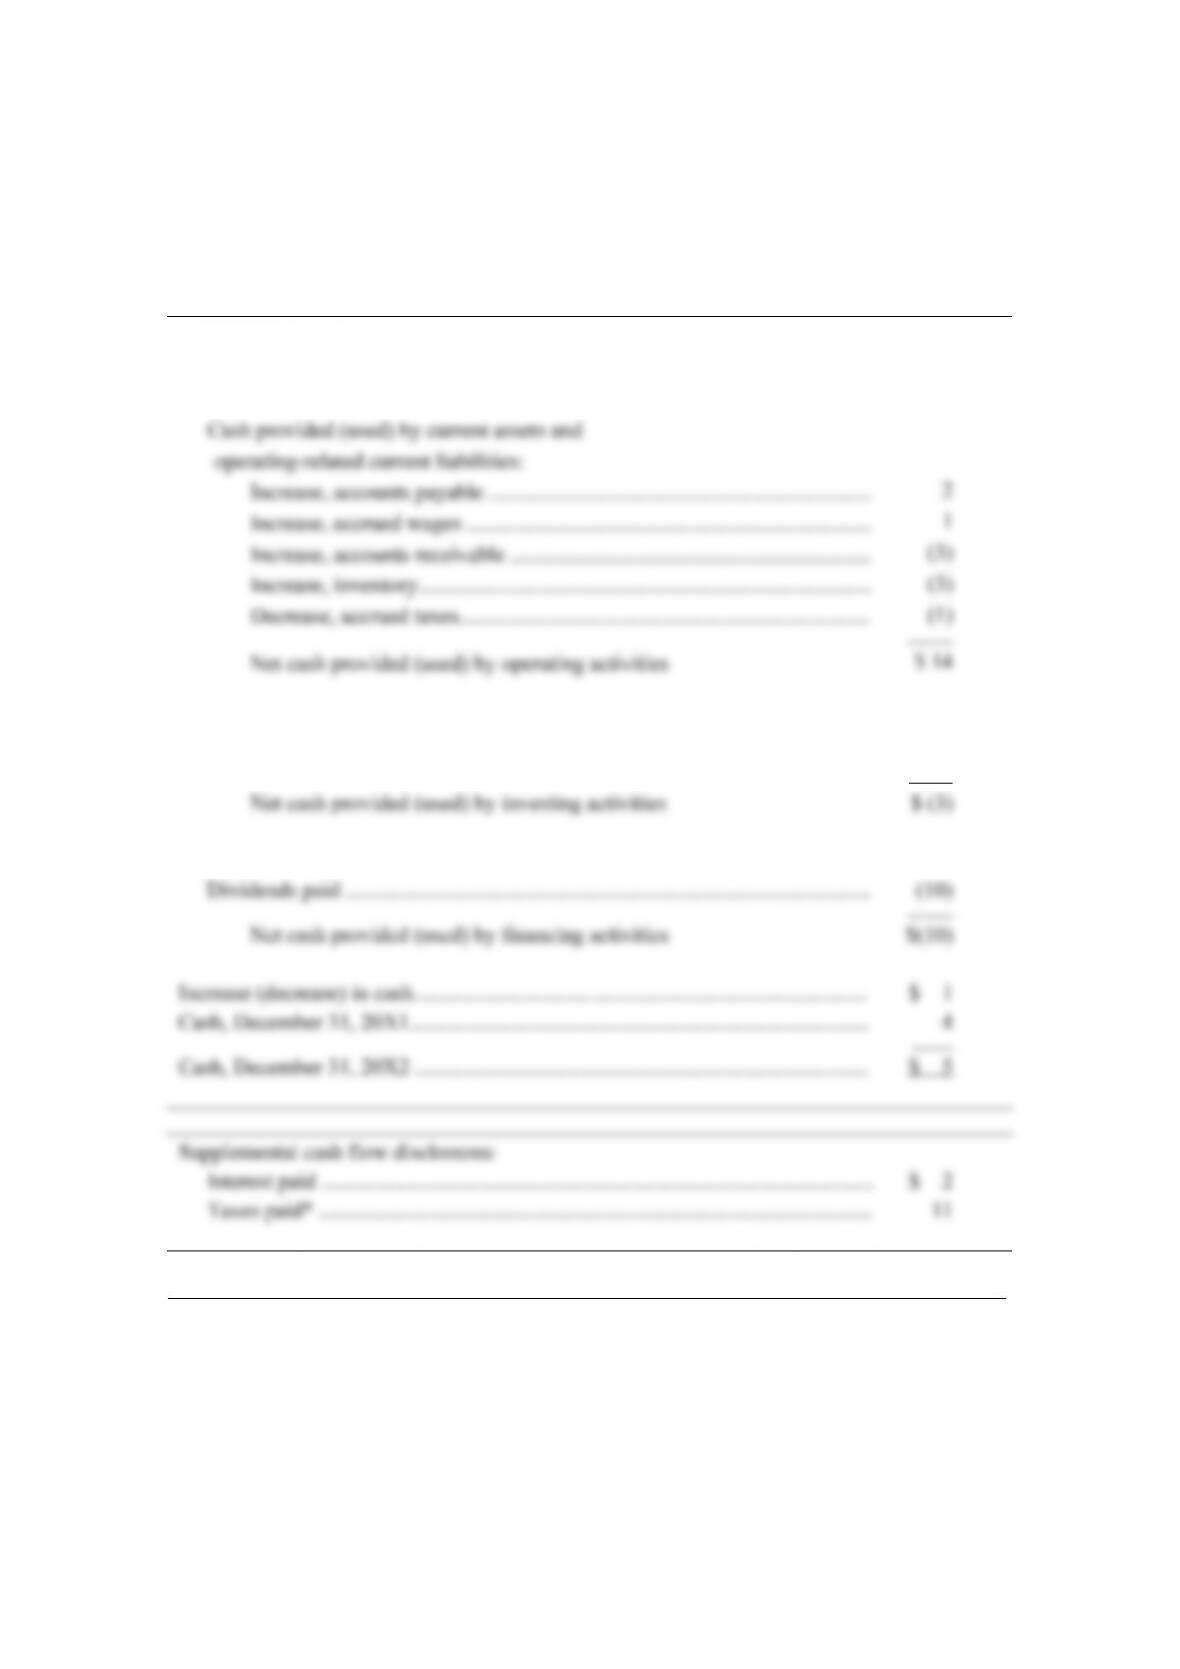
Svoboda Corporation Statement of cash flows
for the year ended December 31, 20X2 (in millions)
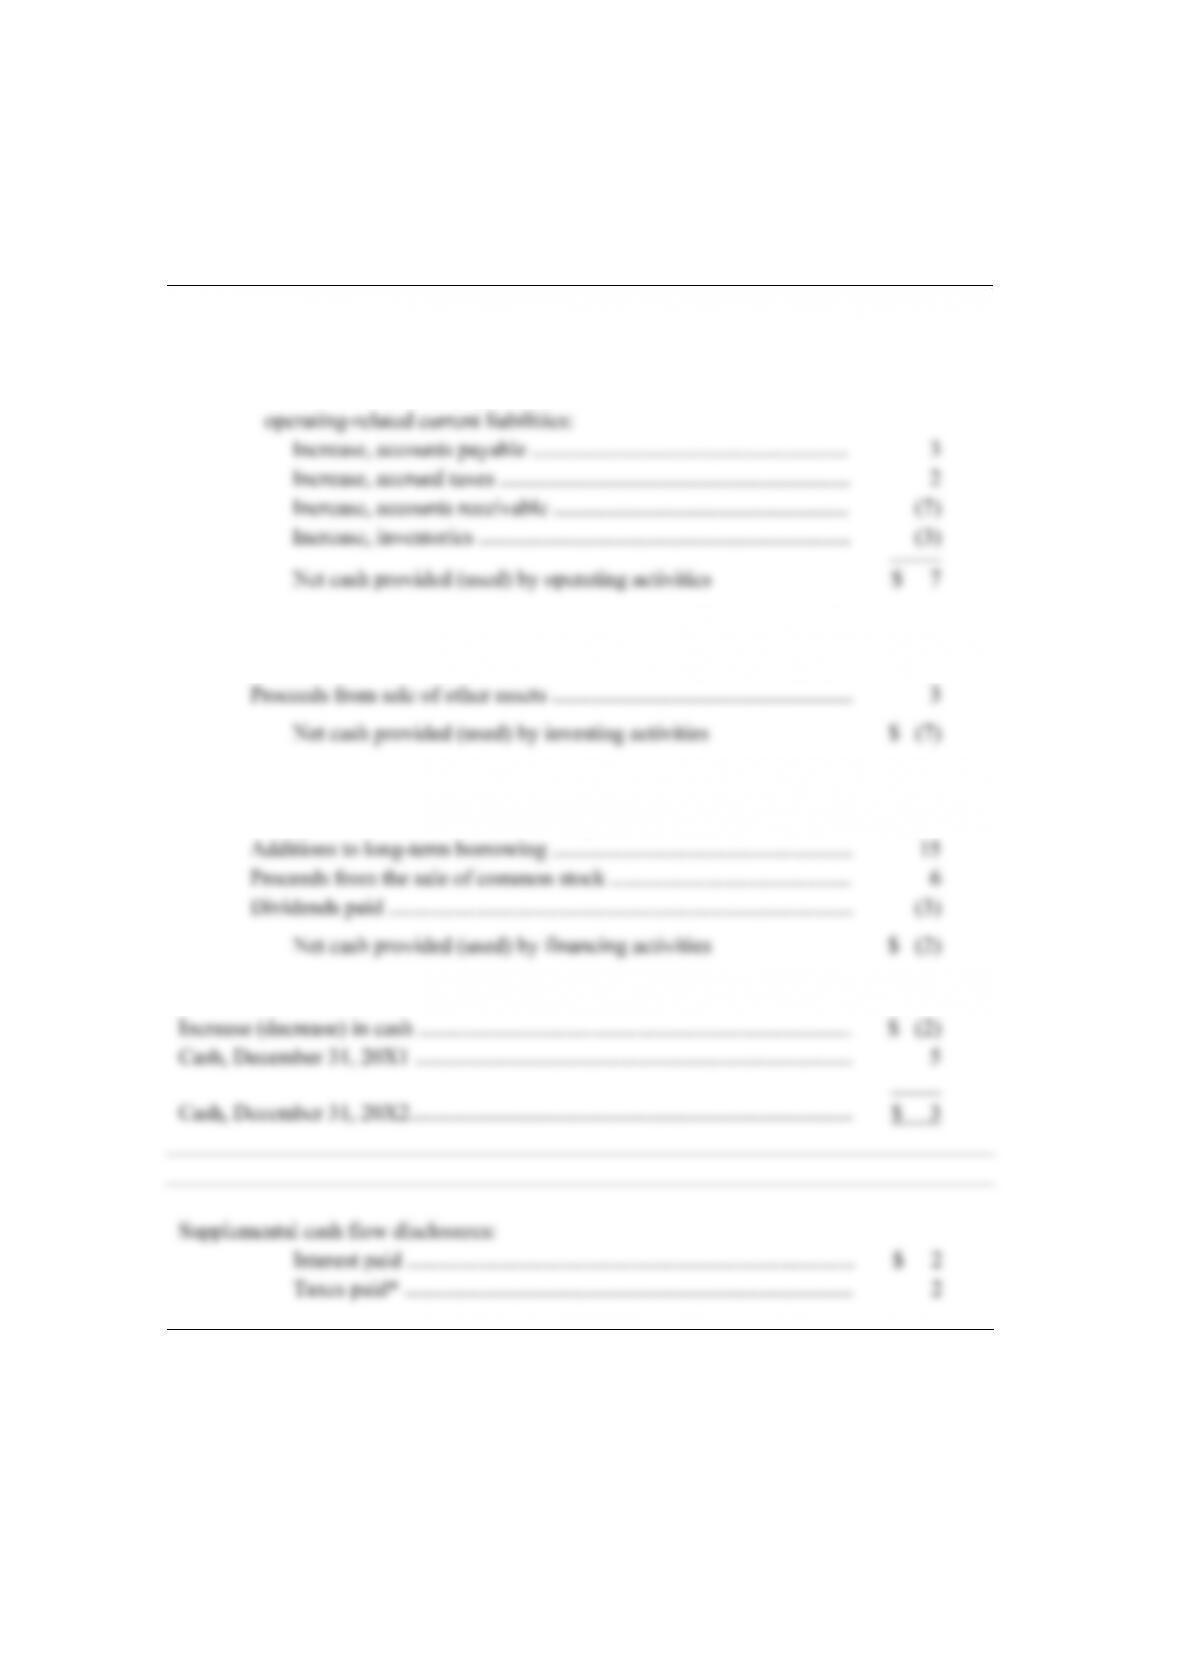
CASH FLOW FROM OPERATING ACTIVITIES:
Net income ……………………………………………………………………………… $ 7
Depreciation …………………………………………………………………………… 5
Cash provided (used) by current assets and
CASH FLOW FROM INVESTING ACTIVITIES:
Additions to fixed assets ……………………………………………………………. $ (10)
CASH FLOW FROM FINANCING ACTIVITIES:
Decrease in short-term bank borrowings ……………………………………… $ (20)
*Note: Taxes paid = Taxes (from income statement) minus increase in accrued taxes (from
comparative balance sheets) — $2 = $4 – $2.
Chapter 7: Funds Analysis, Cash-Flow Analysis, and Financial Planning
66
© Pearson Education Limited 2008
3. a.
Begalla Corporation
Sources and uses of funds statement
for December 31, 20X1 to December 31, 20X2 (in millions)
Sources Uses
Funds provided by operations:
Net profit $15 Dividends $10
Van Horne and Wachowicz, Fundamentals of Financial Management, 13th edition, Instructor’s Manual
67
© Pearson Education Limited 2008
b.
Begalla Corporation
Statement of cash flows
for the year ended December 31, 20X2 (in millions)
CASH FLOW FROM OPERATING ACTIVITIES:
Net income ………………………………………………………………………………………… $ 15
Depreciation ………………………………………………………………………………………. 3
CASH FLOW FROM INVESTING ACTIVITIES:
Additions to fixed assets ……………………………………………………………………… $ (3)
CASH FLOW FROM FINANCING ACTIVITIES:
_______________________________________________________________
*Note: Taxes paid = Taxes (from income statement) plus decrease in accrued taxes (from
comparative balance sheets) — $11 = $10 + $1.
Chapter 7: Funds Analysis, Cash-Flow Analysis, and Financial Planning
68
© Pearson Education Limited 2008
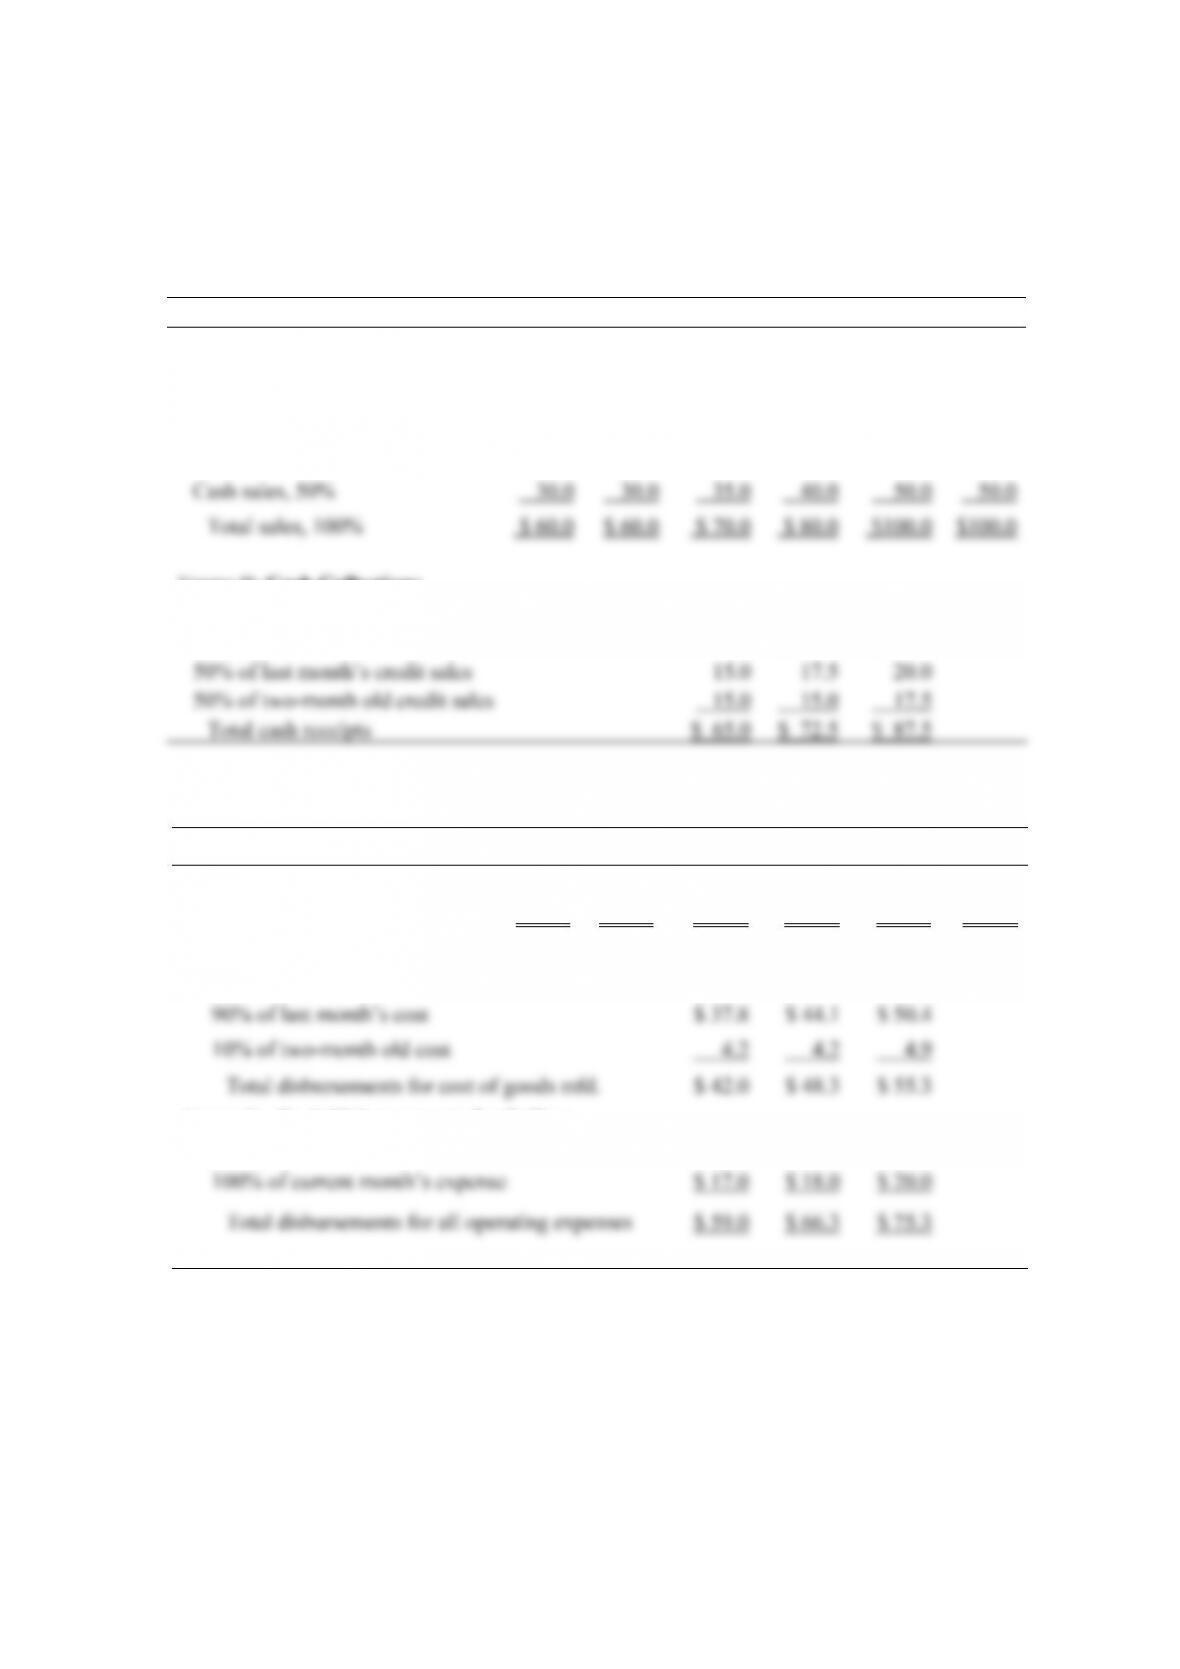
4.
Schedules of projected sales and collections
for May to July (in thousands)
Mar. Apr. May June July Aug.
Frame A: Sales
Credit sales, 50% $ 30.0 $ 30.0 $ 35.0 $ 40.0 $ 50.0 $ 50.0
Frame B: Cash Collections
Cash sales, this month $ 35.0 $ 40.0 $ 50.0
Schedule of projected disbursements for operating expenses for May to July (in thousands)
Mar. Apr. May June July Aug.
Frame A: Cost of
Goods Mfd. $ 42.0 $ 42.0 $ 49.0 $ 56.0 $ 70.0 $ 70.0
Frame B: Cash Disbursements for
Cost of Goods Mfd.
Frame C: Cash Disbursements for Selling,
General, and Administrative Expenses
Van Horne and Wachowicz, Fundamentals of Financial Management, 13th edition, Instructor’s Manual
69
© Pearson Education Limited 2008
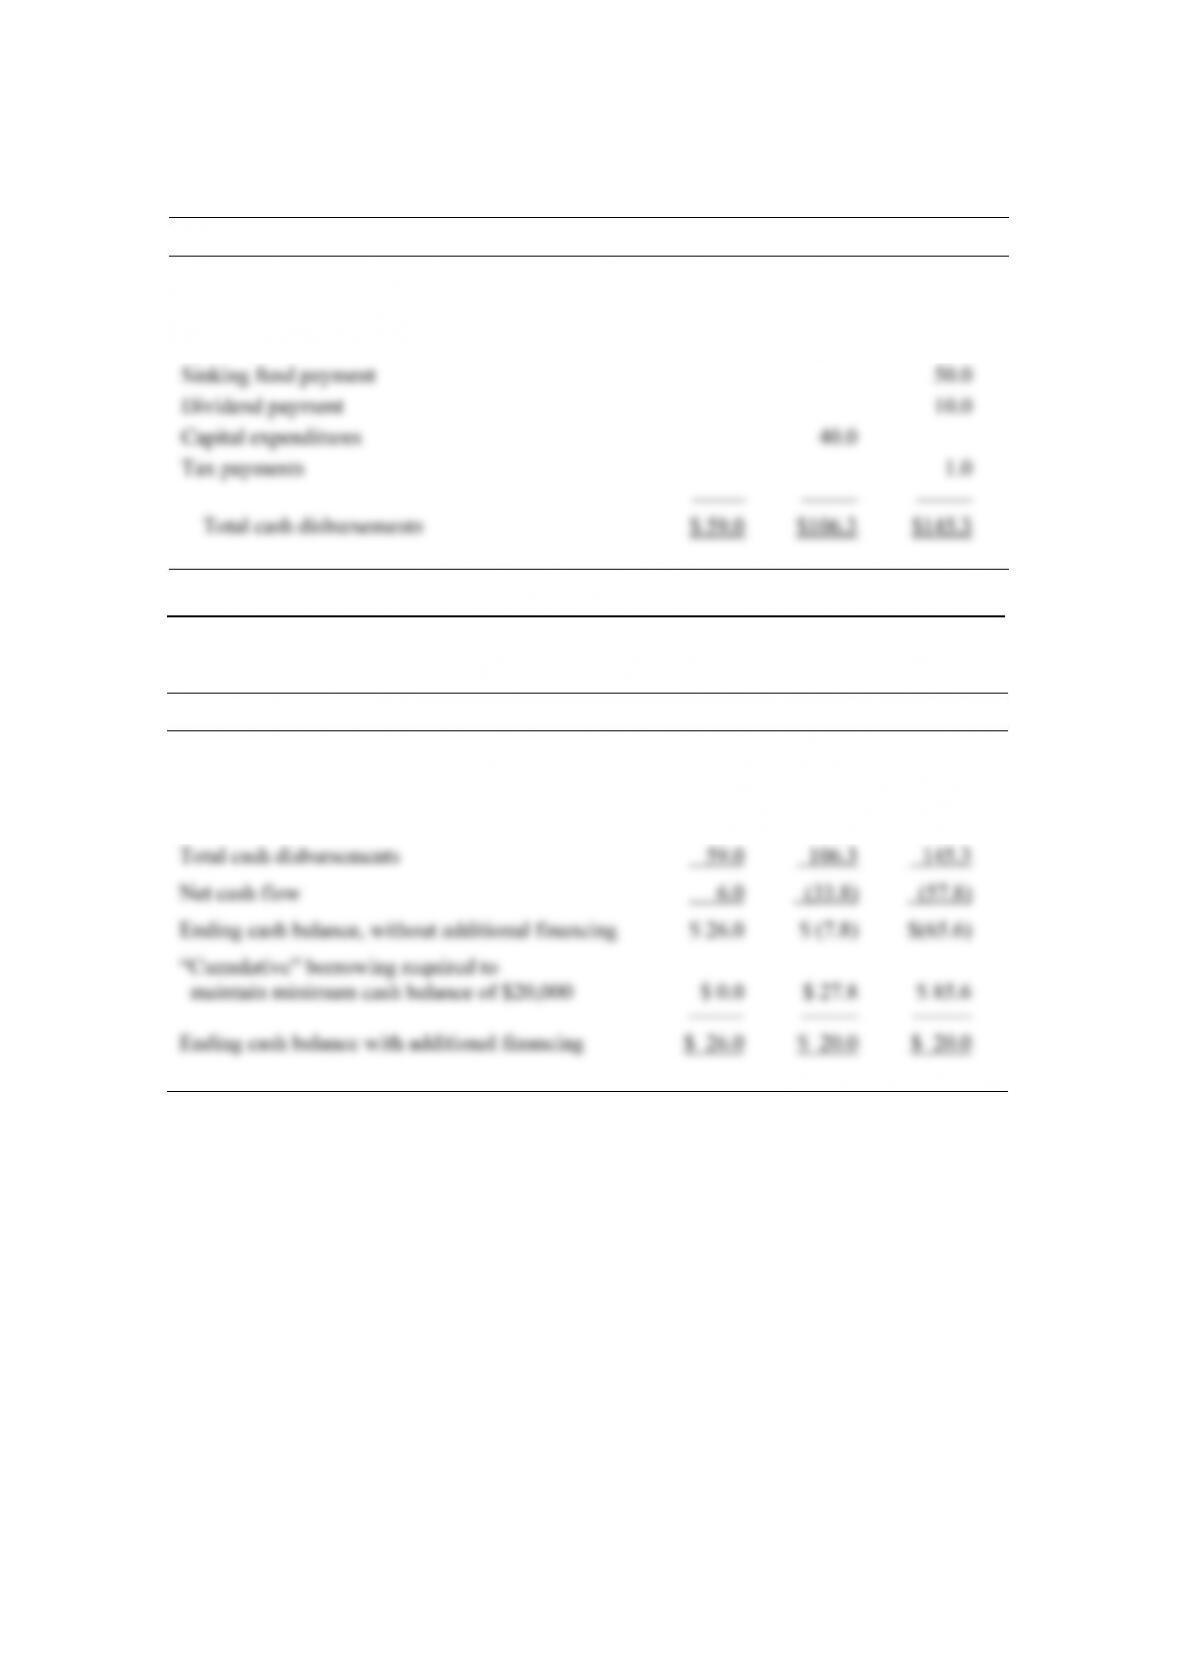
Schedule of projected total cash disbursements for May to July (in thousands)
May June July
Total disbursements for all operating expenses $ 59.0 $ 66.3 $ 75.3
Interest payment 9.0
________________________________________________________________
Schedule of projected net cash flows and cash balances for May to July (in thousands)
May June July
Beginning cash balance, without additional financing $ 20.0 $ 26.0 $ (7.8)
Total cash receipts 65.0 72.5 87.5
Chapter 7: Funds Analysis, Cash-Flow Analysis, and Financial Planning
70
© Pearson Education Limited 2008
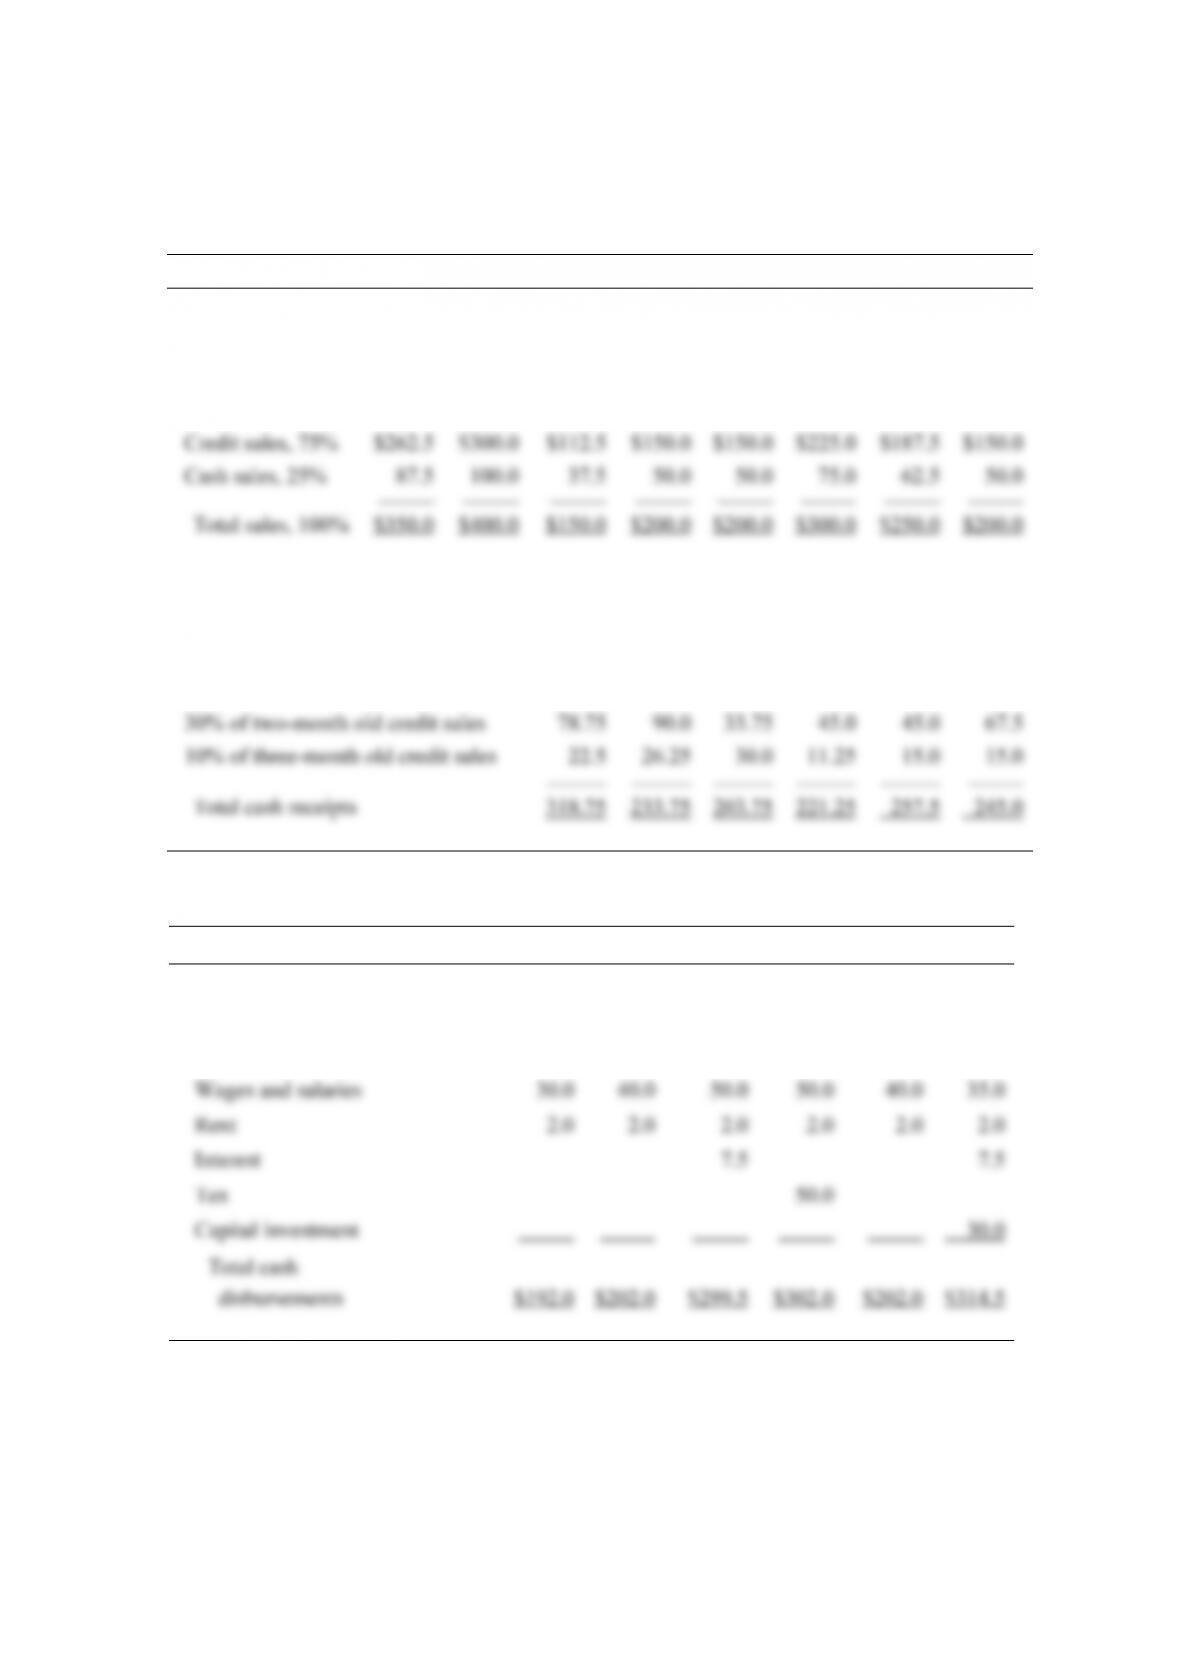
5.
Schedules of projected sales and collections for January to June (in thousands)
Nov. Dec. Jan. Feb. Mar. Apr. May June
Frame A: Sales
Frame B: Cash Collections
Cash sales, this month $ 37.5 $ 50.0 $ 50.0 $ 75.0 $ 62.5 $ 50.0
60% of last month’s credit sales 180.0 67.5 90.0 90.0 135.0 112.5
Schedule of projected total cash disbursements for January to June (in thousands)
Jan. Feb. Mar. Apr. May June
Cash payments for:
Purchases $160.0 $160.0 $240.0 $200.0 $160.0 $240.0
Van Horne and Wachowicz, Fundamentals of Financial Management, 13th edition, Instructor’s Manual
71
© Pearson Education Limited 2008
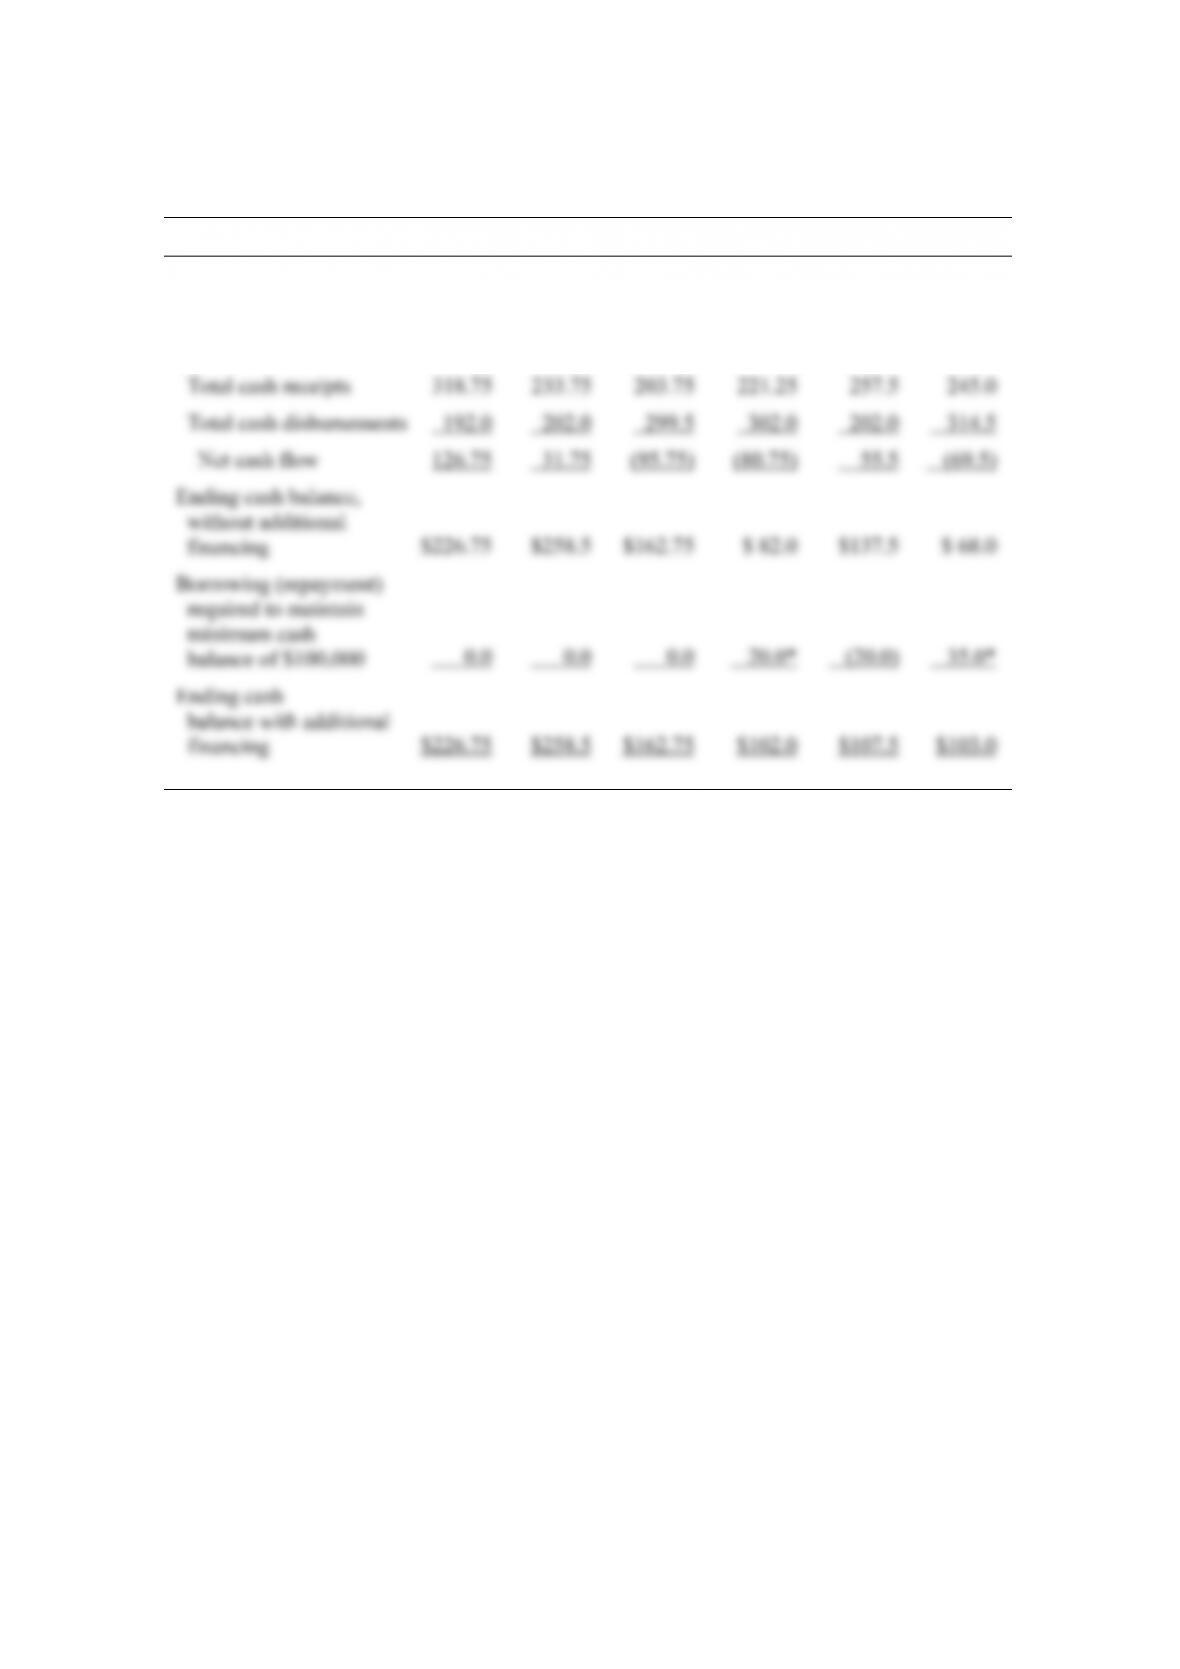
Schedule of projected net cash flows and cash balances for January to June (in thousands)
Jan. Feb. Mar. Apr. May June
Beginning cash
balance, without
additional financing
$100.0
$226.75
$258.5
$162.75
$ 82.0
$137.5
*Funds can be borrowed in $5,000 multiples.