49
© Pearson Education Limited 2008
Financial Statement Analysis
Financial statements are like a fine perfume – to be
sniffed but not swallowed.
ABRAHAM BRILLOFF
Chapter 6: Financial Statement Analysis
50
© Pearson Education Limited 2008
ANSWERS TO QUESTIONS
1. The purpose of a balance sheet is to present a picture of the firm’s financial position at one
2. By analyzing trends, one is able to determine whether there has been improvement or
3. Receivables and inventories undoubtedly dominate the current asset position of the firm.
Moreover, the collection period is probably slow and there may be some hidden bad debts.
4. A firm may generate a high return and still be technically insolvent for many reasons. Most
5. Both measures relate a balance sheet figure, which was the result of the last month, or so, of
sales, to annual income statement figures. Comparing a “stock” (balance sheet) item to a
6. A long-term creditor is interested in liquidity ratios because short-term creditors may force
7. a. Liquidity ratios to insure payment of principal by the going concern and debt ratios as a
b. The equity investor is interested in profitability ratios and ratios that provide
c. The fund manager is interested in profitability ratios to provide some assurance of the
d. The president, as a manager, is interested in all the ratios, with particular emphasis on
8. The ratio of debt-to-equity and long-term debt to total capitalization both historically and in
9. Such a situation could come about if the company had invested its profits in large, slow-
Van Horne and Wachowicz, Fundamentals of Financial Management, 13th edition, Instructor’s Manual
51
© Pearson Education Limited 2008
In addition, if the firm has recently suffered a decline in the market value of its securities
10. Yes, it could. By increasing the turnover the company is really reducing its investment in
excessive stocks of inventory carrying a low or zero rate of return. The resulting inventory
The use of cost of goods sold in the ratio allows the analyst to separate the effects of an
11. No. The appropriate standard varies by industry. What is a good ratio for one industry may
12. Both firms are equally profitable. Each has an “earning power” or return on investment
13. Short-term creditors look at balance sheet assets as a loan safety margin for repayment in
the event of default. The income statement is ignored because the impact of future earnings
14. The use of index analysis allows one to go behind some of the trends that are evident in a
SOLUTIONS TO PROBLEMS
1.
(a) (b) (a) × (b)
Total Asset Net Profit Earning Power
Co. Turnover Margin (ROI)
A ($10M/$8M) = 1.25 ($.7M/$10M) = 0.07 0.0875
B ($20M/$10M) = 2.00 ($2M/$20M) = 0.10 0.2000
Chapter 6: Financial Statement Analysis
52
© Pearson Education Limited 2008
2. a. Current ratio = ($3,800 / $1,680) = 2.26
b. Acid-test ratio = ($3,800 – $2,100)/ $1,680 = 1.01
3. a. The return on investment declined because total asset turnover declined and the net
profit margin declined. Apparently, sales did not keep up with asset expansion or sales
b. The increase in debt came from short–term sources. Current assets increased relative to
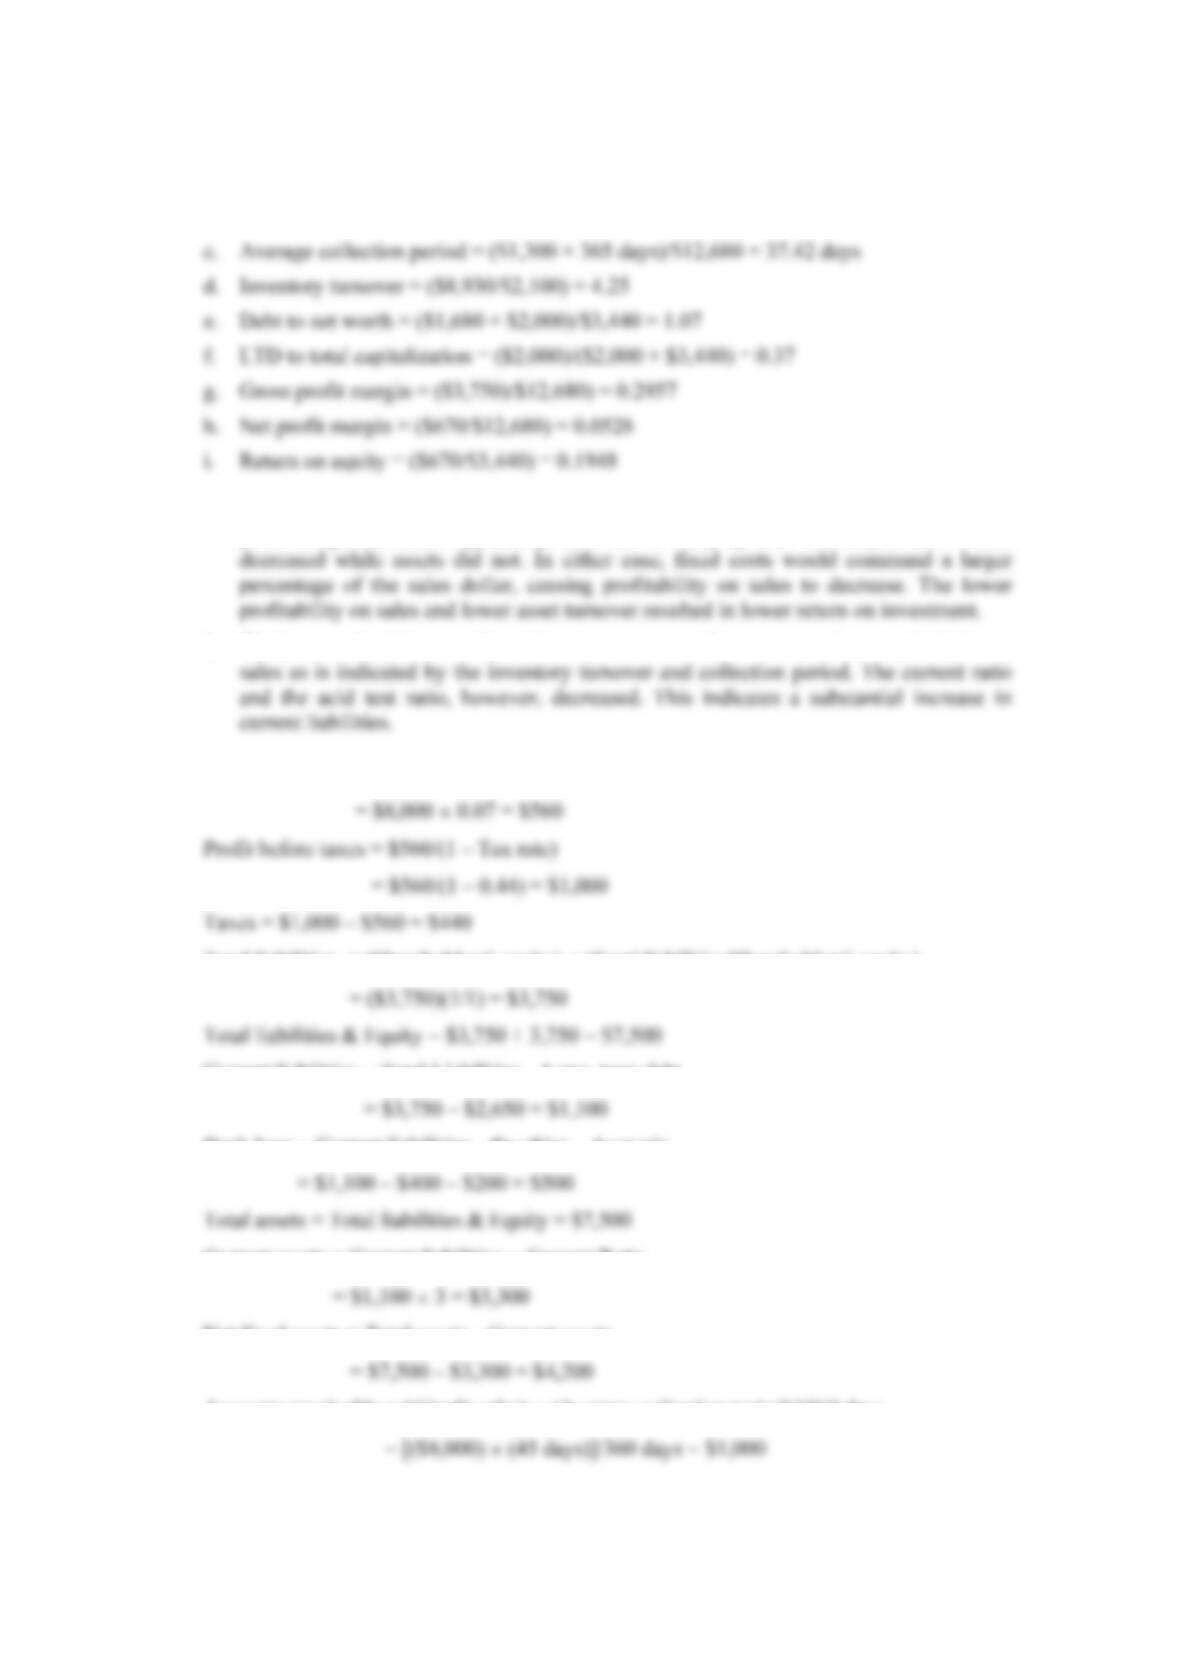
4. Profit after taxes = Sales × Net profit margin
Total liabilities = (Shareholders’ equity) × (Total liabilities/Shareholders’ equity)
Current liabilities = Total Liabilities – Long–term debt
Bank loan = Current liabilities – Payables – Accruals
Current assets = Current liabilities × Current Ratio
Net fixed assets = Total assets – Current assets
Accounts receivable = [(Credit sales) × (Average collection period)]/360 days
Van Horne and Wachowicz, Fundamentals of Financial Management, 13th edition, Instructor’s Manual
53
© Pearson Education Limited 2008
Inventories = Current assets – Cash – Receivables
Cost of Goods Sold = (Inventories) × (Inventory turnover ratio)
Gross Profit = Sales – Cost of goods sold
Selling & Administrative Expenses = Gross profit – Interest – Profit before taxes
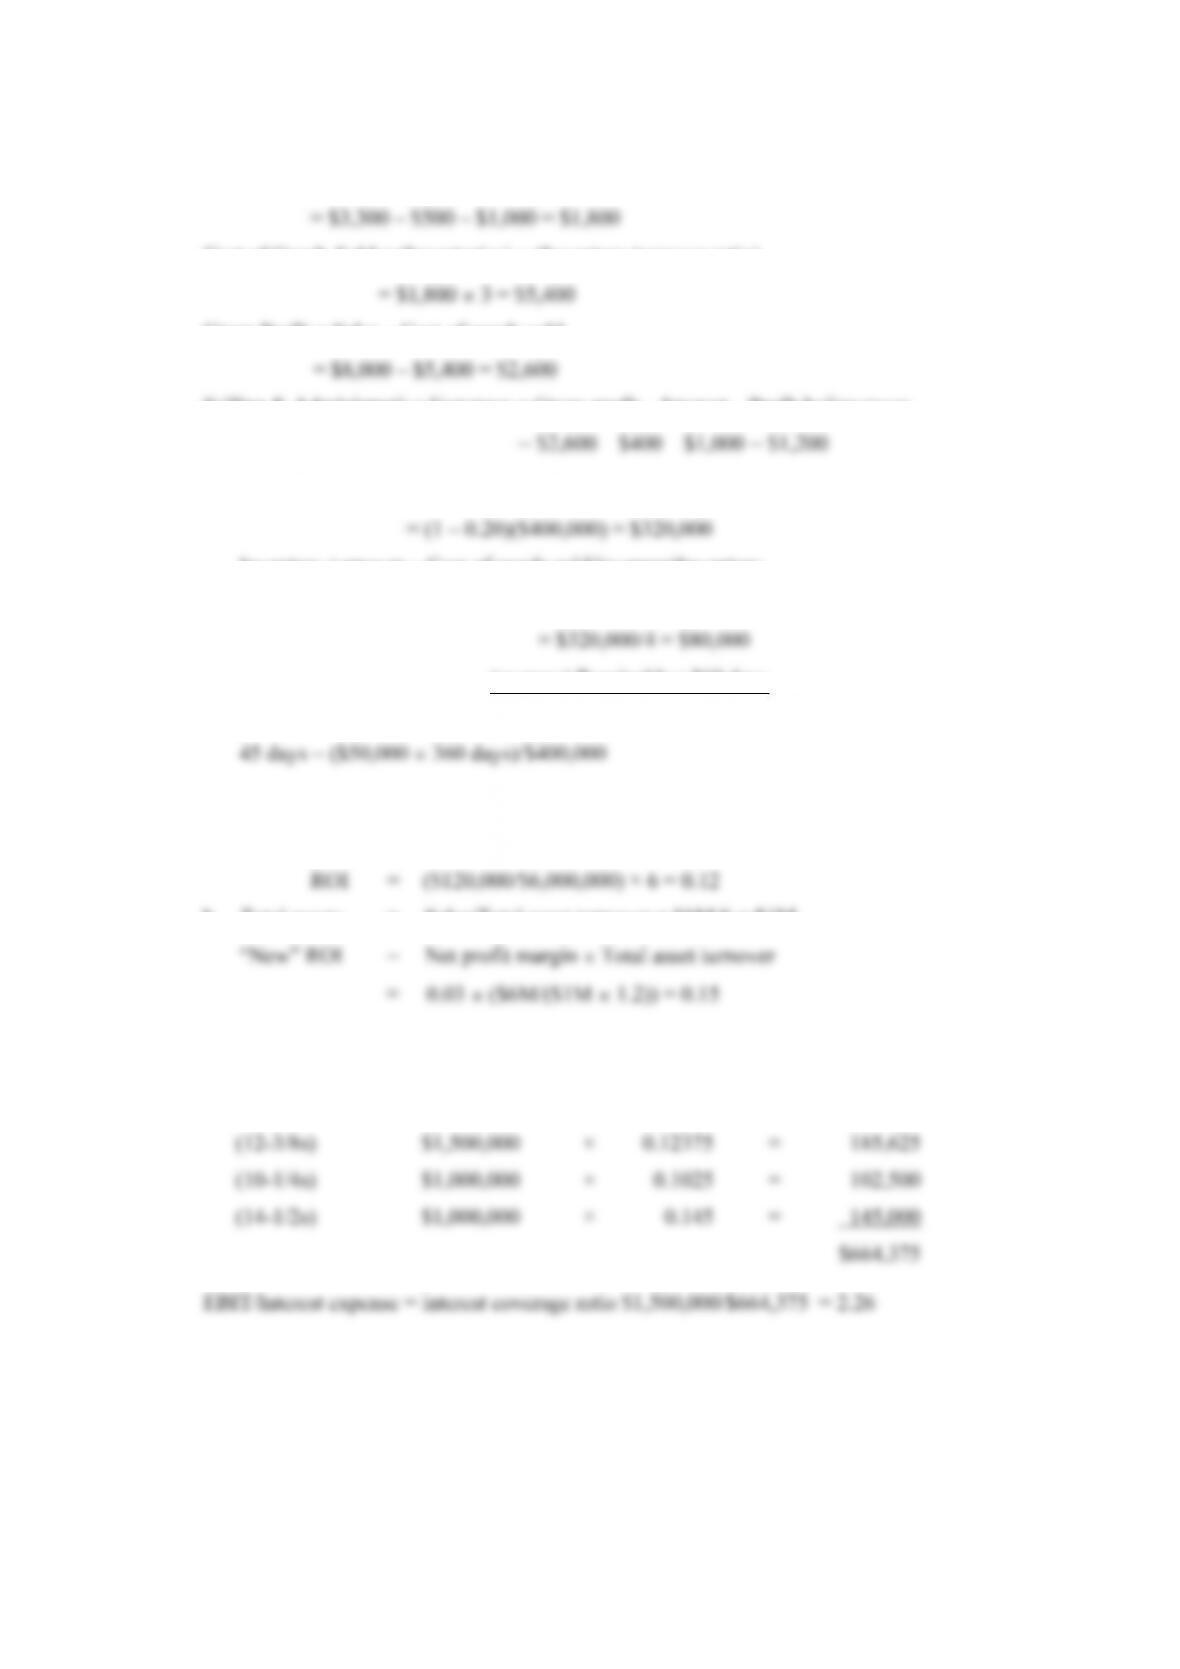
5. a. Cost of goods sold = (1 – Gross profit margin)(Net sales)
Inventory turnover = Cost of goods sold/(average)Inventory
Therefore, . . . (average) Inventory = Cost of goods sold/Inventory turnover
b. (average) Receivable × 360 days
Average collection period = Annual credit sales
6. a. Earning power = Sales profitability × Asset efficiency
ROI = Net profit margin × Total asset turnover
b. Total assets = Sales/Total asset turnover = $6M/6 = $1M
7. Interest on each issue:
(9-1/4s) $2,500,000 × 0.0925 = $231,250
Chapter 6: Financial Statement Analysis
54
© Pearson Education Limited 2008
8.
20X1 20X2 20X3 20X4
Cash 100.00 43.46 19.63 17.76
Receivables 100.00 129.35 152.18 211.21
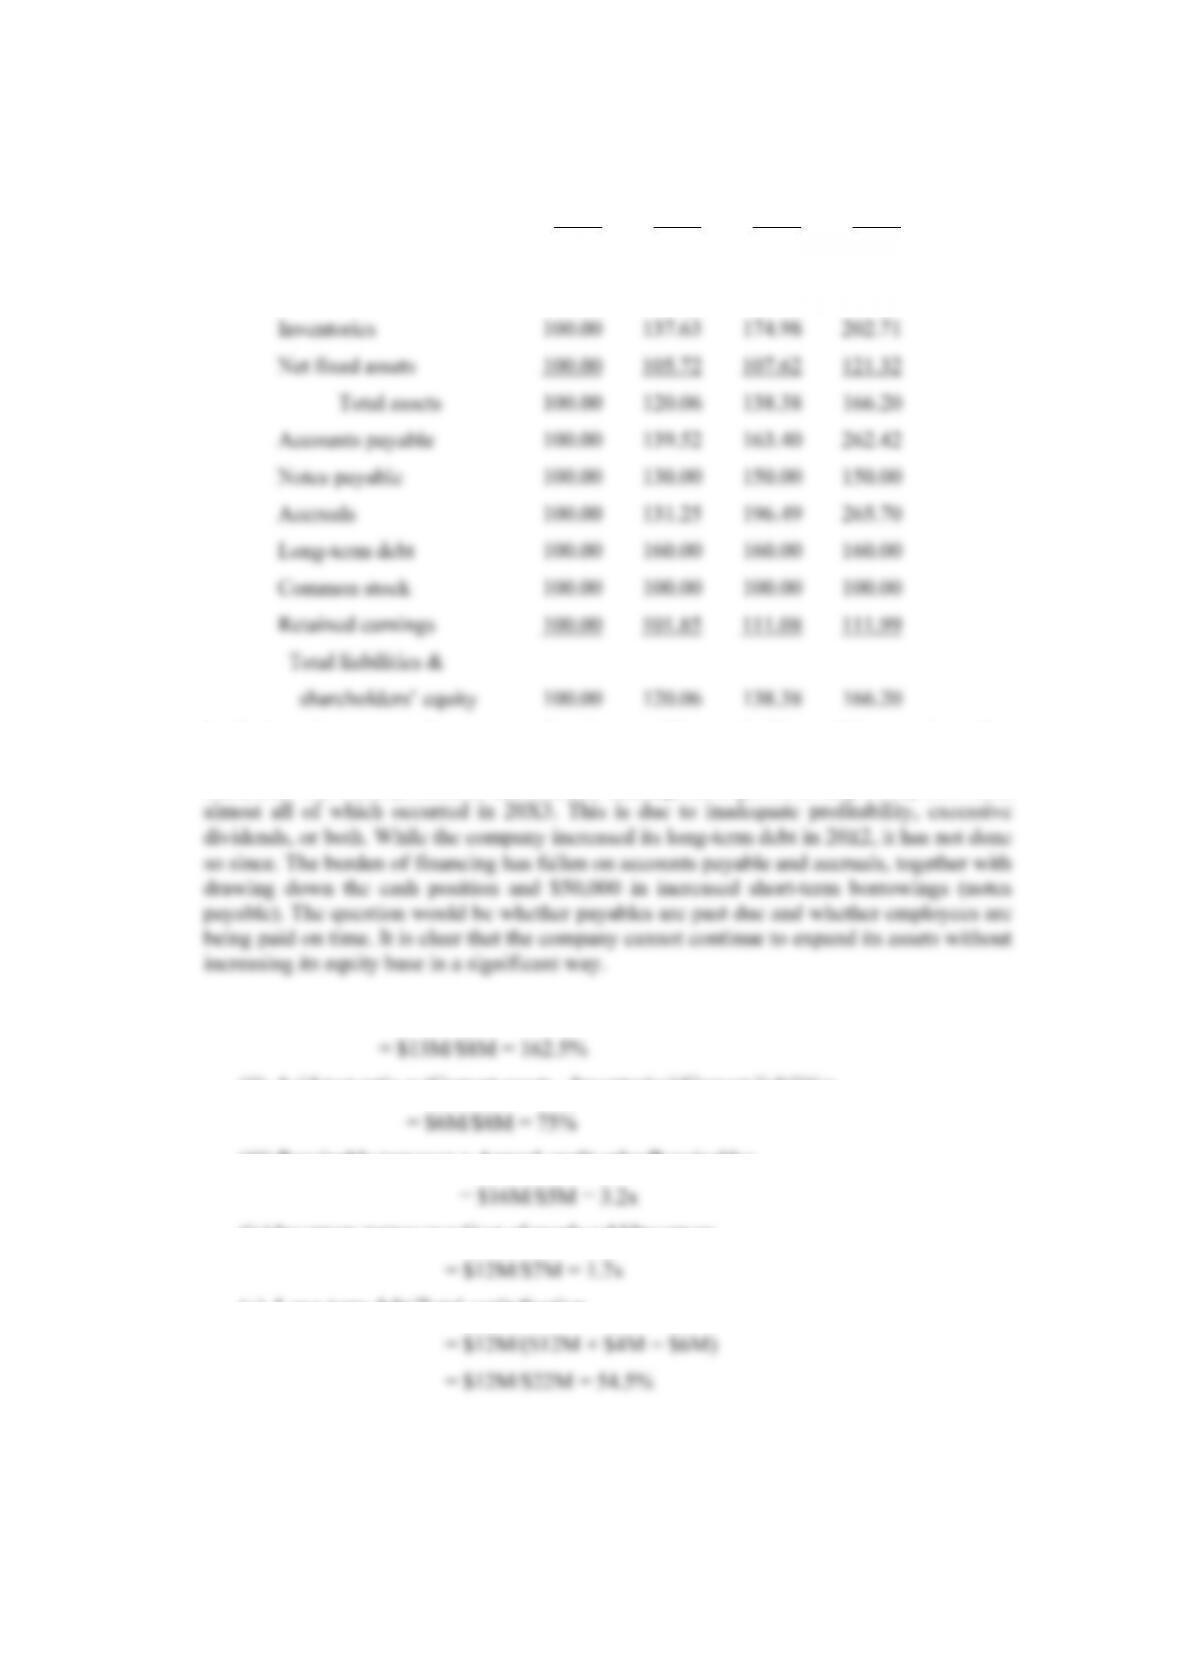
In the last three years, the company has increased its receivables and inventories rather
dramatically. While net fixed assets jumped in 20X4, changes were only modest in 20X2
and 20X3. The basic problem is that retained earnings have grown at only a very slow rate,
9. a. (i) Current ratio = Current assets/Current liabilities
(ii) Acid-test ratio = (Current assets – Inventories)/Current liabilities
(iii) Receivable turnover = Annual credit sales/Receivables
(iv) Inventory turnover = Cost of goods sold/Inventory
(v) Long-term debt/Total capitalization
Van Horne and Wachowicz, Fundamentals of Financial Management, 13th edition, Instructor’s Manual
55
© Pearson Education Limited 2008
(vi) Gross profit margin = (Sales – Cost of goods sold)/Sales
(vii) Net profit margin = Net income after taxes/Sales
(viii) Net income after taxes Dividends on preferred stock
Return on equity Net worth Par value of preferred stock
−
=−
(ix) Return on assets = Net income after taxes/Total assets
(xi) Interest coverage = EBIT/Interest charges
b. (i) Ratios 1-5 uniformly indicate that liquidity is deteriorating.
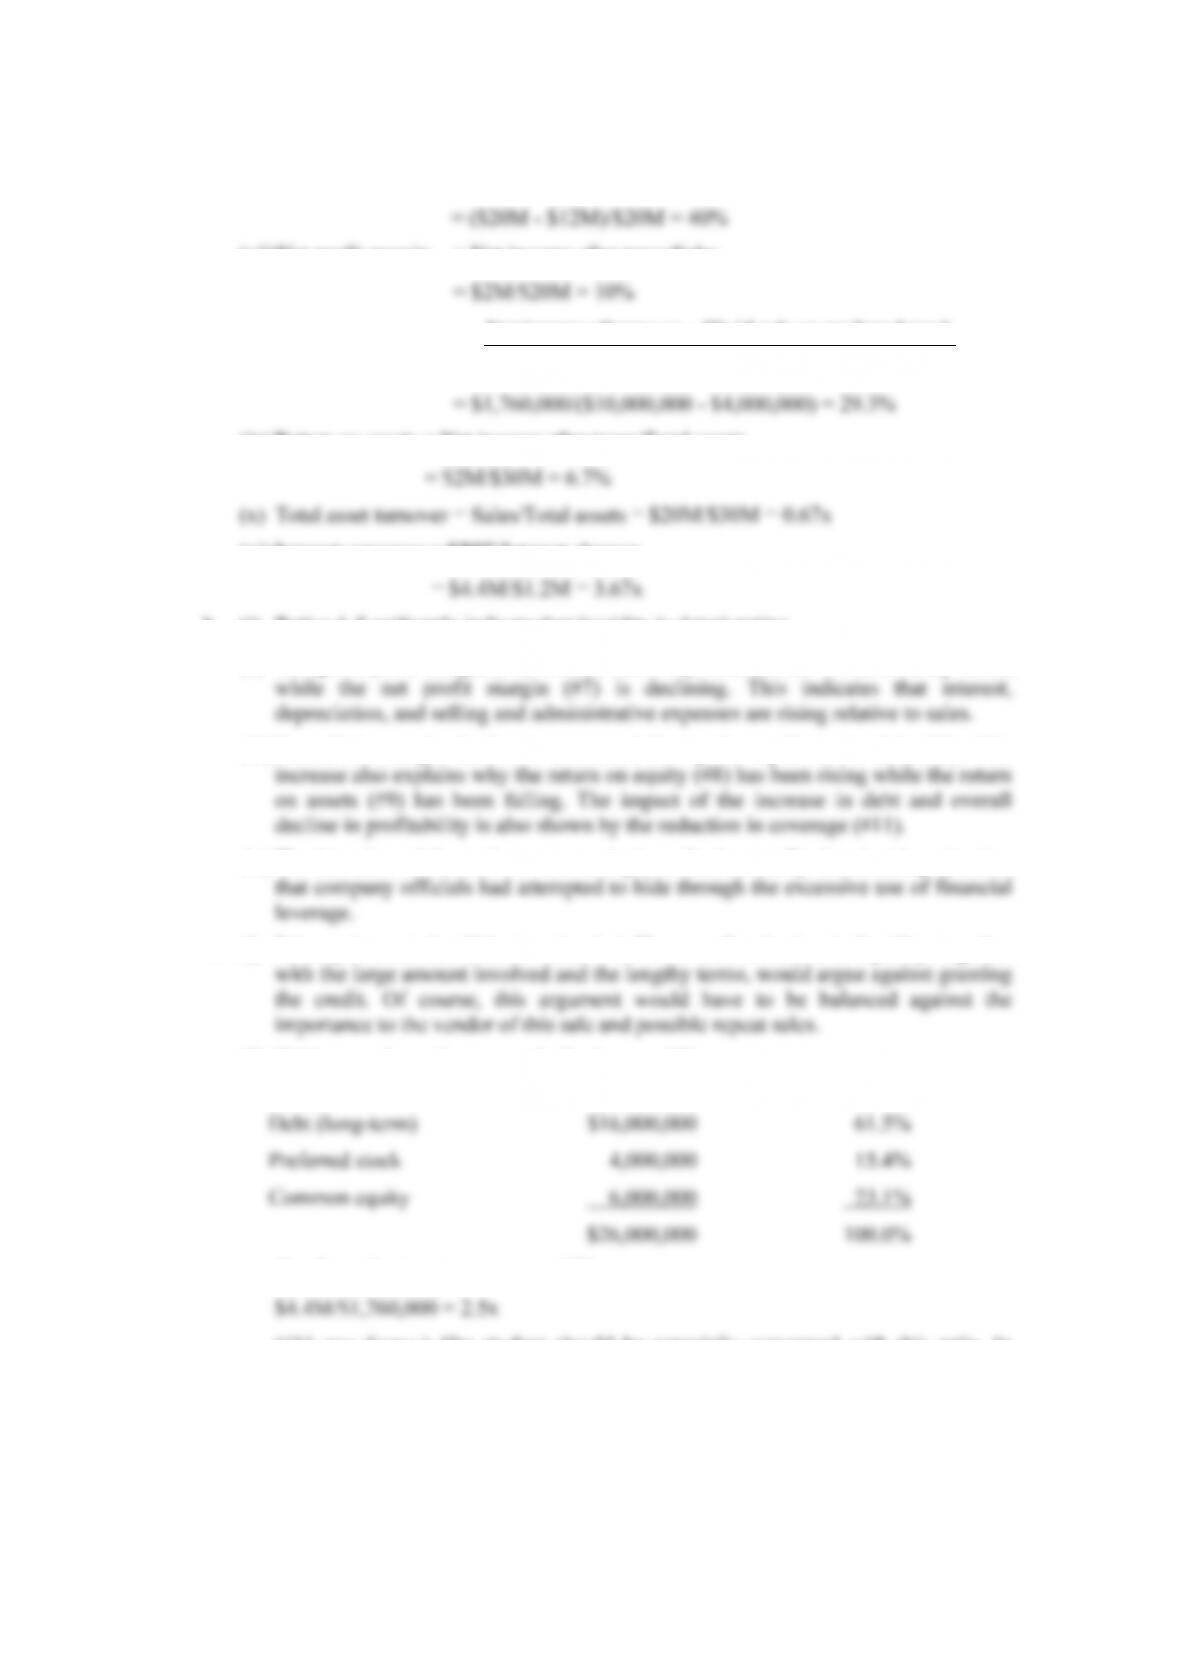
(ii) The gross profit margin (#6) remains relatively constant and at the industry norm,
(iii) Part of the margin decline is accounted for by the rapid rise in debt (#5). This
(iv) The intention of the authors was to depict a fundamentally deteriorating situation
c. (i) Primary interest should be in ratios 1-4. The overall reduction in liquidity, together
(ii) If this were done, the new capitalization would be:
Pro forma interest coverage would be
(#11 pro forma.) The student should be especially concerned with this ratio. In
addition, he/she would have to be concerned with all of the rest, as both
deteriorating liquidity and profitability would affect a 10-year note of the company.
There would appear to be little advantage in granting the loan.
Chapter 6: Financial Statement Analysis
56
© Pearson Education Limited 2008
(iii) An easy answer would be to point to the high rate of return on equity (#8) and say
SOLUTIONS TO SELF-CORRECTION PROBLEMS
1. Present current ratio = $800/$500 = 1.60.
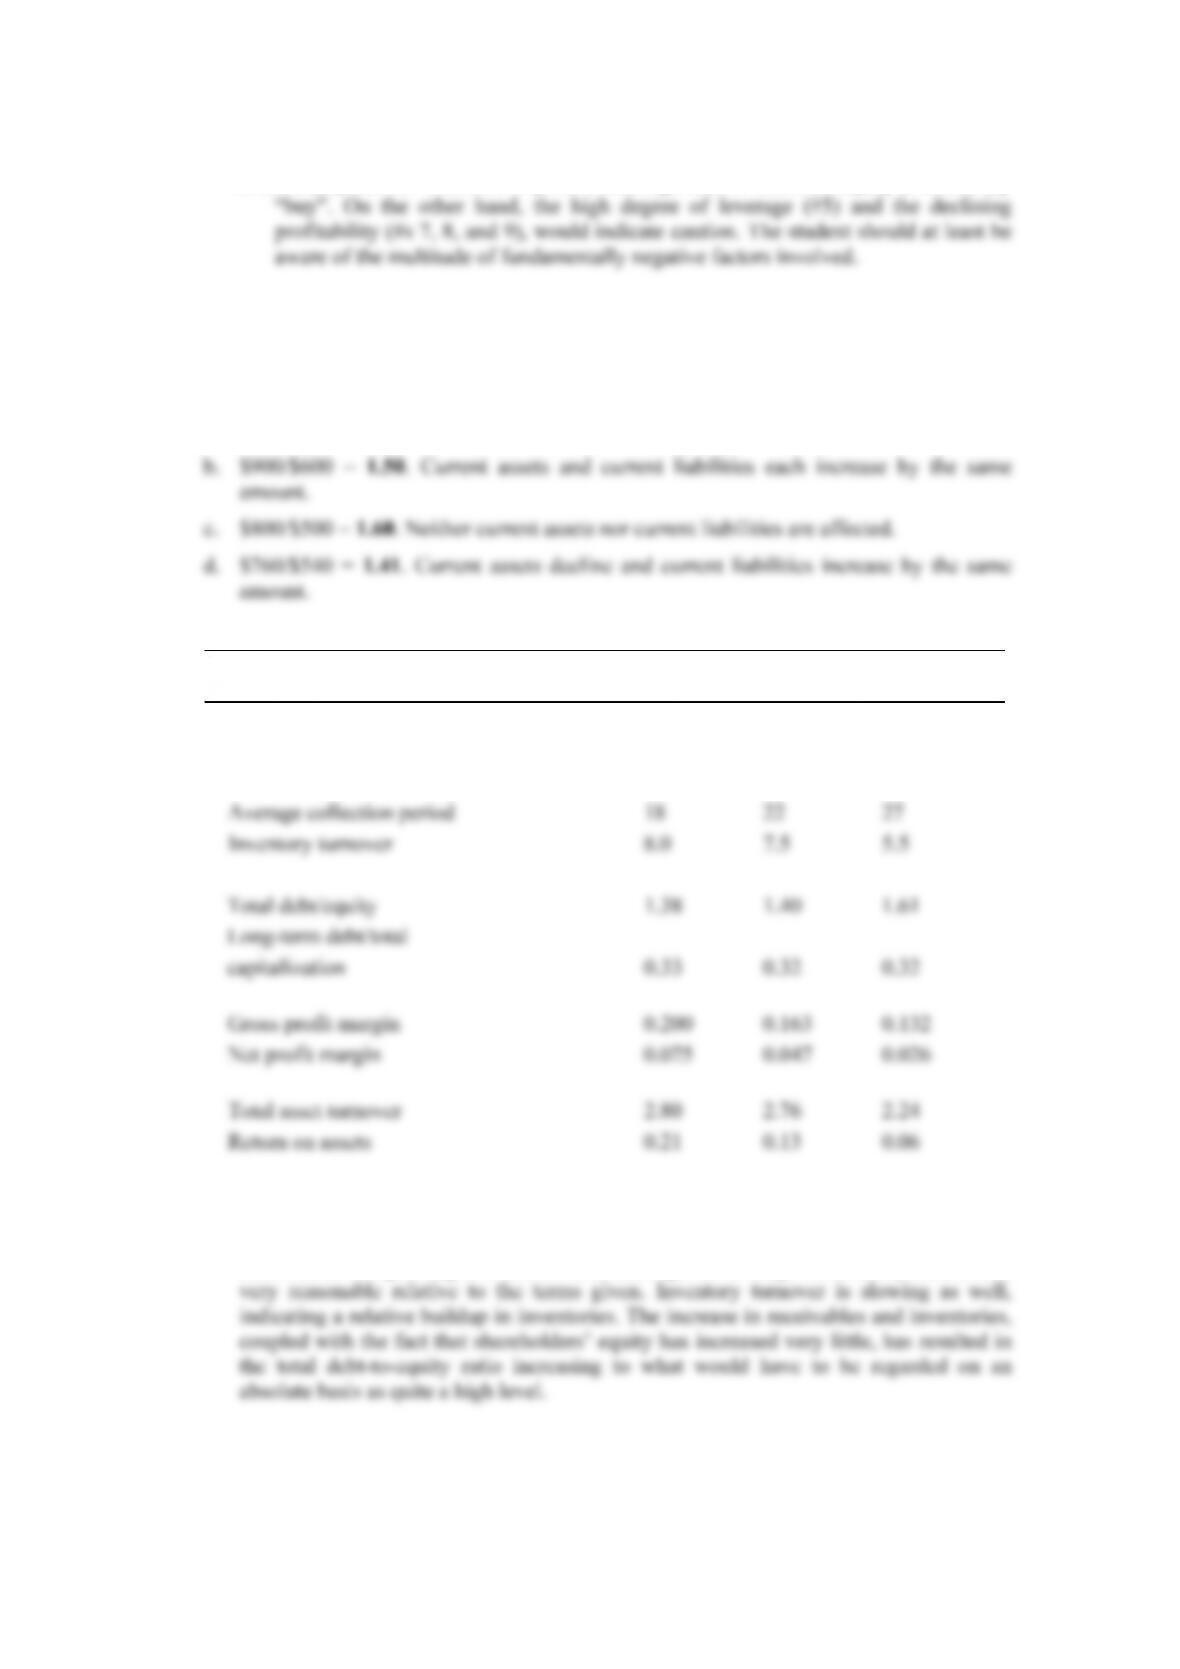
a. $700/$500 =
1.40. Current assets decline, and there is no change in current liabilities.
2.
20X1 20X2 20X3
Current ratio 1.19 1.25 1.20
Acid-test ratio 0.43 0.46 0.40
──────────────────────────────────────────────────
The company’s profitability has declined steadily over the period. As only $50,000 is
added to retained earnings, the company must be paying substantial dividends.
Receivables are growing at a slower rate, although the average collection period is still
Van Horne and Wachowicz, Fundamentals of Financial Management, 13th edition, Instructor’s Manual
57
© Pearson Education Limited 2008
The current and acid-test ratios have fluctuated, but the current ratio is not particularly
inspiring. The lack of deterioration in these ratios is clouded by the relative buildup in
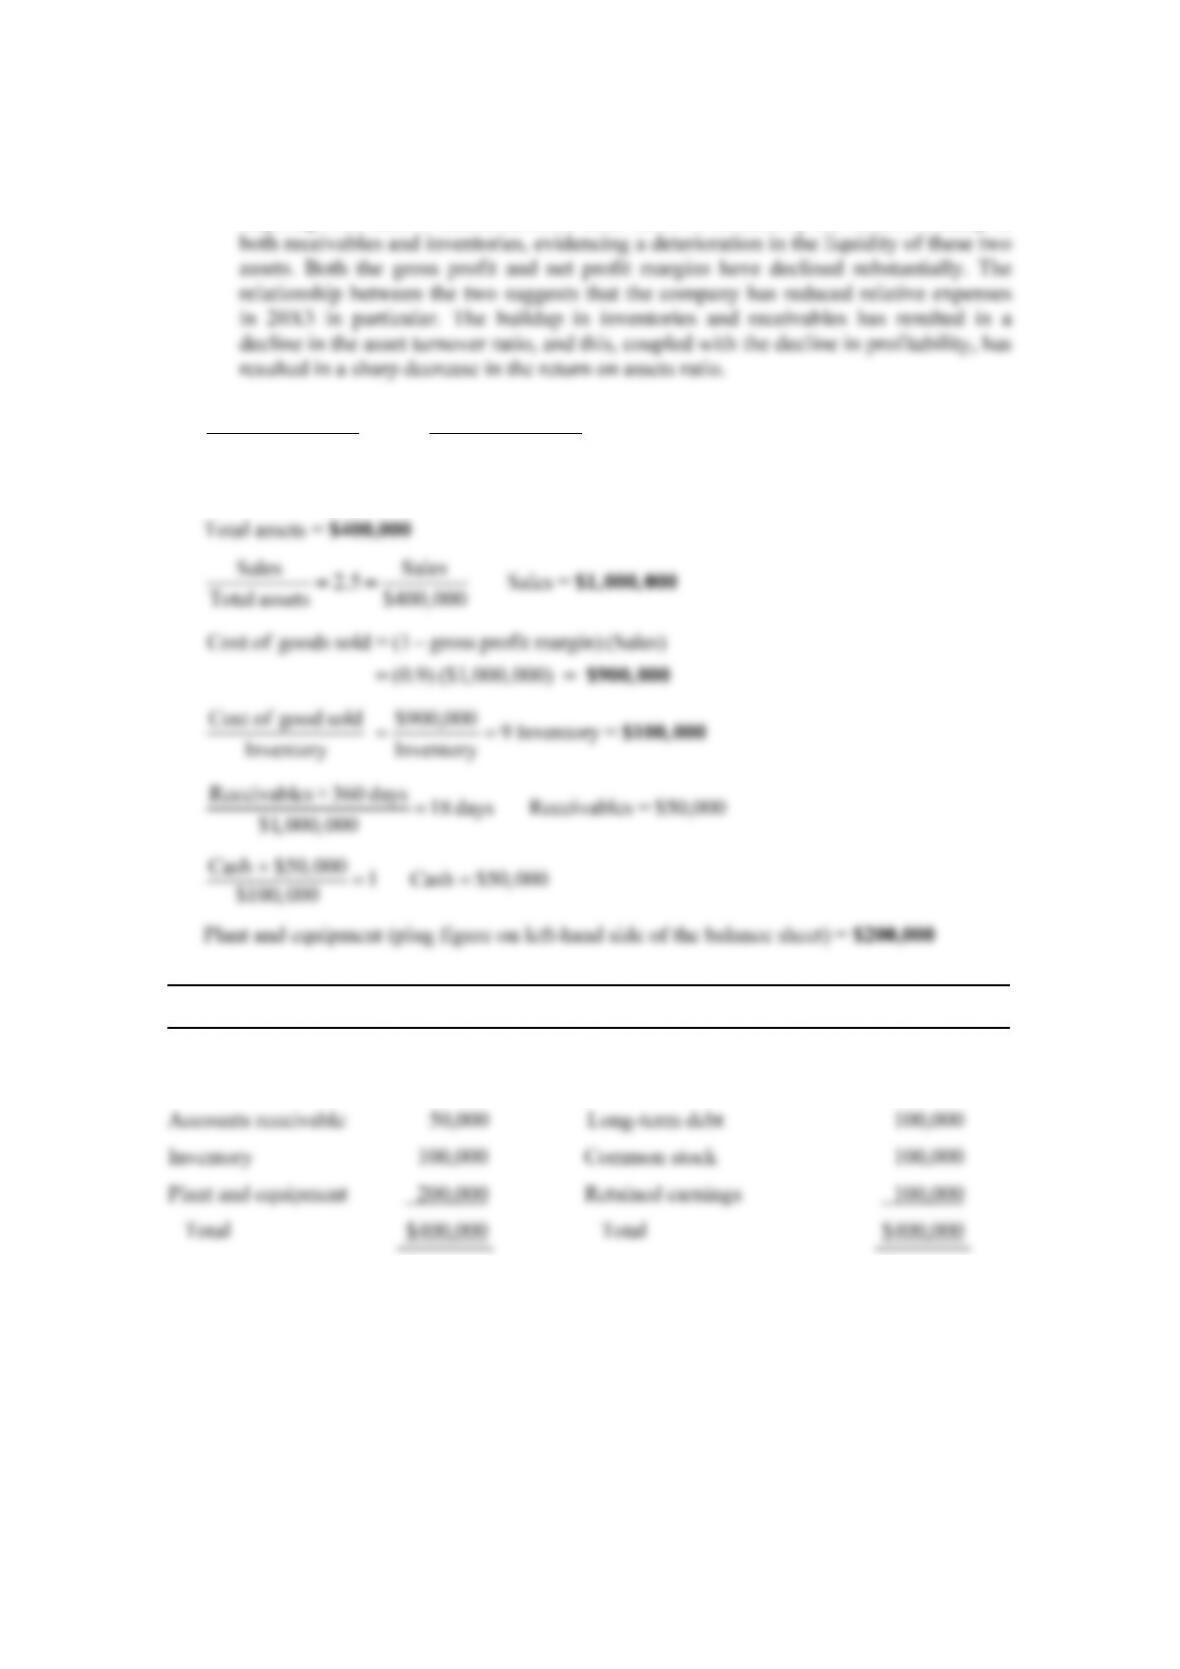
3. Long term debt Long term debt
0.5 Long-term debt =
Equity $200,000
−−
== $100,000
Total liabilities and shareholders’ equity = $400,000
Balance Sheet
Cash $ 50,000 Notes and payables $100,000
_____________________________________________________________________________
Chapter 6: Financial Statement Analysis
58
© Pearson Education Limited 2008
4.
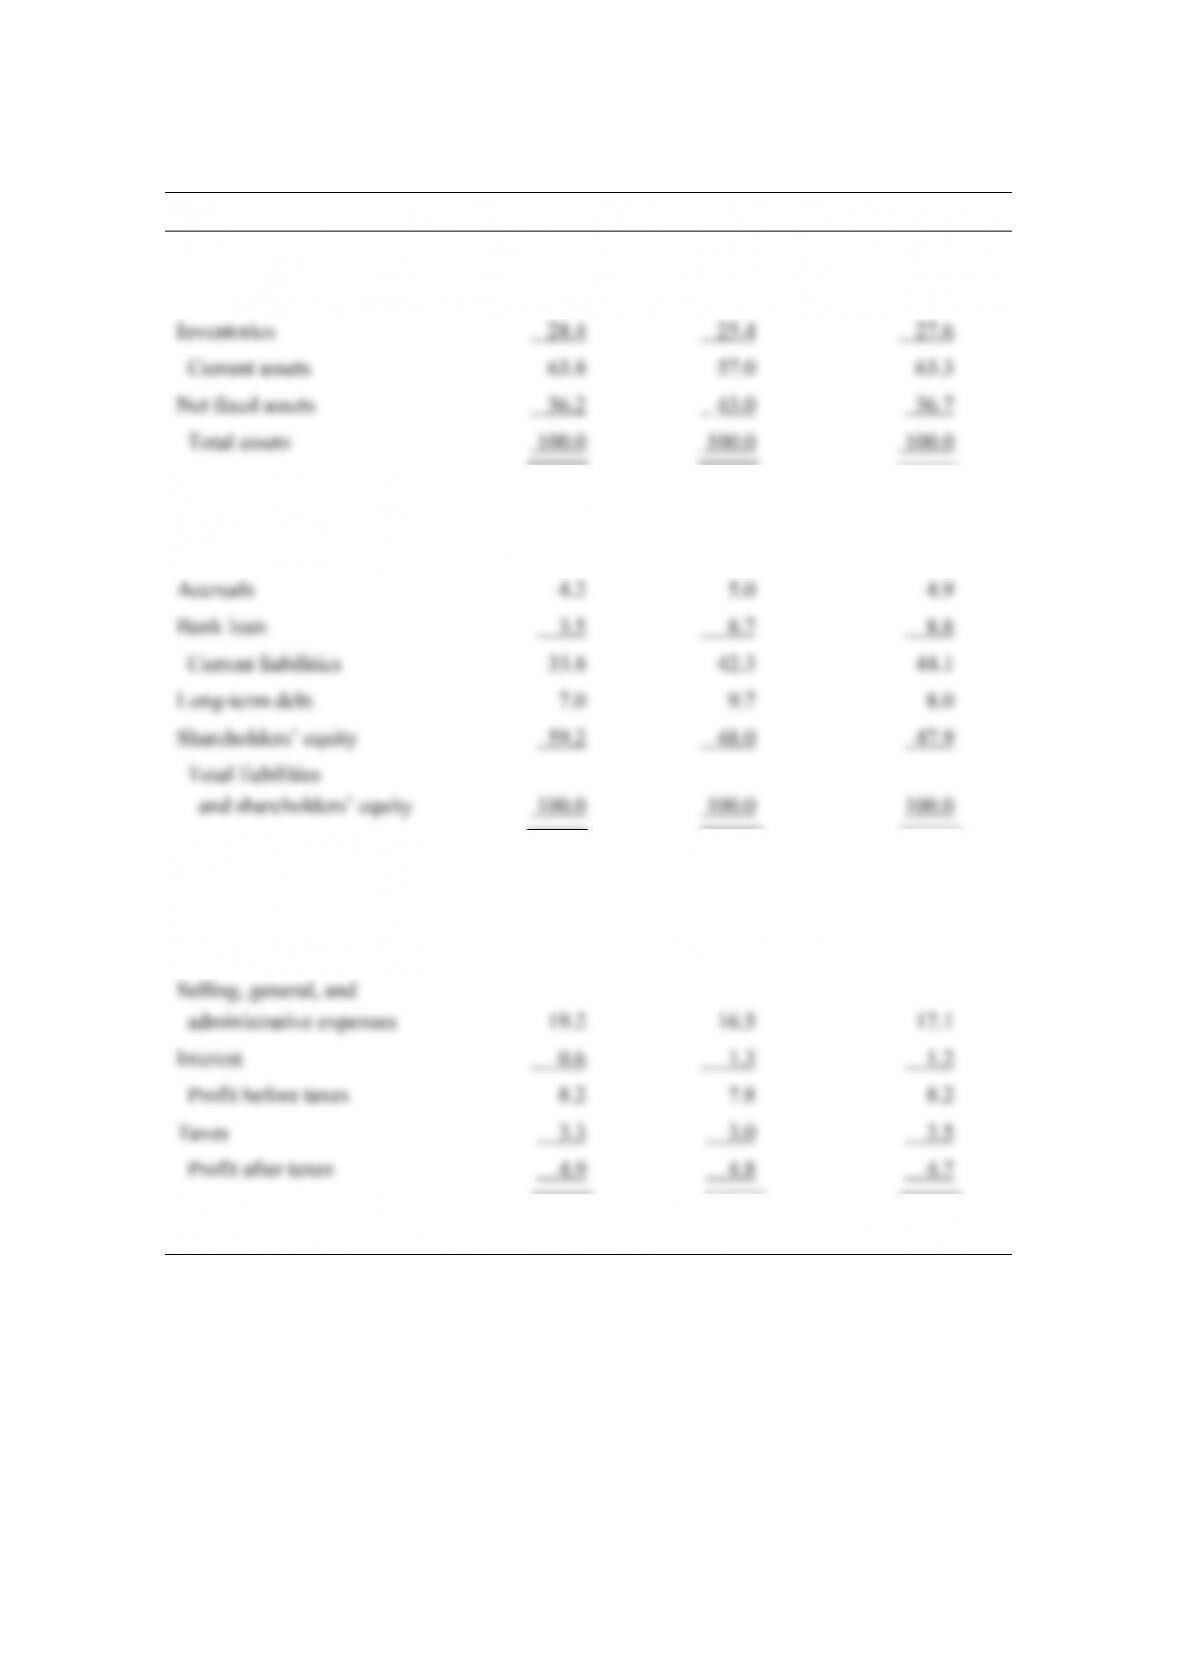
Common-Size Analysis (%) 20X1 20X2 20X3
Cash 7.9 3.8 1.7
Receivables 27.5 27.8 34.0
Payables 26.1 28.6 30.4
Sales 100.0 100.0 100.0
Cost of goods sold 72.0 74.4 73.5
Van Horne and Wachowicz, Fundamentals of Financial Management, 13th edition, Instructor’s Manual
59
© Pearson Education Limited 2008
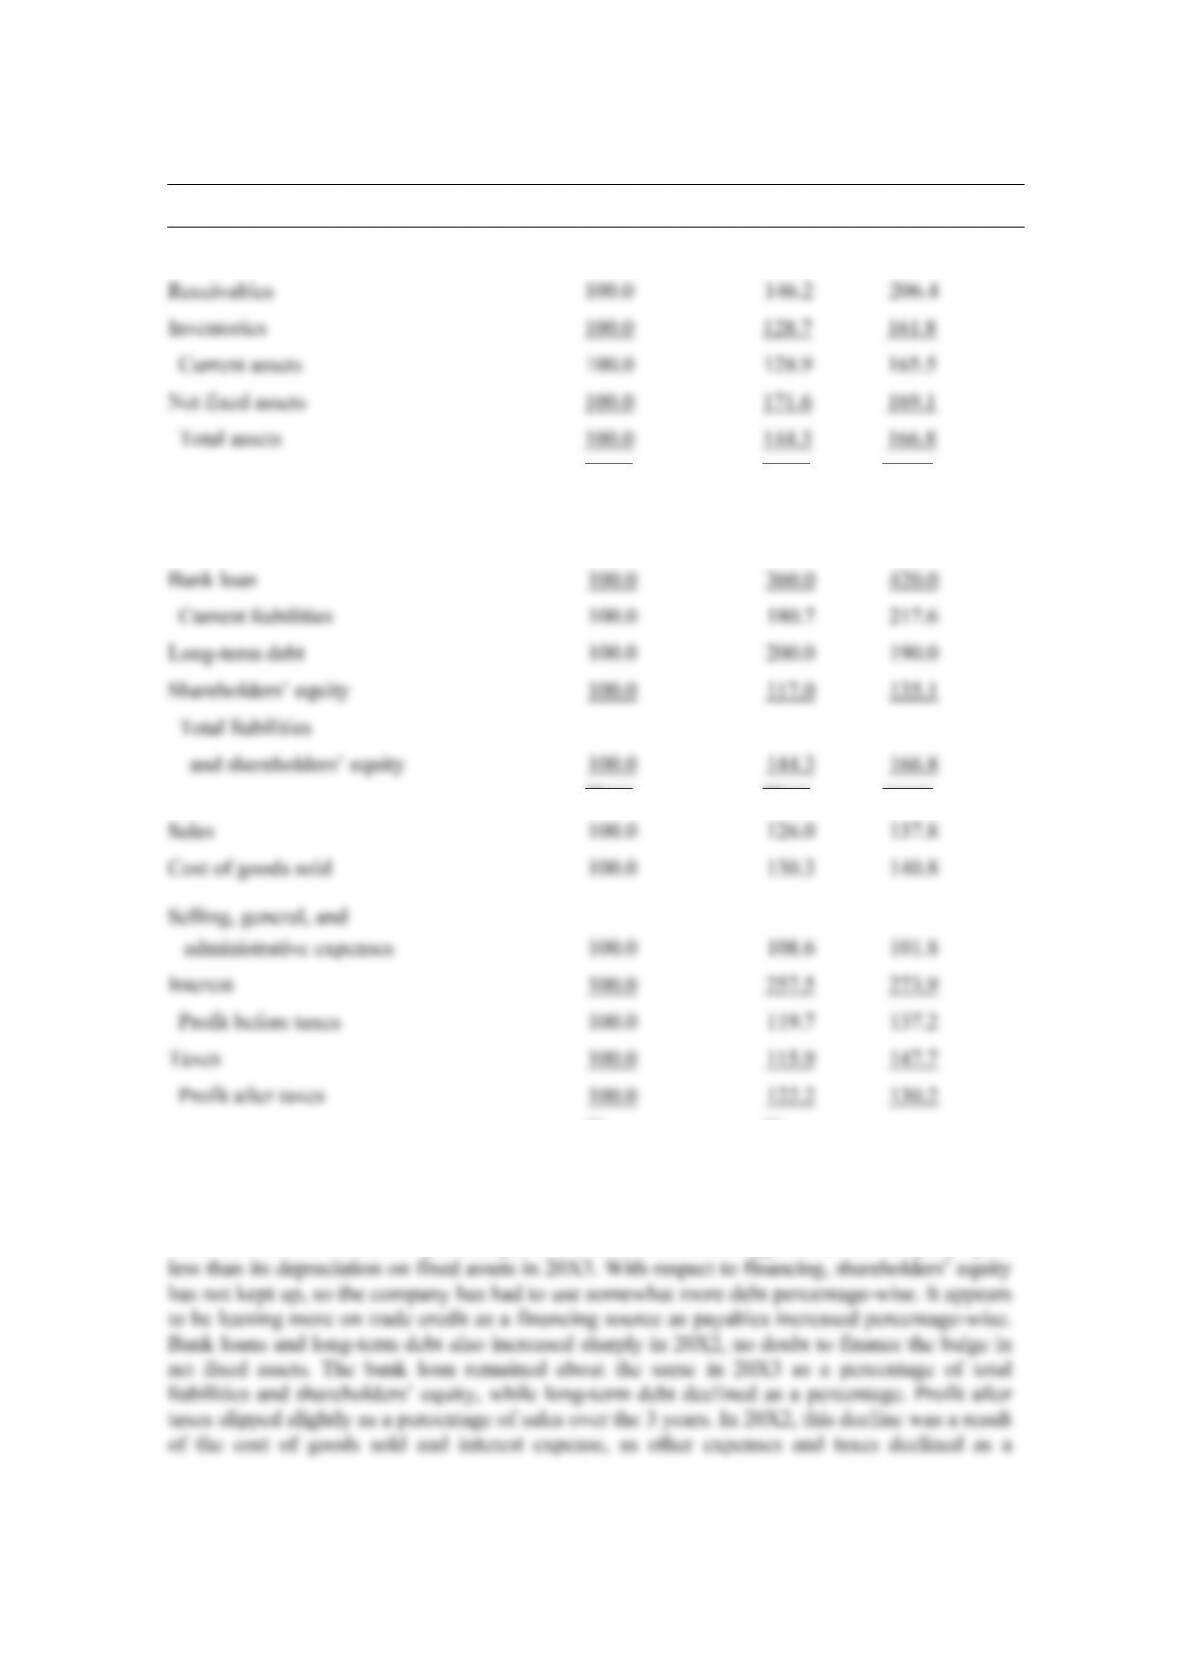
Index Analysis (%) 20X1 20X2 20X3
Cash 100.0 69.0 36.0
___ ___
Payables 100.0 158.1 194.0
Accruals 100.0 171.4 195.0
___ ___
___ ___
________________________________________________________________
The common-size analysis shows that cash declined dramatically relative to other current assets
and total assets in general. Net fixed assets surged in 20X2, but then fell back as a percentage of
the total to almost the 20X1 percentage. The absolute amounts suggest that the company spent

Chapter 6: Financial Statement Analysis
60
© Pearson Education Limited 2008
Index analysis shows much the same picture. Cash declined faster than total assets and current
assets, and receivables increased faster than these two benchmarks. Inventories fluctuated, but