
41
© Pearson Education Limited 2008
Risk and Return
Take calculated risks. That is quite different from being
rash.
GENERAL GEORGE S. PATTON
Chapter 5: Risk and Return
42
© Pearson Education Limited 2008
ANSWERS TO QUESTIONS
1. Virtually none of the concepts presented would hold. Risk would not be a dimension of
concern to the risk-neutral investor. The only concern would be with expected return, and
2. The
characteristic line depicts the expected relationship between excess returns (in excess
3. Beta measures the responsiveness of changes in excess returns for the security involved to
changes in excess returns for the market portfolio. It tells us how attuned fluctuations in
4. Req. (Rj) = Rf + [E(Rm) – Rf] Betaj
Req. (Rj) = required rate of return for security j;
5. No. The security market line (SML) can vary with changes in interest rates, investor
6. a. Lower the market price.
7. If you limit yourself to only common stock, you would seek out defensive stocks — where
8. The undervalued stock would lie above the security market line, thereby providing investors
Van Horne and Wachowicz, Fundamentals of Financial Management, 13th edition, Instructor’s Manual
43
© Pearson Education Limited 2008
SOLUTIONS TO PROBLEMS
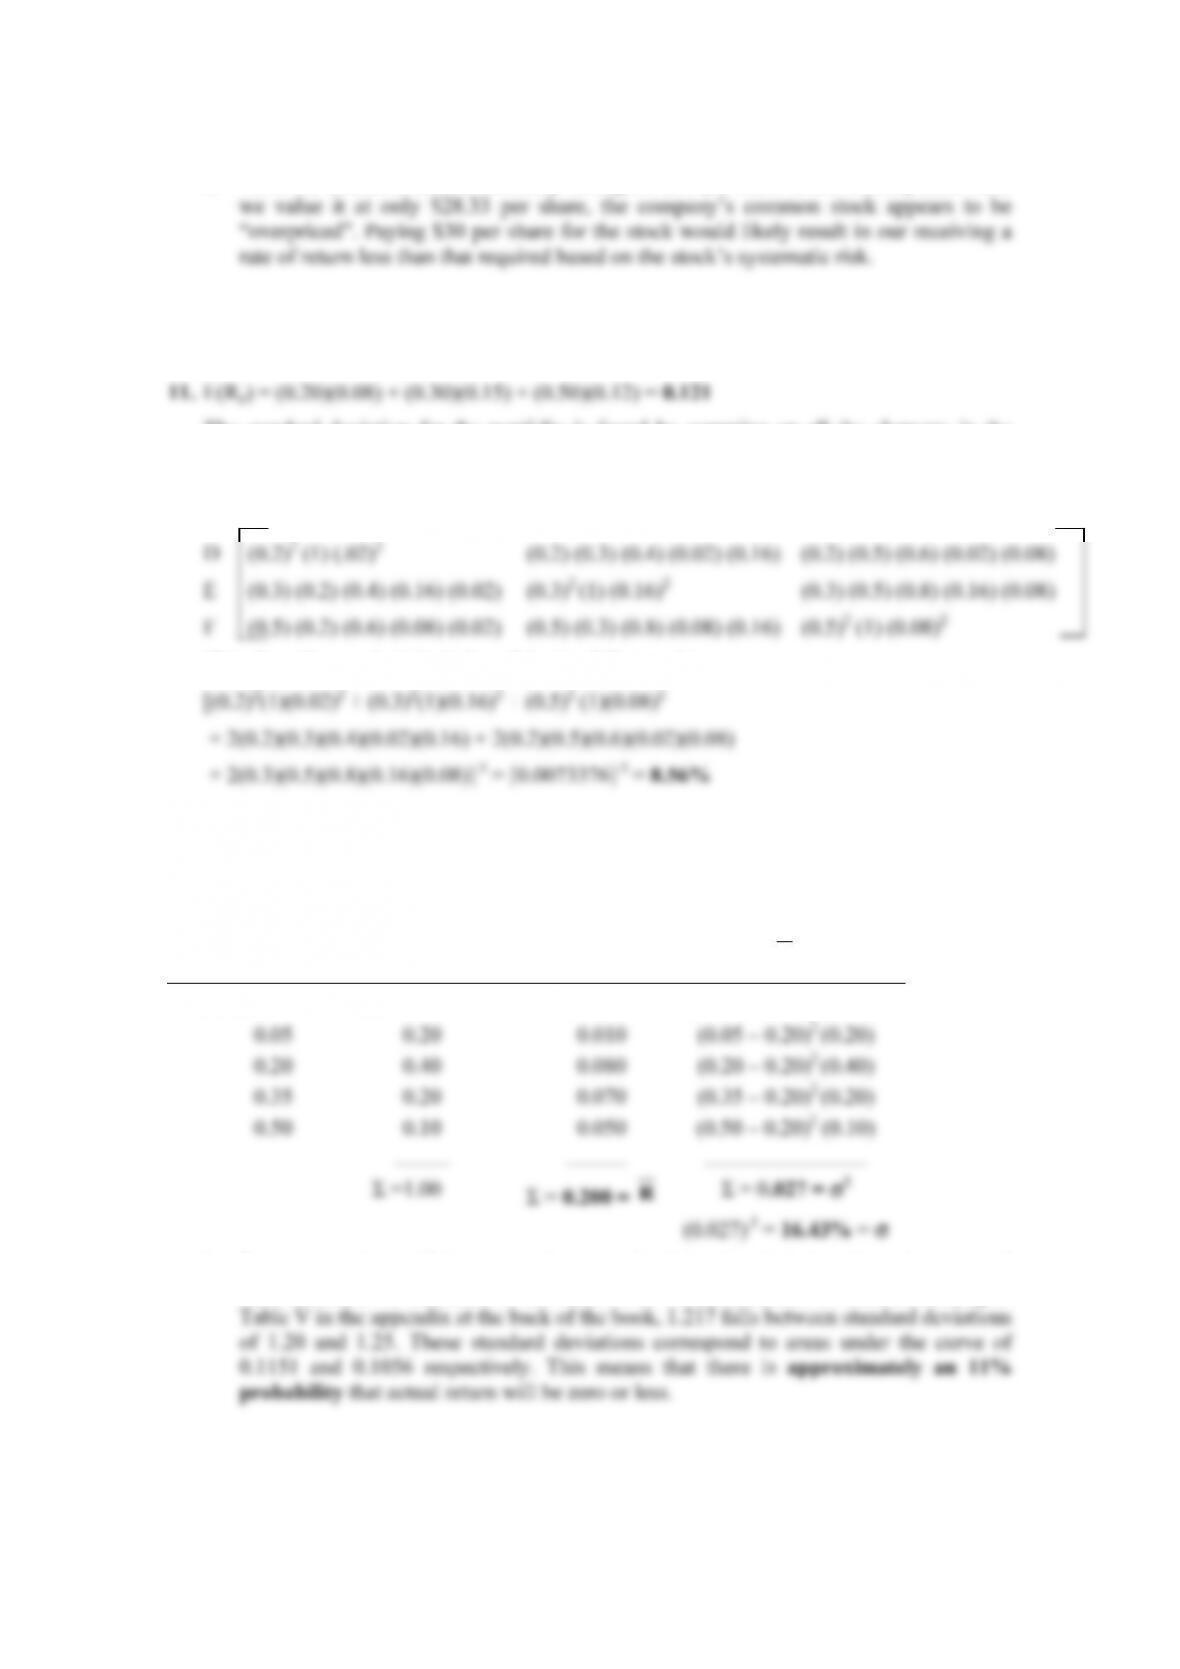
1. a.
Possible Return, Ri Probability of
Occurrence, Pi (Ri)(Pi) (Ri – R)2(Pi)
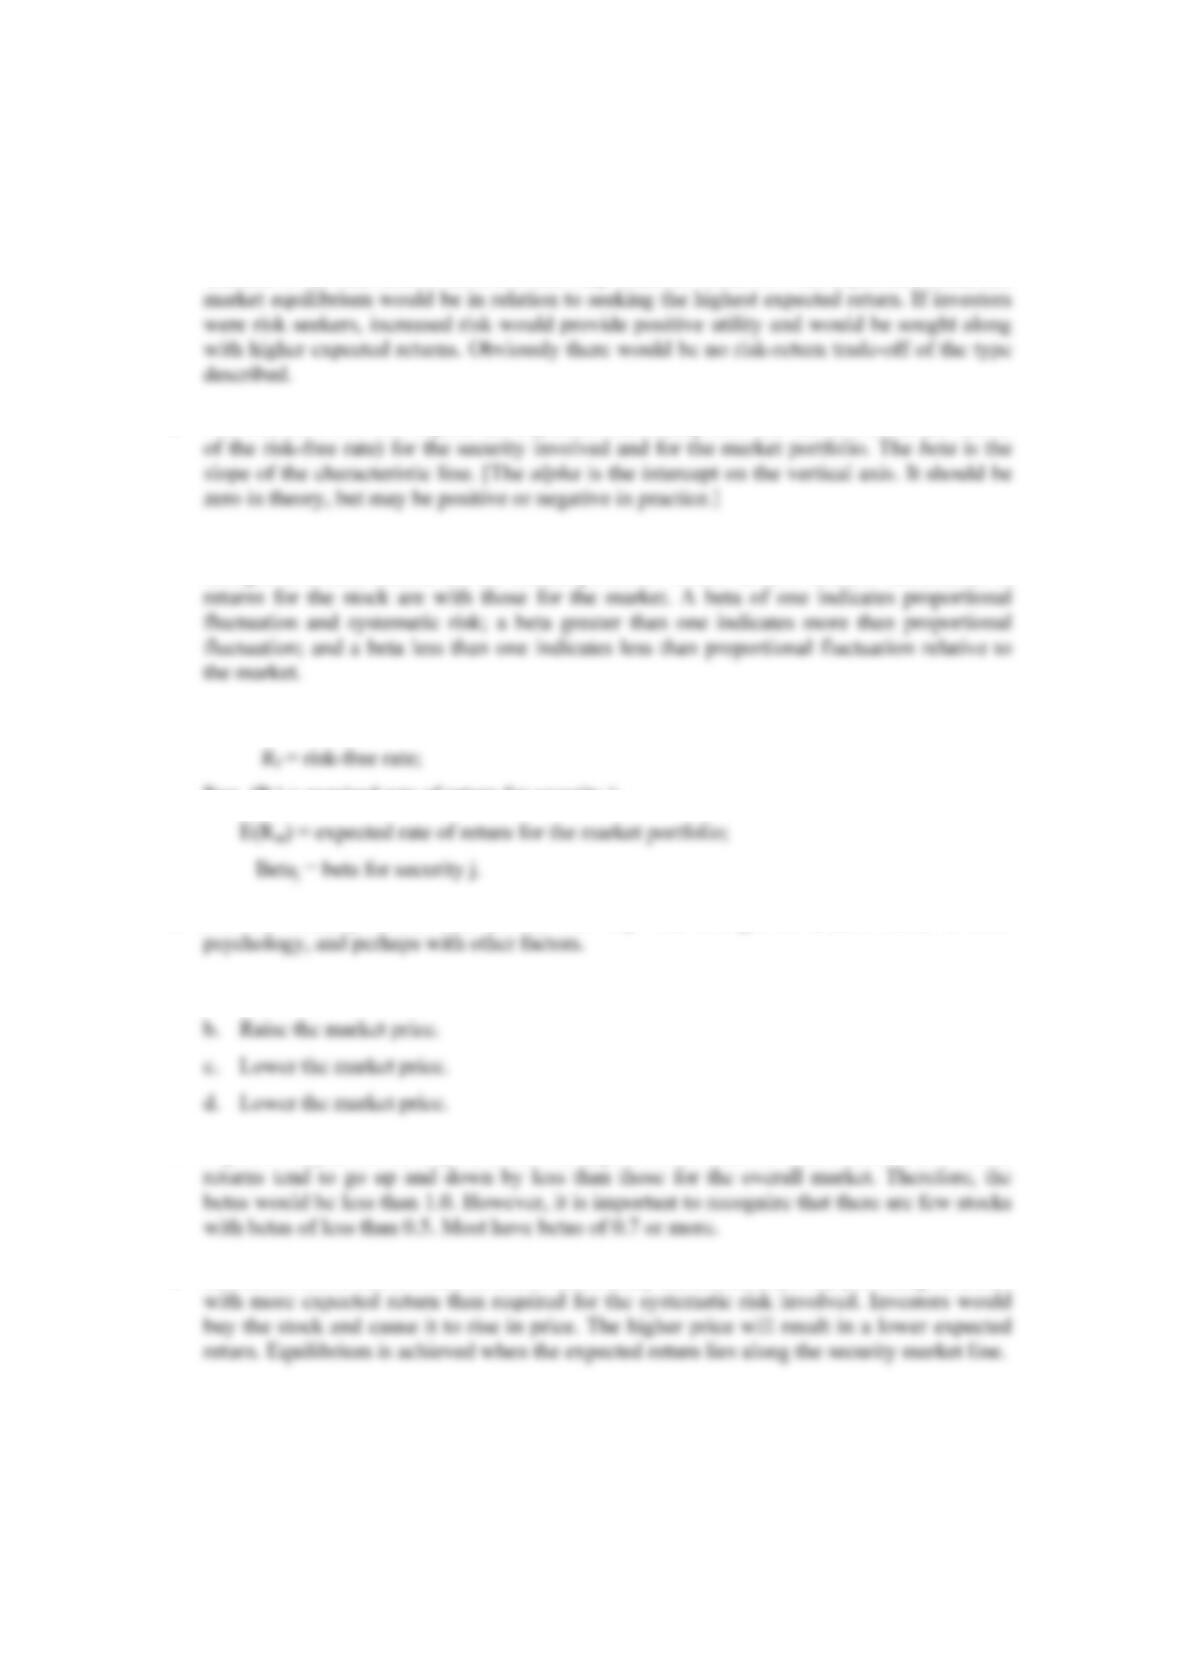
–.10 .10 –.10 (–0.10 – 0.11)2 (.10)
b. There is a 30 percent probability that the actual return will be zero (prob. E(R) = 0 is
2. a. For a return that will be zero or less, standardizing the deviation from the expected
value of return we obtain (0% – 20%)/15% = –1.333 standard deviations. Turning to
b. 10 percent:: Standardized deviation = (10% – 20%)/15% = –0.667. Probability of
20 percent:
50 percent probability of return being above 20 percent.
Chapter 5: Risk and Return
44
© Pearson Education Limited 2008
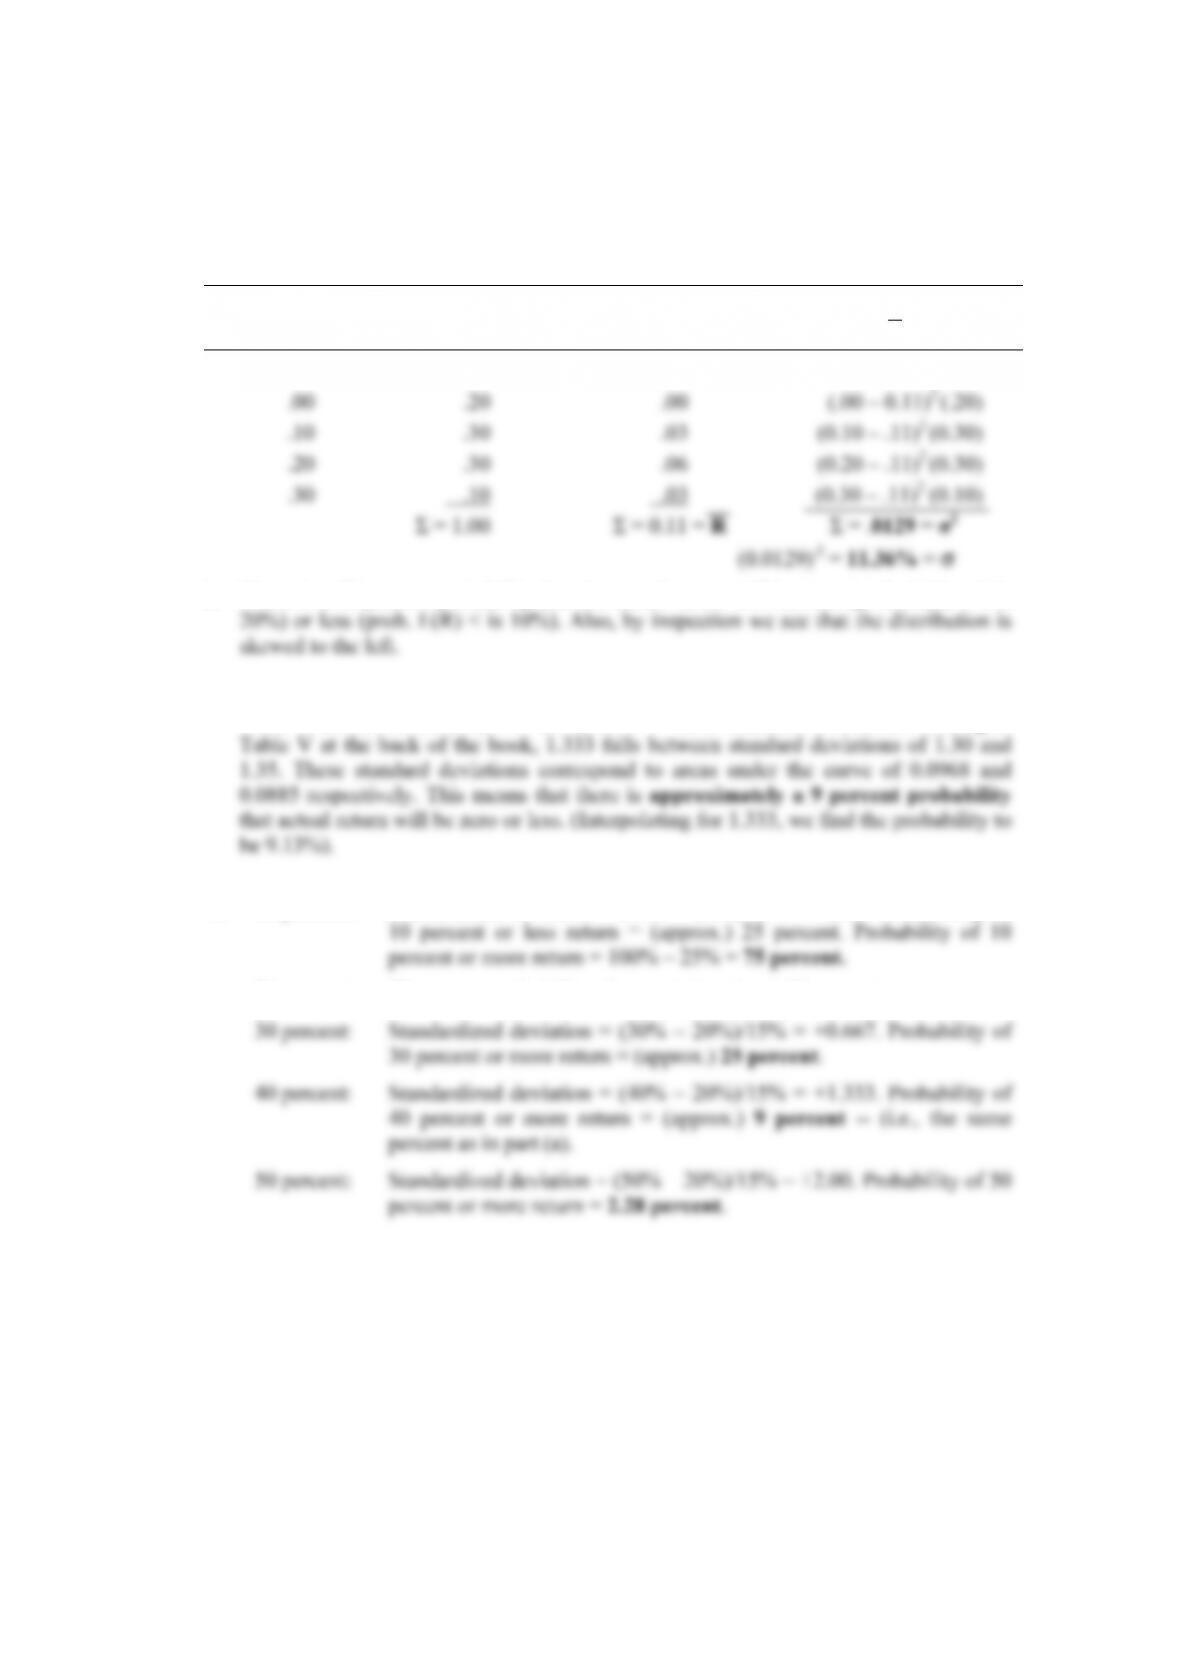
3. As the graph will be drawn by hand with the characteristic line fitted by eye, All of them
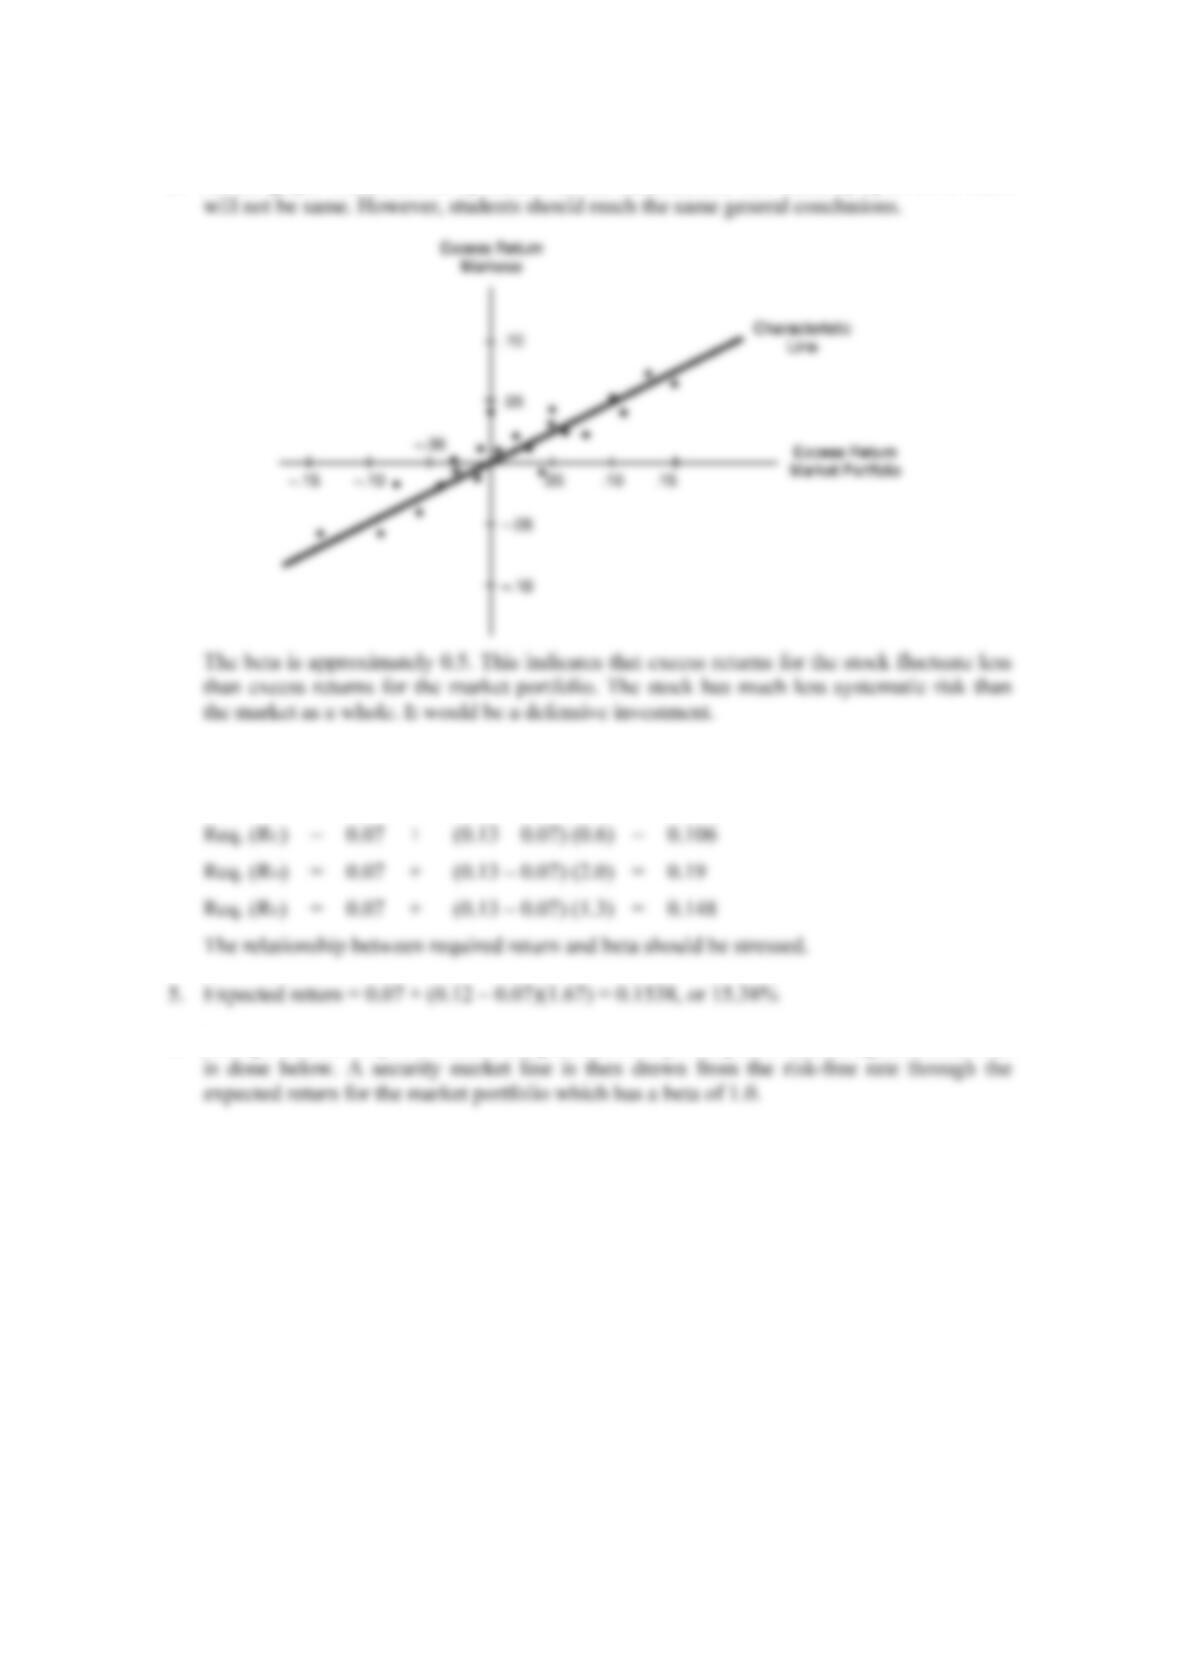
4. Req. (RA) = 0.07 + (0.13 – 0.07) (1.5) = 0.16
Req. (RB) = 0.07 + (0.13 – 0.07) (1.0) = 0.13
6. Perhaps the best way to visualize the problem is to plot expected returns against beta. This
Van Horne and Wachowicz, Fundamentals of Financial Management, 13th edition, Instructor’s Manual
45
© Pearson Education Limited 2008
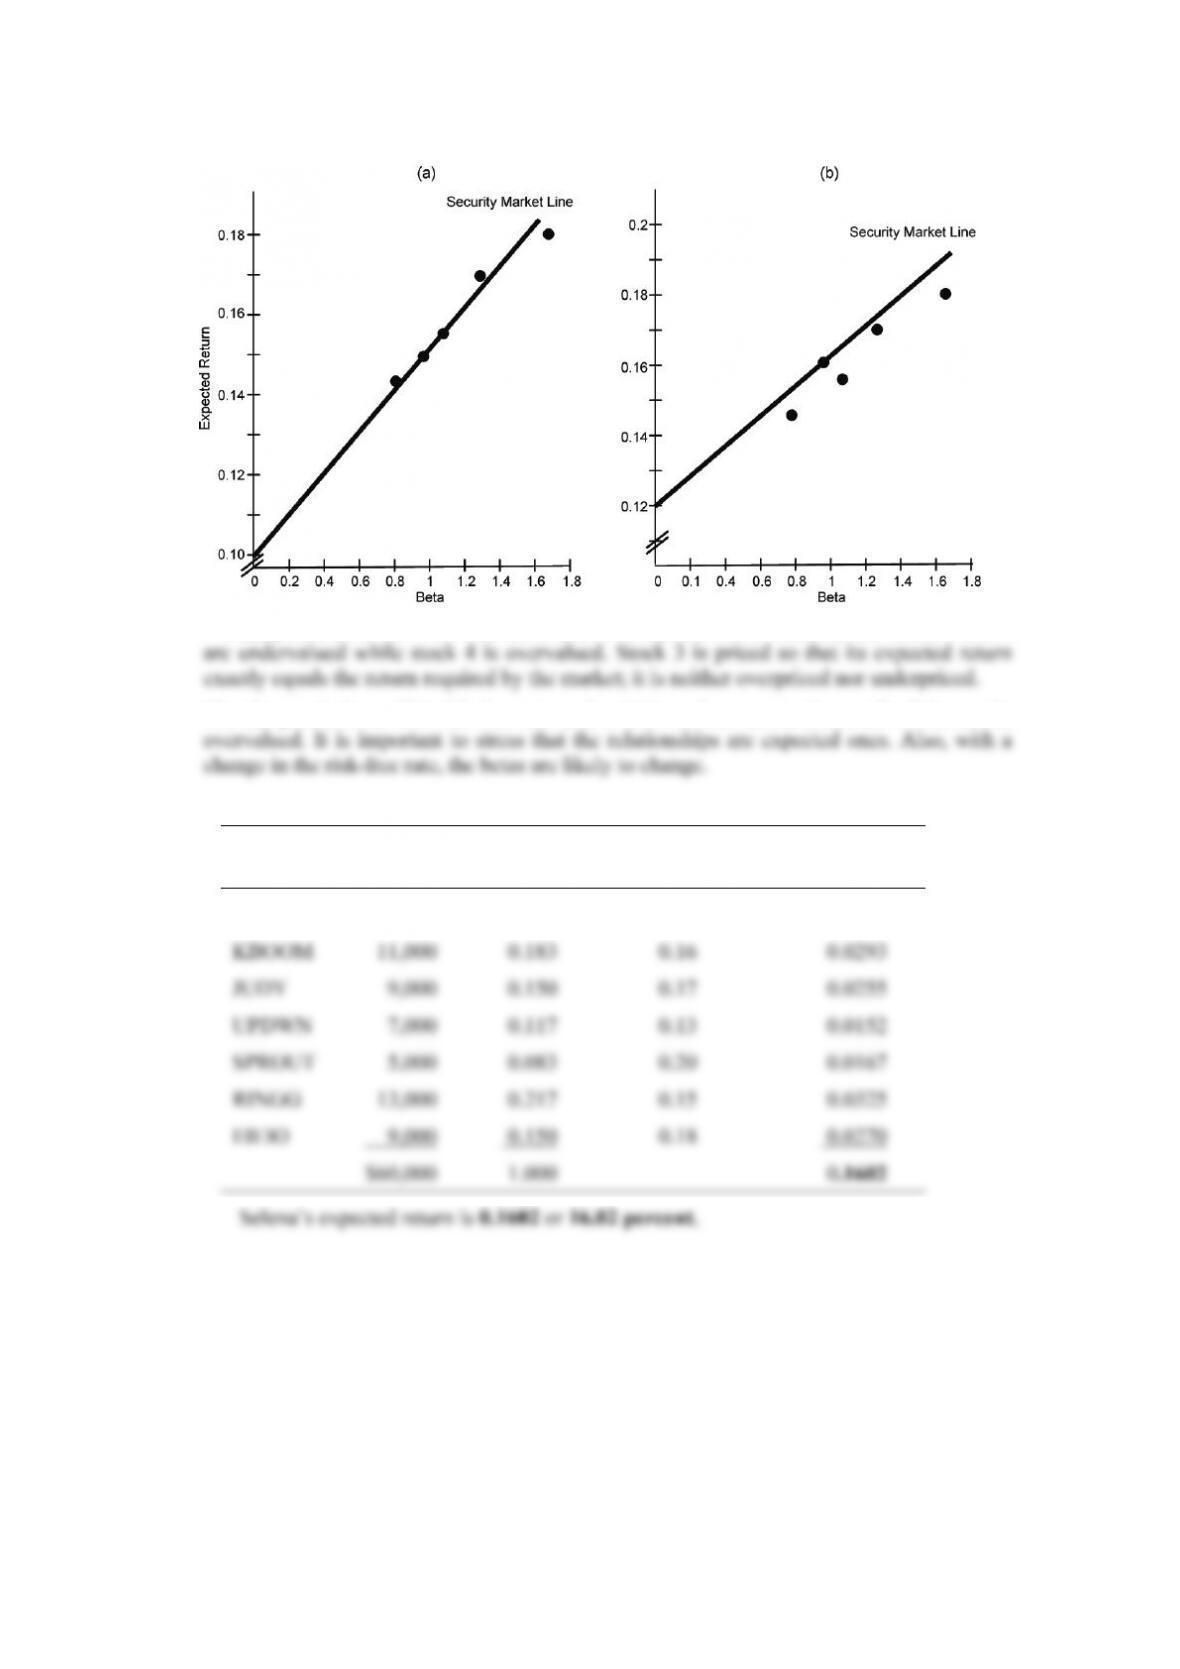
The (a) panel, for a 10% risk-free rate and a 15% market return, indicates that stocks 1 and 2
The (b) panel, for a 12% risk-free rate and a 16% market return, shows all of the stocks
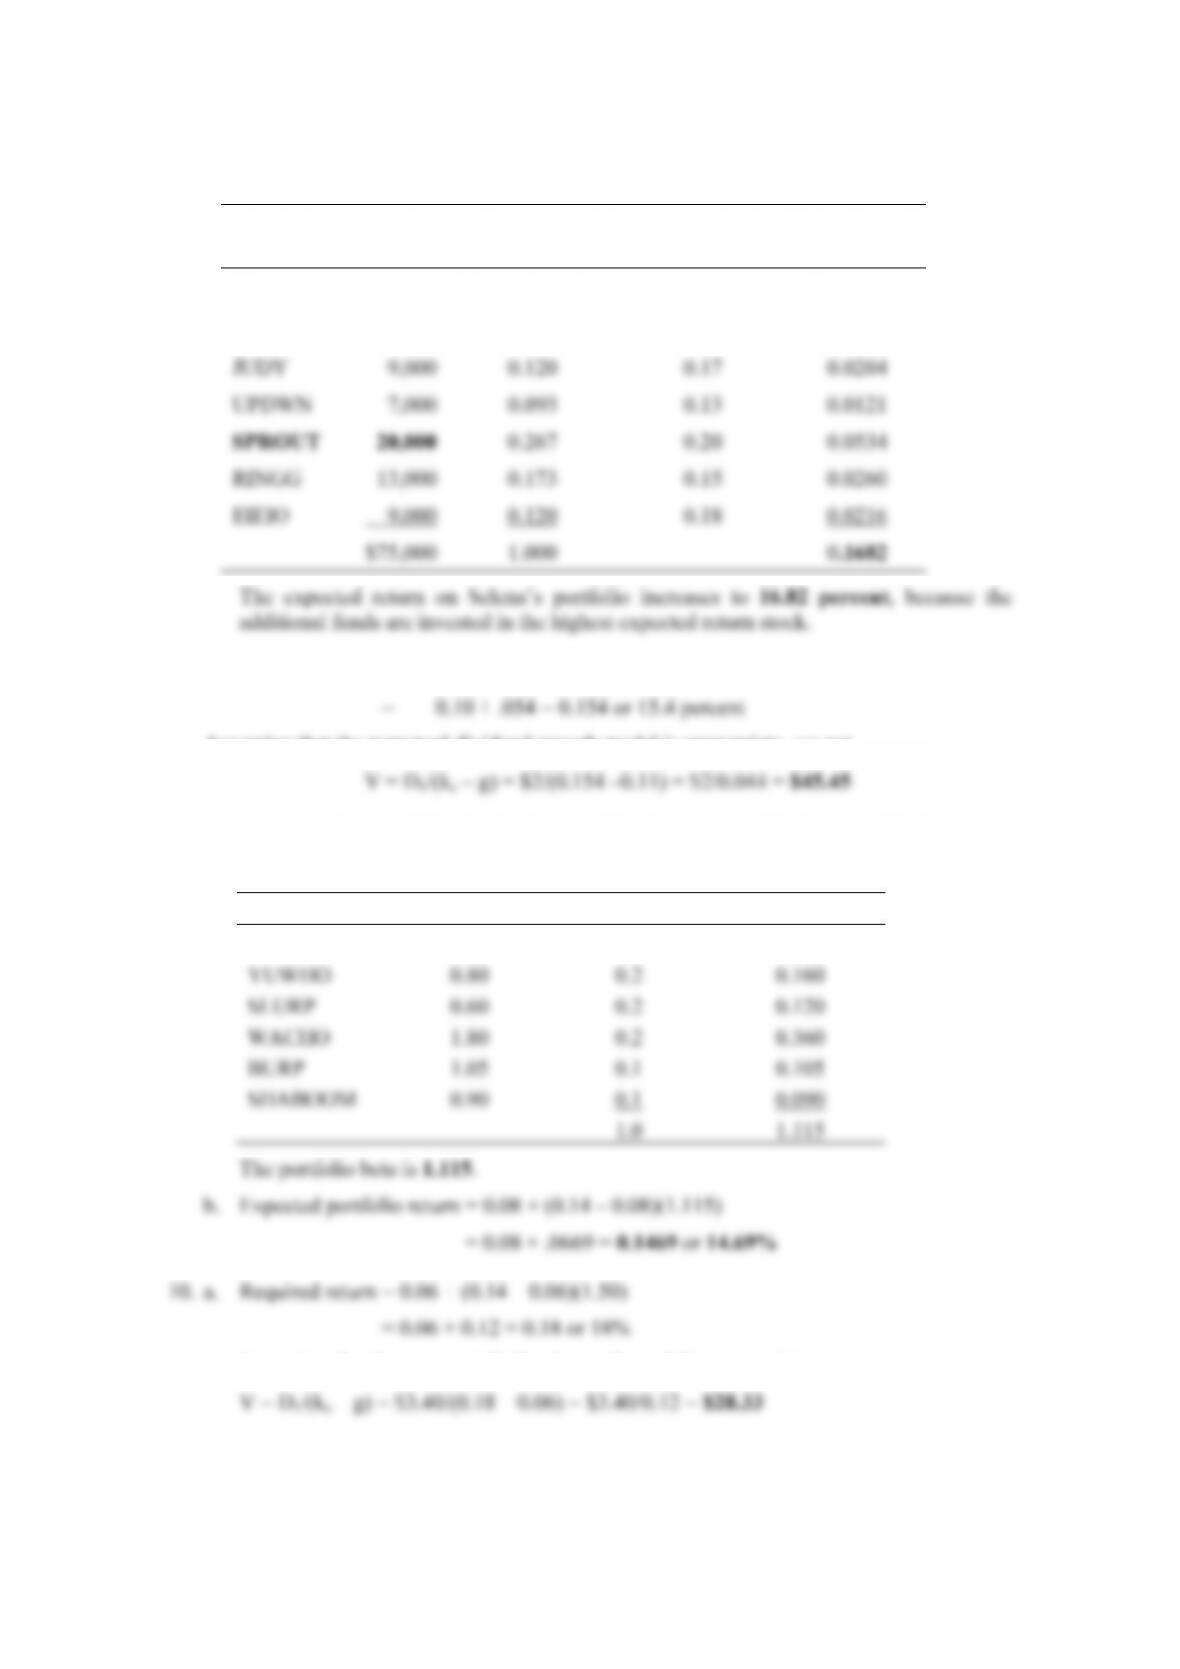
7. a.
Ticker
Symbol
Amount
Invested
Proportion,
Pi
Expected
Return, Ri
Weighted Return,
(Pi)(Ri)
WOOPS $ 6,000 0.100 0.14 0.0140
Chapter 5: Risk and Return
46
© Pearson Education Limited 2008
b.
Ticker
Symbol
Amount
Invested
Proportion,
Pi
Expected
Return, Ri
Weighted
Return, (Pi)(Ri)
WOOPS $6,000 0.08 0.14 0.0112
KBOOM 11,000 0.147 0.16 0.0235
8. Required return = 0.10 + (0.15 – .10)(1.08)
Assuming that the perpetual dividend growth model is appropriate, we get
9. a. The beta of a portfolio is simply a weighted average of the betas of the individual
securities that make up the portfolio.
Ticker Symbol Beta Proportion Weighted Beta
NBS 1.40 0.2 0.280
Assuming that the constant dividend growth model is appropriate, we get
Van Horne and Wachowicz, Fundamentals of Financial Management, 13th edition, Instructor’s Manual
47
© Pearson Education Limited 2008
b. Since the common stock is currently selling for $30 per share in the marketplace, while
Solution to Appendix A Problem:
The standard deviation for the portfolio is found by summing up all the elements in the
following variance-covariance matrix and then taking the sum’s square root.
D E F
Therefore, the standard deviation of the portfolio equals:
SOLUTIONS TO SELF-CORRECTION PROBLEMS
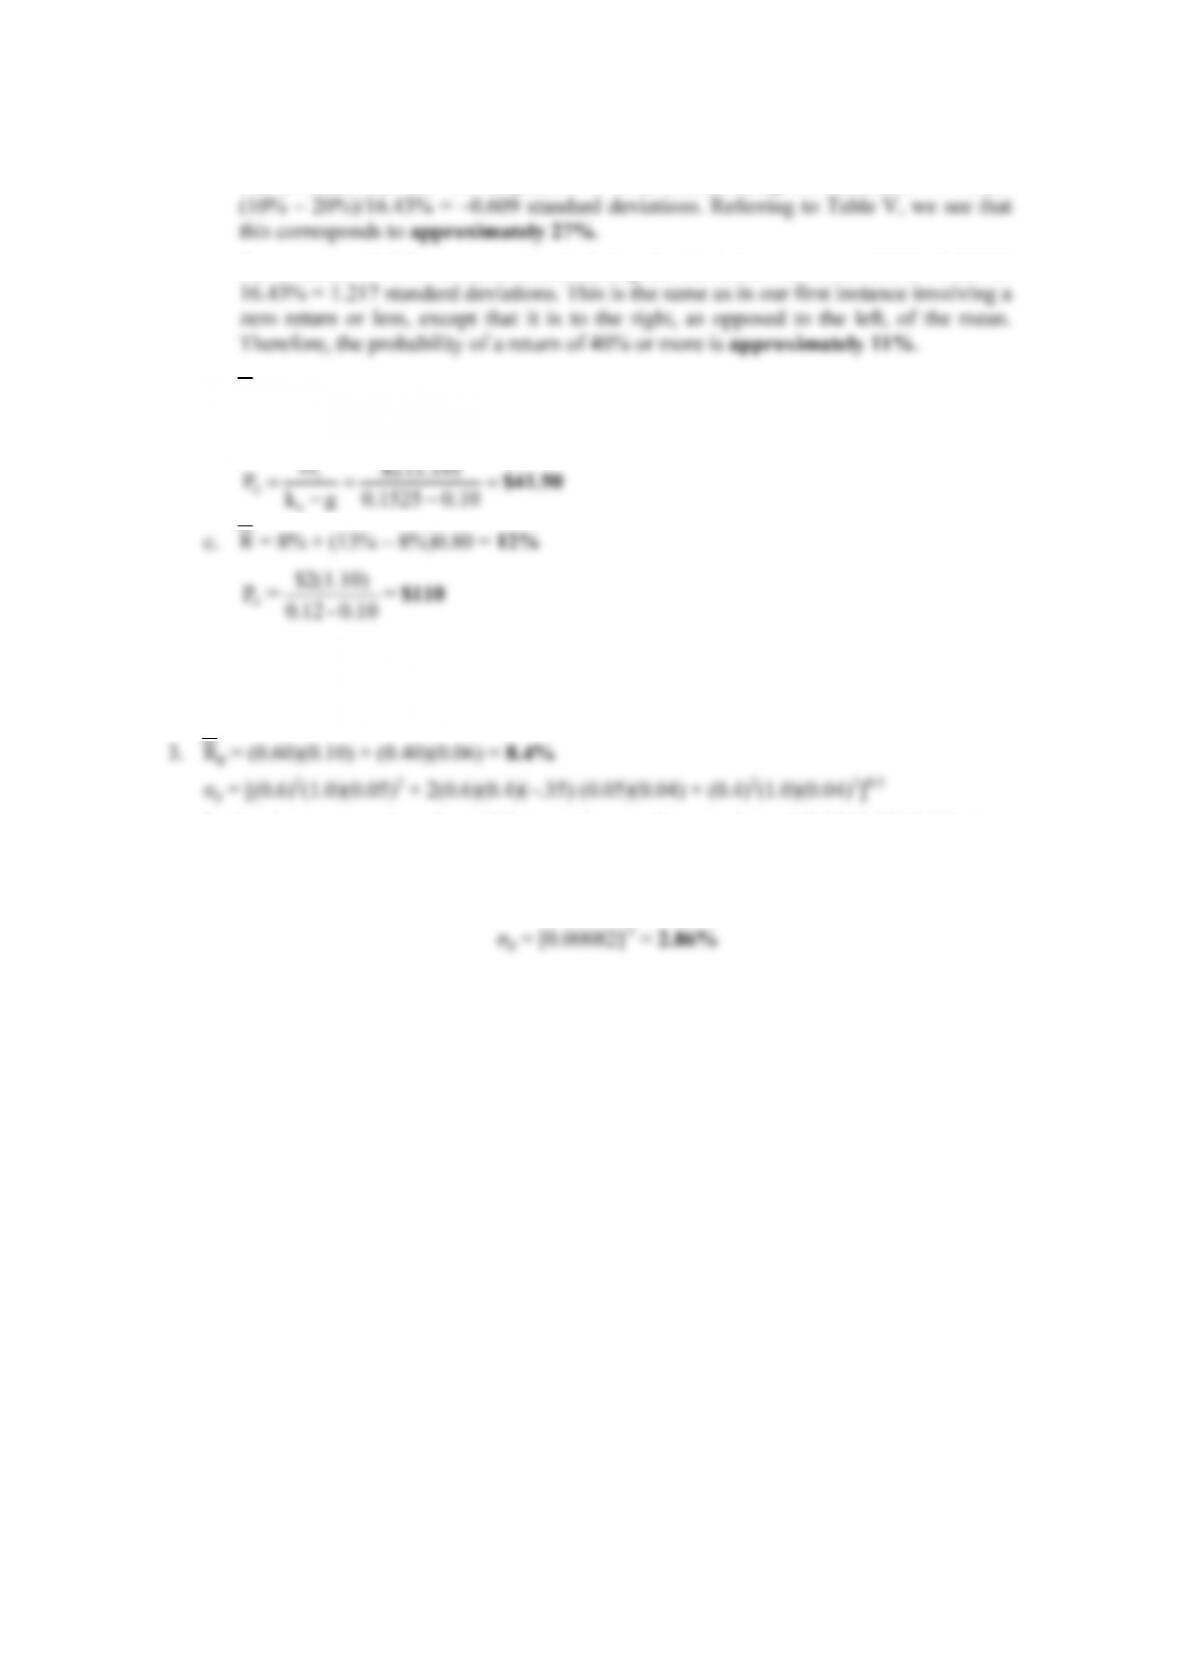
1. a.
Possible
Return, Ri
Probability of
Occurrence, Pi (Ri)(Pi) 2
ii
(R R) (P )−
–0.10 0.10 –0.010 (–0.10 –0.20)2 (0.10)
b. For a return that will be zero or less, standardizing the deviation from the expected
value of return we obtain (0% – 20%)/16.43% = –1.217 standard deviations. Turning to
Chapter 5: Risk and Return
48
© Pearson Education Limited 2008
For a return that will be 10 percent or less, standardizing the deviation we obtain
For a return of 40% or more, standardizing the deviation we obtain (40% –0 20%)/
2. a. R= 8% + (13% – 8%)1.45 = 15.25%
b. If we use the perpetual dividend growth model, we would have
1
0
e
D$2 (1.10)
−−
SOLUTION TO APPENDIX A SELF-CORRECTION PROBLEM
In the above expression, the middle term denotes the covariance (–0.35)(0.05)(0.04) times
the weights of .6 and .4, all of which is counted twice — hence the two in front. For the first
and last terms, the correlation coefficients for these weighted-variance terms are 1.0. This
expression reduces to