Chapter 8: Measuring Life-Cycle Costs
– 307 –
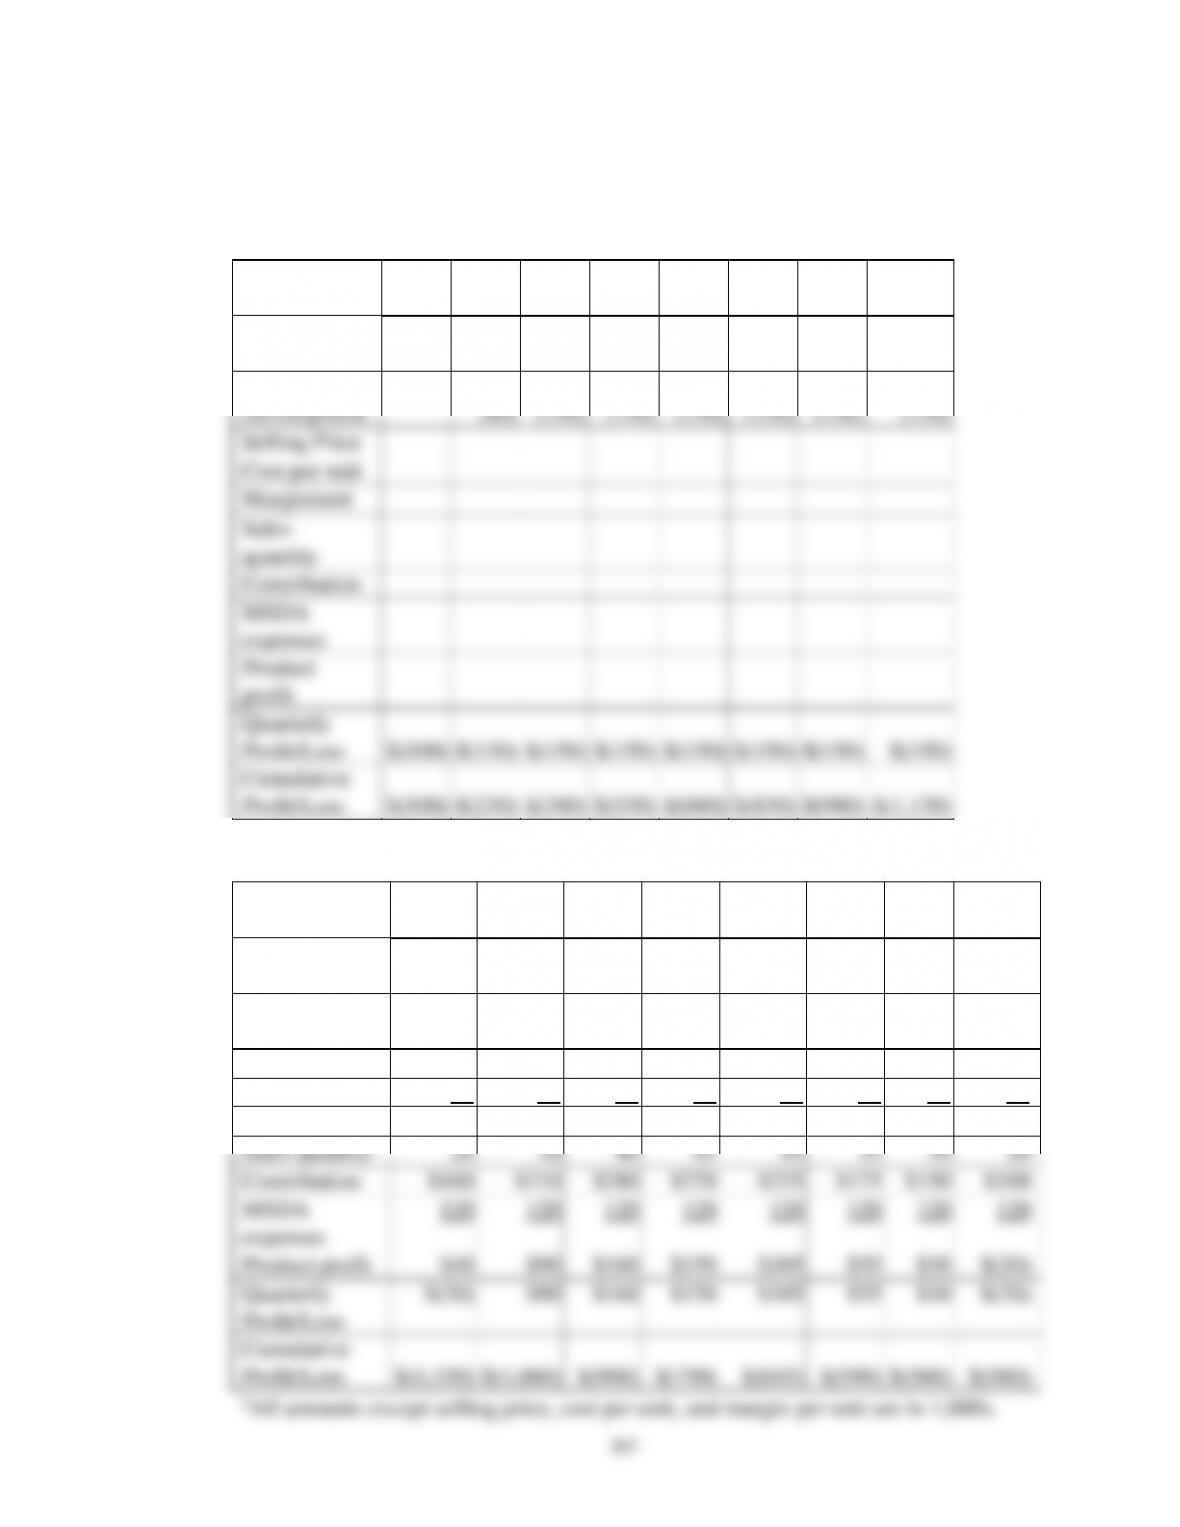
8-33 As shown below, Greyson will now never reach a break-even time.
Beginning with Y4, Q4, Greyson will incur quarterly losses of $20,000 and
will never show a positive cumulative profit.
(000)
Y1,
Q1
Y1,
Q2
Y1,
Q3
Y1,
Q4
Y2,
Q1
Y2,
Q2
Y2,
Q3
Y2,
Q4
Market
Research
$(100)
$(50)
Product
Development
(80)
(150)
(150)
(150)
(150)
(150)
(150)
Selling Price
Cost per unit
Margin/unit
Sales
quantity
Contribution
MSDA
expenses
Product
profit
Quarterly
Profit/Loss
$(100)
$(130)
$(150)
$(150)
$(150)
$(150)
$(150)
$(150)
Cumulative
Profit/Loss
$(100)
$(230)
$(380)
$(530)
$(680)
$(830)
$(980)
$(1,130)
(000)a
Y3,
Q1
Y3,
Q2
Y3,
Q3
Y3,
Q4
Y4,
Q1
Y4,
Q2
Y4,
Q3
Y4,
Q4
Market
Research
Product
Development
$(60)
Selling Price
$18
$17
$17
$16
$15
$15
$15
$15
Cost per unit
10
10
10
10
10
10
10
10
Margin/unit
$8
$7
$7
$6
$5
$5
$5
$5
Sales quantity
20
30
40
45
45
35
30
20
Contribution
$160
$210
$280
$270
$225
$175
$150
$100
MSDA
expenses
120
120
120
120
120
120
120
120
Product profit
$40
$90
$160
$150
$105
$55
$30
$(20)
Quarterly
Profit/Loss
$(20)
$90
$160
$150
$105
$55
$30
$(20)
Cumulative
Profit/Loss
$(1,150)
$(1,060)
$(900)
$(750)
$(645)
$(590)
$(560)
$(580)
aAll amounts except selling price, cost per unit, and margin per unit are in 1,000s.
– 308 –
8-34 To use activity–based costing to help control and reduce environmental costs,
the activities that cause environmental costs must be identified. Next, the costs
associated with the activities must be determined. These costs must then be
Environmental costs include explicit costs, such as the direct costs of
modifying technology and processes, costs of cleanup and disposal, costs
for permits to operate a facility, fines levied by government agencies and
litigation fees. Implicit environmental costs are often more closely tied to
PROBLEMS
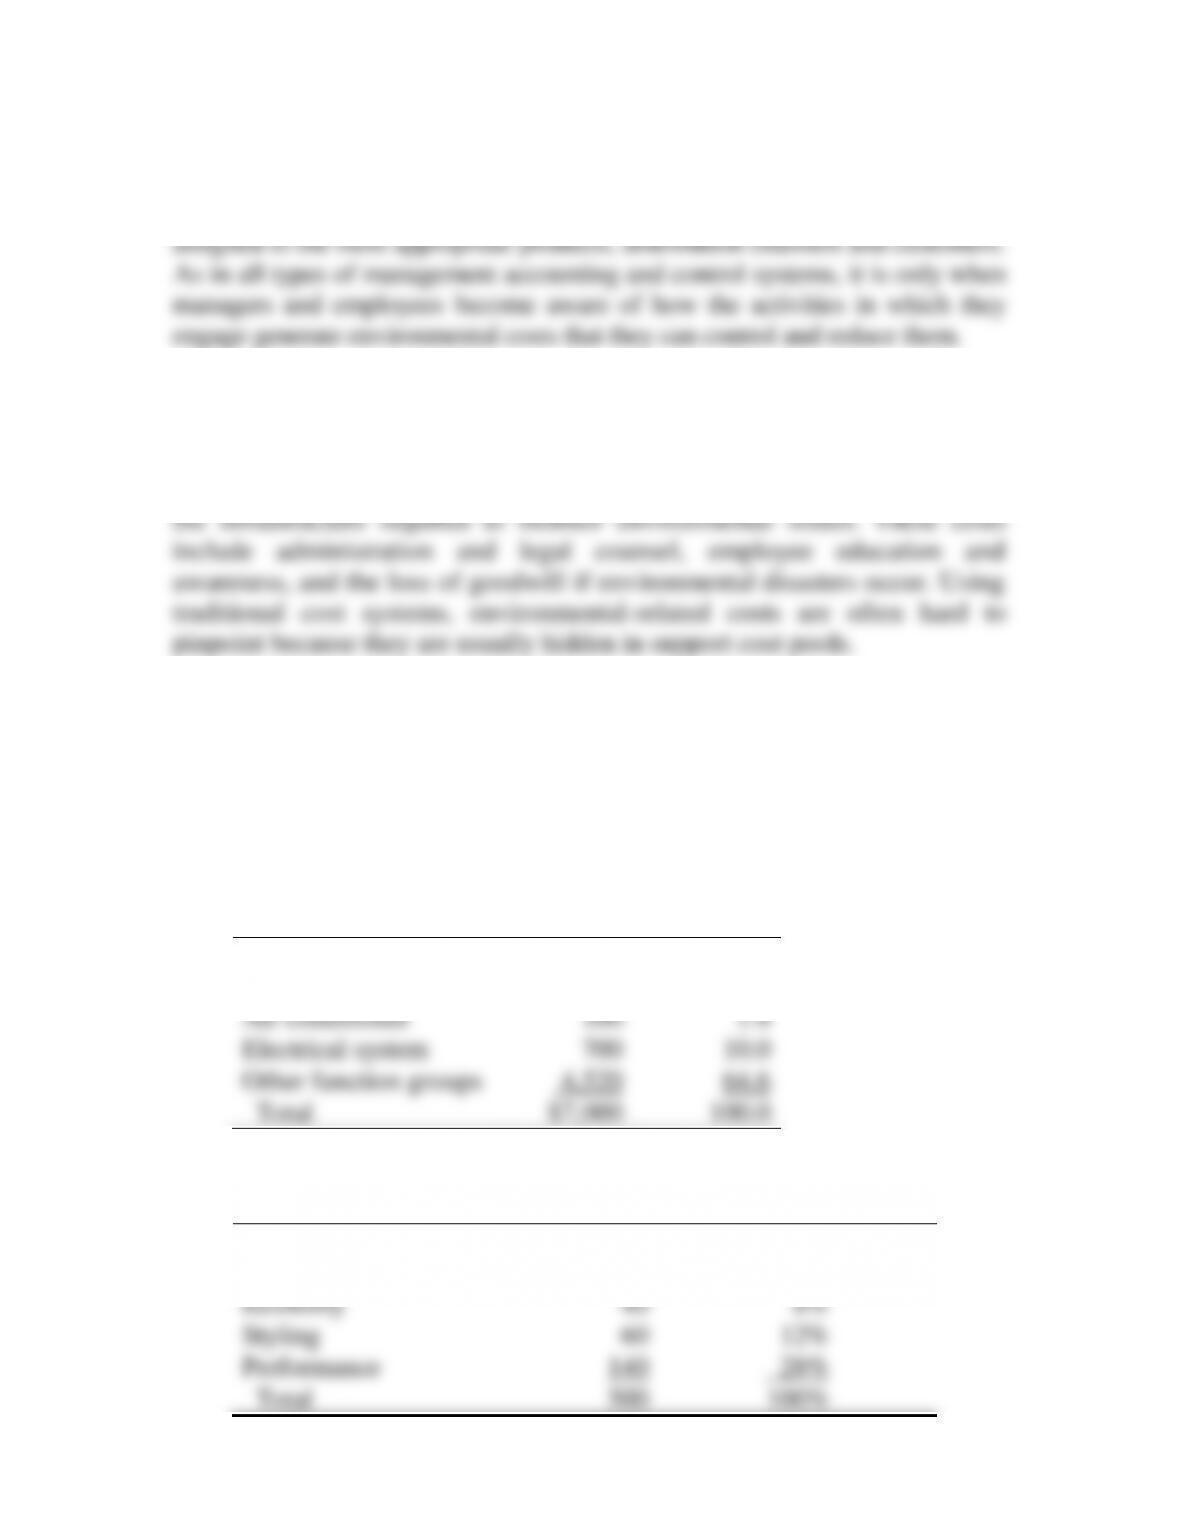
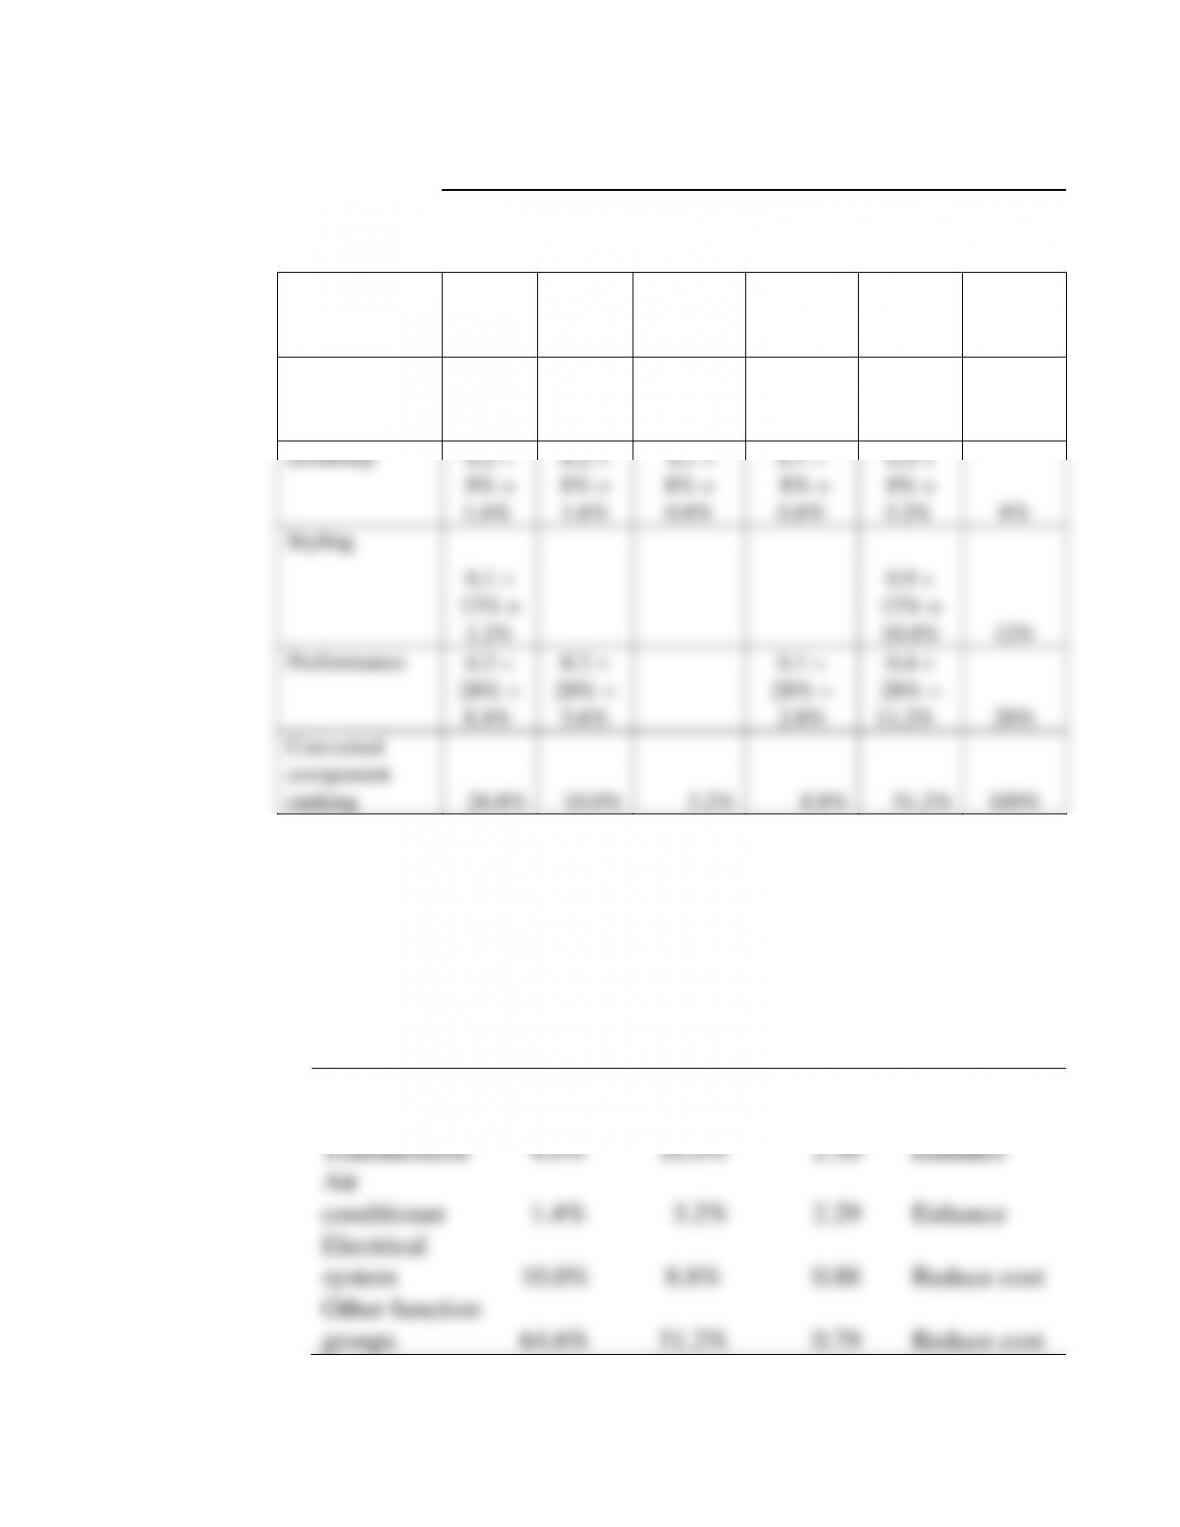
8-35 (a) To prepare an exhibit similar to Exhibit 8-9, first compute the relative
cost percents illustrated in Exhibit 8-6 and the relative rankings
illustrated in Exhibit 8-7.
Function Group
Target
Cost
Percent
of Cost
Chassis
$1,400
20.0
Transmission
280
4.0
Air conditioner
100
1.4
Electrical system
700
10.0
Other function groups
4,520
64.6
Total
$7,000
100.0
Customer Requirements
Importance
Relative Ranking in
Percent
Safety
140
28%
Comfort and convenience
120
24%
Economy
40
8%
Styling
60
12%
Performance
140
28%
Total
500
100%
Chapter 8: Measuring Life-Cycle Costs
– 309 –
Function Group
Customer
Requirements
Chassis
Trans-
mission
Air
Condi-
tioner
Electrical
System
Other
Function
Groups
Relative
Feature
Ranking
Safety
0.3
28% =
8.4%
0.1
28% =
2.8%
0.1
28% =
2.8%
0.5
28% =
14%
28%
Comfort and
convenience
0.3
24% =
7.2%
0.1
24% =
2.4%
0.1
24% =
2.4%
0.5
24% =
12%
24%
Economy
0.2
8% =
1.6%
0.2
8% =
1.6%
0.1
8% =
0.8%
0.1
8% =
0.8%
0.4
8% =
3.2%
8%
Styling
0.1
12% =
1.2%
0.9
12% =
10.8%
12%
Performance
0.3
28% =
8.4%
0.2
28% =
5.6%
0.1
28% =
2.8%
0.4
28% =
11.2%
28%
Converted
component
ranking
26.8%
10.0%
3.2%
8.8%
51.2%
100%
(b) The value index is a benefit/cost ratio, obtained by dividing the
relative importance in column (3) by the associated relative cost
column (2).
(2)
(3)
(3) (2)
Function
Relative
Value
Action
Group
Cost
Importance
Index
Implied
Chassis
20.0%
26.8%
1.34
Enhance
Transmission
4.0%
10.0%
2.50
Enhance
Air
conditioner
1.4%
3.2%
2.29
Enhance
Electrical
system
10.0%
8.8%
0.88
Reduce cost
Other function
groups
64.6%
51.2%
0.79
Reduce cost
Atkinson, Solution Manual t/a Management Accounting, 6E
– 310 –
8-36 The traditional focus of cost management has been only on manufacturing
processes. Under this approach, pre-manufacturing costs, such as research
and development, and post-manufacturing costs, such as service, are
considered period costs, and companies expense them in the period
incurred. Thus, these costs are in no way linked to individual products.
Understanding the total life cycle costs (TLCC) of a product or service, or
the product costs incurred before, during, and after the manufacturing cycle
is critical, as decision makers can more completely analyze and understand
what creates product costs. For example, if a company can reduce a
8-37 Gregoire Grant is shortsighted. The manufacturing cycle of the total-life-
cycle costing approach is only one of three major stages of the product life
fashion. For example, poor decisions in the research development and
engineering stage may lead to much higher costs in the manufacturing and

Chapter 8: Measuring Life-Cycle Costs
– 311 –
to understanding the importance of the TLCC perspective is management
Target sales (500,000 calculators $75)
$37,500,000
Less: Target profit (15% $75/calculator 500,000
calculators)
5,625,000
Target cost for 500,000 calculators
$31,875,000
Unit target cost ($31,875,000/500,000 calculators)
$ 63.75
determine Bill’s profit margin:
Sales (300,000 units $500) $150,000,000
a good or poor job will involve determining the extent to which Bill could
control cost, and evaluating Bill’s judgment in setting prices.
8-40 Some studies of target costing in Japan indicate that there are potential
– 312 –
(1) Senior executives and workers may reject target costing. Education
about the benefits of target costing should be provided in order to
Since they work very hard to squeeze pennies out of the cost of a
product, they think that other parts of the organization
approach and using cross-functional teams will help the organization
to this end.
(3) Employees in many Japanese companies working under target costing
This issue can be addressed by making target-costing goals tight, but
attainable. Often organizations make the mistake of setting
impossible goals. Design engineers also often fear that if they make
the target, in the next period, the target will be “ratcheted up” and
Chapter 8: Measuring Life-Cycle Costs
– 313 –
(4) While the target cost may be met, there may be increased
This is a very serious problem for the organization. Clearly, there is a
tradeoff between continuing to reduce target costs and being very late
to market. However, on average, many months of lost sales will have
a much more detrimental effect on the organization than whether
new products.
8-41 There are some similarities between traditional cost reduction and target
costing, but the differences are more striking. Both the traditional costing
method and target costing begin with market research into customer
subtracting the estimated cost from the expected selling price. Profit margin is
the result of the difference between the expected selling price and the estimated
Under target costing, after market research to determine customer
requirements and product specification, the process is quite different. The
next step, determining a target selling price and target product volume,
depends on the company’s perceived value of the product to the customer.
Once the target cost is set, the company must determine target costs for each
component. The value engineering process includes examination of each
component of a product to determine whether it is possible to reduce costs
while maintaining functionality and performance. In some cases, product
– 314 –
8-42 Bringing in outside consultants to implement a target costing system can be
effective, but costly. Consultants often have a great deal of knowledge that
they can bring to an organization and in this sense the organization does not
have to “start from scratch.” A downside of using consultants is that, in
implementation of a target costing system will increase significantly.
A second downside is that many organizational members may not be
involved with implementing the changes. Thus, they may simply rely on
likely fail after the consultants leave.
A second approach is for organizational members to develop a target
costing system internally with little or no assistance from outside
consultants. This approach can be satisfying, but it can be costly and time-
regarding the implementation of other organizational innovations.
The third approach, known as benchmarking, requires that organizational
members first understand their current cost reduction methods and then look
Chapter 8: Measuring Life-Cycle Costs
– 315 –
organizations to gain insights on target costing from others, but at the same
time to assume responsibility for the changes. In this way, organizational
8-43 The answer to this question is very similar to the solution for 8-41 but it is
more detailed. The process involved in traditional cost reduction as
practiced in the United States is significantly different from target costing.
design, they estimate product cost
Ct
, where the t subscript indicates
numbers derived under a traditional, sequential design and development
margin
P
t
, it is necessary to subtract the estimated cost from the expected
t t t
S C P
cp cp cp
. As in the first traditional method described above, product
designers do not attempt to achieve a particular cost target.
selling price
Stc
and target product volume, depends on the company’s
perceived value of the product to the customer. The target profit margin
can be linked most closely to profitability for each product. The target cost
Ctc
is the difference between the target selling price and the target profit