
– 297 –
Chapter 8
Measuring Life-Cycle
Costs
QUESTIONS
8-1 The total–life-cycle costing approach is a comprehensive way for managers to
understand and manage costs through a product’s design, development,
manufacturing, marketing, distribution, maintenance, service, and disposal
8-2 The three major stages of the total-life-cycle costing approach are (1)
8-3 Committed costs are those that the organization agrees must be set aside
8-4 The three substages of the RD&E stage are (1) using market research to
assess emerging customer needs that lead to idea generation for new
8-5 During the post-sale service and disposal stage, organizations have to
consider both the costs involved in providing service to products as soon as
they are in the hands of customers, as well as the costs of ultimately
disposing of the product. The following three substages typically occur
during this stage: (1) rapid growth from the first time the product is shipped
Atkinson, Solution Manual t/a Management Accounting, 6E
– 298 –
8-6 Target costing is a method of profit planning and cost reduction that focuses
on reducing costs for products in the research, development and engineering
8-7 The two essential financial elements needed to arrive at a target cost are the
8-8 For product development and target costing purposes, customers’ needs or
requirements must be translated into product functions or components for
engineering. A quality function deployment matrix relates information about
customer requirements (that is, features that customers require) to a
product’s functions or components. The matrix may also include a
maintainability, quality, safety, recyclability, and usability.
8-10 Target costing is most applicable during the research, development and
engineering (RD&E) stage of the total life cycle of a product.
Chapter 8: Measuring Life-Cycle Costs
– 299 –
engineering, manufacturing, management accounting, and marketing areas,
as well as representatives from among suppliers, customers, distributors,
and waste disposers. Supply chain management, which involves
developing cooperative, mutually beneficial long-term relations between
8-12 The break-even time (BET) metric for the product development process
measures the length of time from the project’s beginning until the product
Second, BET stresses profitability. It encourages marketing managers,
manufacturing personnel, and design engineers to work together to develop
a product that meets real customer needs, including offering the product
through an effective sales channel at an attractive price, and at a
investment.
8-14 Desirable behavioral consequences that are likely as people focus on
improving the break-even time (BET) metric include collaboration and
integration across organizational functions. People from different
project, customers, and competitors becomes available.
8-15 Using percent of revenues from new products as a performance metric may
fail to stimulate highly innovative products because this metric can lead
product developers to introduce new products that are small variations of
– 300 –
8-16 Nonfinancial measures that a company might use in order to motivate
based on customer input.
8-17 Nonfinancial measures that a company might use in order to motivate
achieving the objective of reducing product development cycle time across
an array of products include (1) number of projects delivered on time, (2)
8-18 Activities included in environmental costing include selecting suppliers
whose philosophy and practice in dealing with the environment match those
and the loss of goodwill if environmental disasters occur.
EXERCISES
cycle.
8-21 The benefits of using a total-life-cycle costing approach to product costing
include providing managers with the “big picture” of managing costs over
the research development and engineering; manufacturing; and post-sale
Chapter 8: Measuring Life-Cycle Costs
– 301 –
opportunity to see how decisions made in one stage affect costs throughout
the entire product life cycle. This perspective is not possible under the
8-22 The traditional accounting focus in managing costs is on the manufacturing
stage of the total life cycle of a product. The most significant problem with
this focus is that the traditional method ignores product costs before
manufacturing (in the research, development and engineering (RD&E)
8-23 Exhibit 8-2 illustrates the relationship between costs committed and costs
incurred over the total life cycle of a product. The top curve, “cost
committed,” shows how a very large percentage (80–85%) of product life
cycle costs are assigned or committed to by an organization during the pre–
research, development and engineering stage, but these costs increase
significantly during the manufacturing and post-sale service and disposal
8-24 The disposal phase of the post-sale service and disposal stage of a product
begins when the first unit of product is retired by the customer and ends
when the last unit of product is retired by the customer. Disposal costs are
8-25 Target costing differs from traditional cost reduction methods through the
process by which costs are determined. Under traditional cost reduction,
after market research to determine customer requirements and product
specification, engineers and designers determine product design, then the
– 302 –
Target costing begins in approximately the same way with market research
under traditional cost-reduction methods, which focus on cost reduction at
the manufacturing stage. In contrast, target costing focuses on cost
reduction at the RD&E stage. Target costing uses the total life cycle costing
concept to focus on cost of ownership over the product’s life. In addition,
8-26 The relationship between value engineering and target costing is as follows:
Once a target cost has been set, the organization must determine target costs
8-28 Some of the potential problems in implementing a target costing system
from a behavioral point of view are: (a) conflicts that arise between parties
involved in the target costing process, (e.g., the conflict that arises between
suppliers and the target costing organization when too much pressure is
understand its value.
8-29 A manager asked to benchmark another organization’s target costing system
would want information pertaining to the method by which target prices and
target margins (and consequently, target costs) are set, supplier relations,

Chapter 8: Measuring Life-Cycle Costs
– 303 –
target costing always has to be studied and understood in relation to the
specific organization involved.
C S P
, where C is the target cost, S is the target selling price, and P is
the target profit margin. This equation differs from the other two types of
traditional equations relating to cost reduction in the following ways. The
first traditional cost reduction method is expressed as follows:
P S C
.
– 304 –
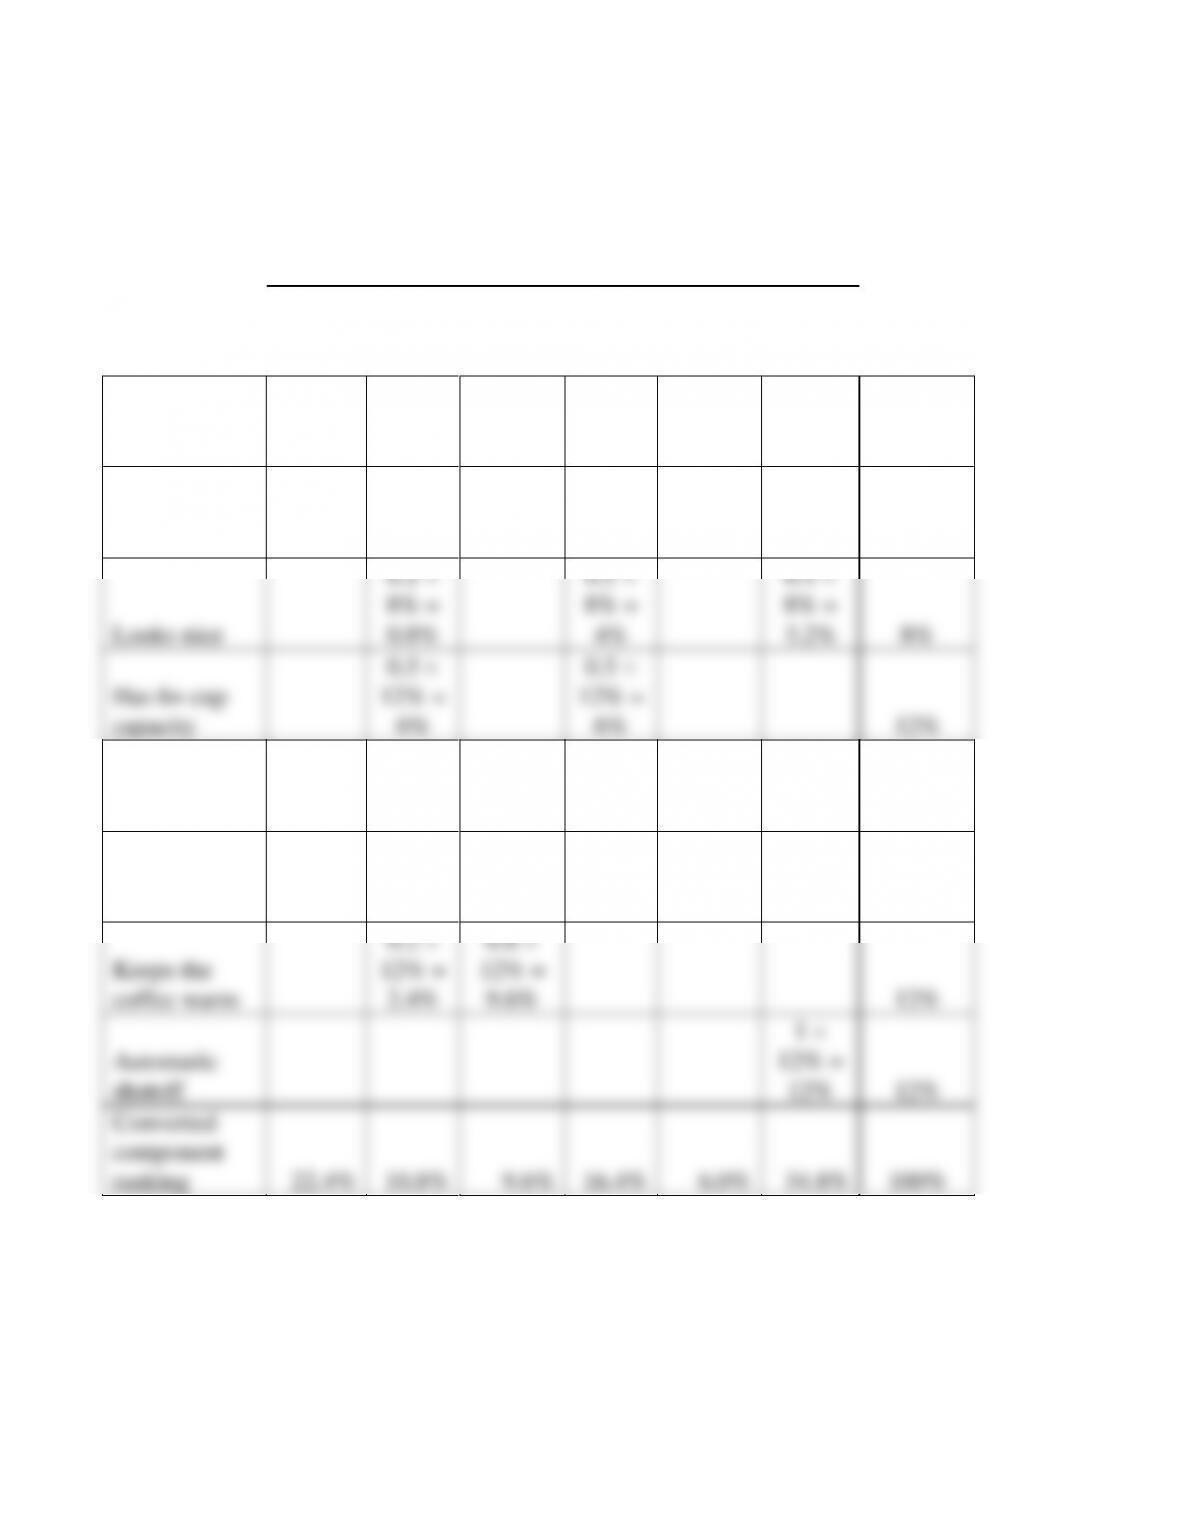
8-31 (a)
Percent Contribution of Each Component to Customer Requirements
Component
Customer
Requirements
Brew
Basket
Carafe
Coffee
Warmer
Body/
Water
Well
Heating
Element
Display
Panel
Relative
Feature
Ranking
Tastes/smells
like expresso
0.7
20% =
14%
0.3
20% =
6%
20%
Easy to clean
0.5
16% =
8%
0.1
16% =
1.6%
0.4
16% =
6.4%
16%
Looks nice
0.1
8% =
0.8%
0.5
8% =
4%
0.4
8% =
3.2%
8%
Has 6+ cup
capacity
0.5
12% =
6%
0.5
12% =
6%
12%
Starts auto-
matically on
time
1
16% =
16%
16%
Has multiple
grinder
settings
0.1
4% =
0.4%
0.9
4% =
3.6%
4%
Keeps the
coffee warm
0.2
12% =
2.4%
0.8
12% =
9.6%
12%
Automatic
shutoff
1
12% =
12%
12%
Converted
component
ranking
22.4%
10.8%
9.6%
16.4%
6.0%
34.8%
100%

Chapter 8: Measuring Life-Cycle Costs
– 305 –
(b) Value Index for Kitchenhelp’s Coffeemaker
(2)
(3)
(3) (2)
Component
Component
Relative
Value
Action
or Function
Cost
Importance
Index
Implied
Brew Basket
18.0%
22.4%
1.24
Enhance
Carafe
4.0%
10.8%
2.70
Enhance
Coffee Warmer
6.0%
9.6%
1.60
Enhance
Body/ Water Well
18.0%
16.4%
0.91
Reduce cost
Heating Element
8.0%
6.0%
0.75
Reduce cost
Display Panel
46.0%
34.8%
0.76
Reduce cost
The body/ water well, heating element, and display panel are candidates for
cost reduction because their value indexes are less than 1.
Atkinson, Solution Manual t/a Management Accounting, 6E
– 306 –
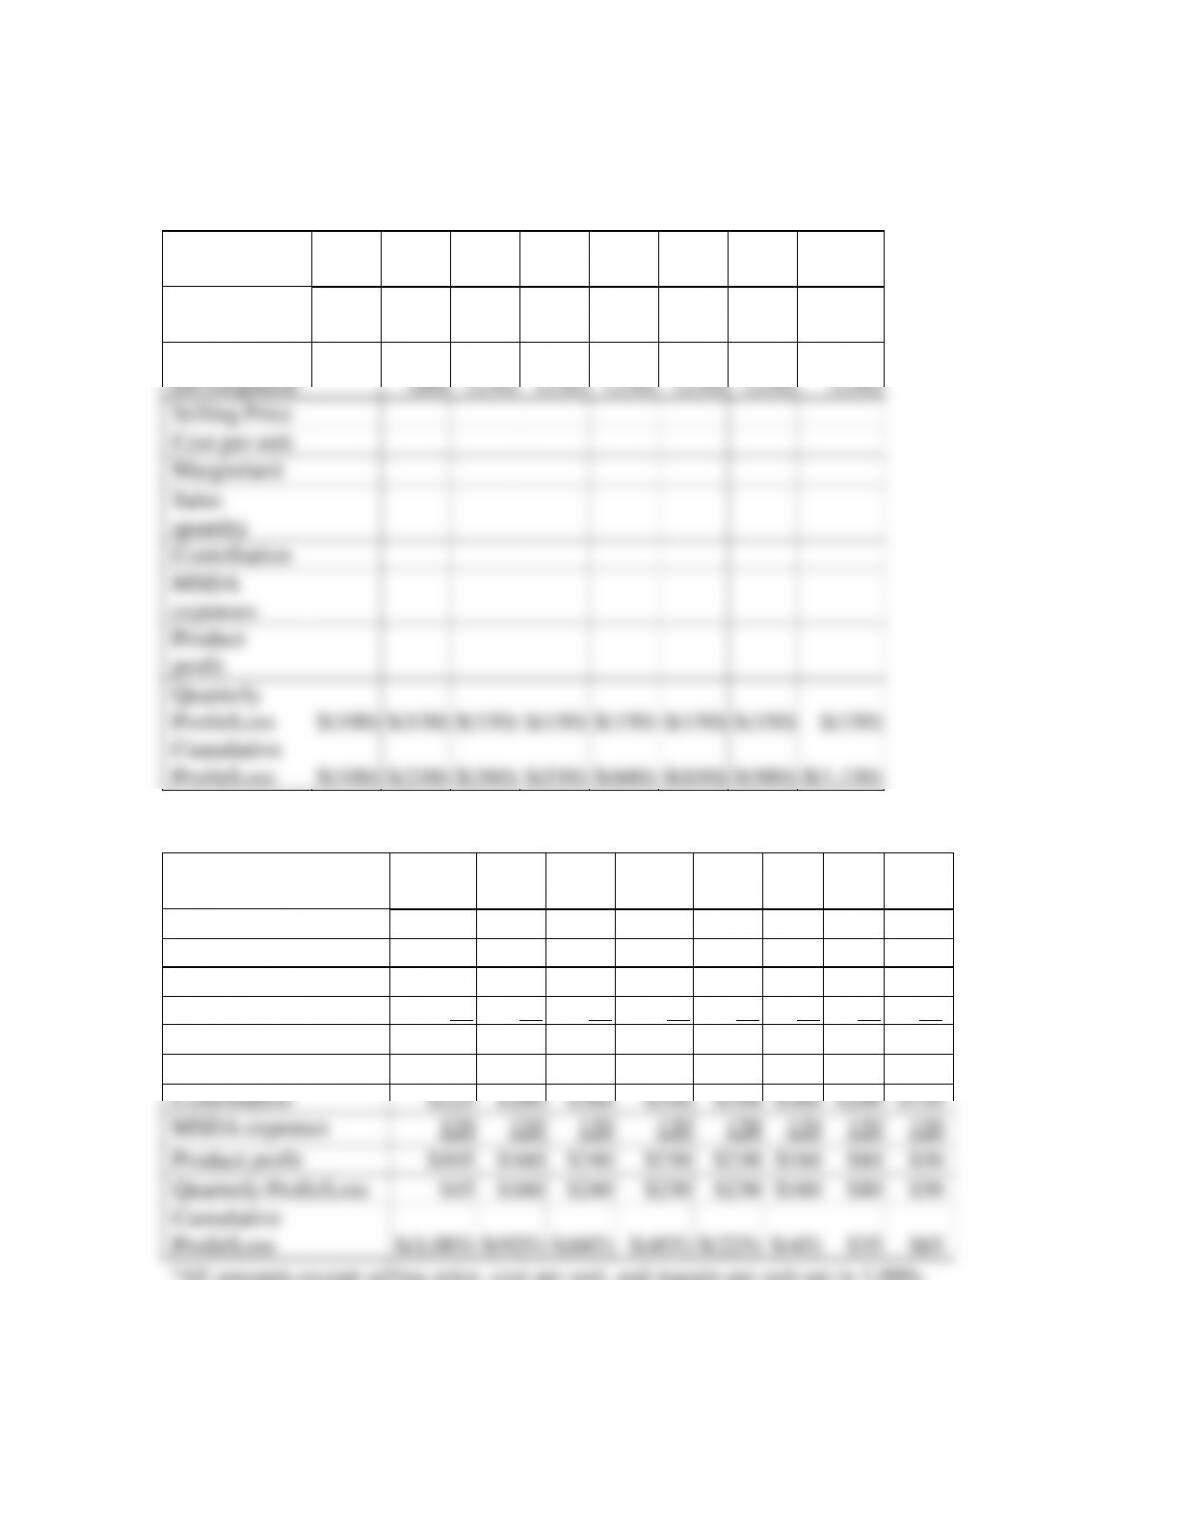
8-32 As shown below, Greyson’s new break-even time occurs during Quarter 3
of Year 4, approximately 15 months later than the initial 30 months (Year 3,
Quarter 2).
(000)
Y1,
Q1
Y1,
Q2
Y1,
Q3
Y1,
Q4
Y2,
Q1
Y2,
Q2
Y2,
Q3
Y2,
Q4
Market
Research
$(100)
$(50)
Product
Development
(80)
(150)
(150)
(150)
(150)
(150)
(150)
Selling Price
Cost per unit
Margin/unit
Sales
quantity
Contribution
MSDA
expenses
Product
profit
Quarterly
Profit/Loss
$(100)
$(130)
$(150)
$(150)
$(150)
$(150)
$(150)
$(150)
Cumulative
Profit/Loss
$(100)
$(230)
$(380)
$(530)
$(680)
$(830)
$(980)
$(1,130)
(000)a
Y3,
Q1
Y3,
Q2
Y3,
Q3
Y3,
Q4
Y4,
Q1
Y4,
Q2
Y4,
Q3
Y4,
Q4
Market Research
Product Development
$(60)
Selling Price
$19
$18
$18
$17
$17
$16
$15
$15
Cost per unit
10
10
10
10
10
10
10
10
Margin/unit
$9
$8
$8
$7
$7
$6
$5
$5
Sales quantity
25
35
45
50
50
50
40
30
Contribution
$225
$280
$360
$350
$350
$300
$200
$150
MSDA expenses
120
120
120
120
120
120
120
120
Product profit
$105
$160
$240
$230
$230
$180
$80
$30
Quarterly Profit/Loss
$45
$160
$240
$230
$230
$180
$80
$30
Cumulative
Profit/Loss
$(1,085)
$(925)
$(685)
$(455)
$(225)
$(45)
$35
$65
aAll amounts except selling price, cost per unit, and margin per unit are in 1,000s.