
Chapter 4: Activity-Based Cost Systems
– 147 –
level. Total gross margin increases by almost 81% and operating profit
increases more than ten-fold. The huge profit increase assumes only a
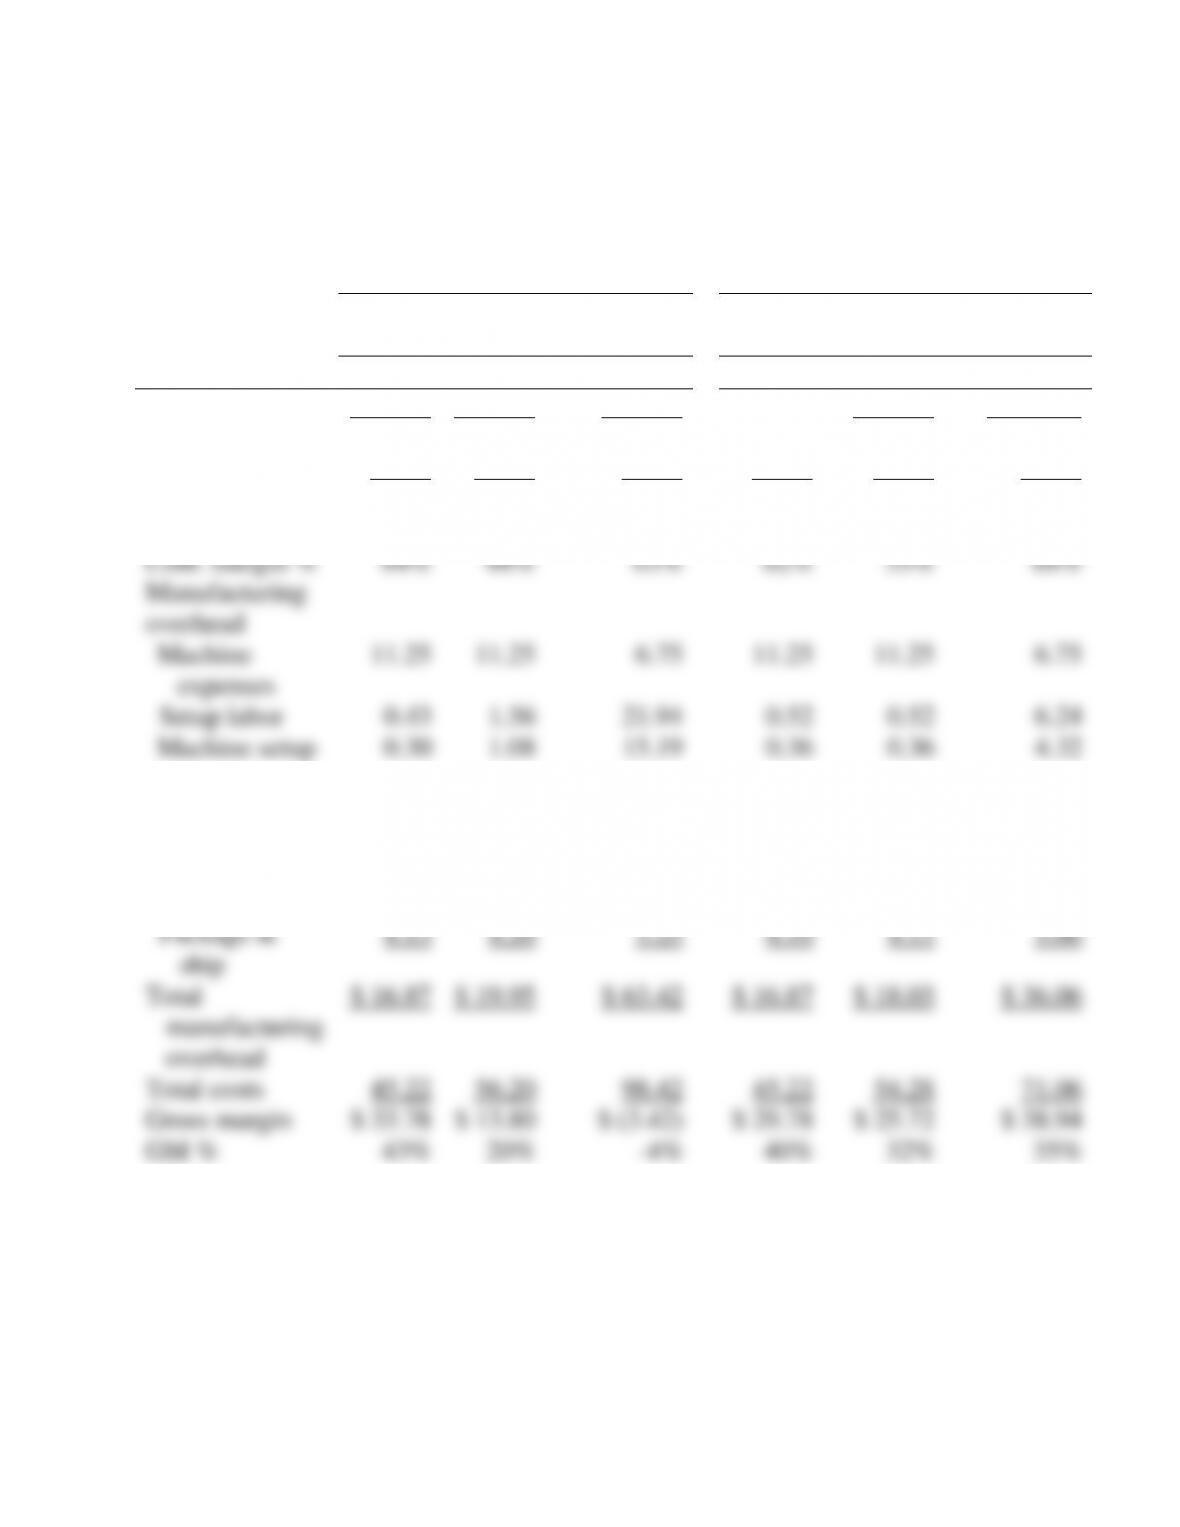
A comparison of product line profitability before and after the changes
follows.
Atkinson, Solution Manual t/a Management Accounting, 4E
– 148 –
Sippican (A)
Product Line Profitability
Sippican (B)
Product Line Profitability
Valves
Pumps
Flow
Controllers
Valves
Pumps
Flow
Controllers
Production
7,500
12,500
4,000
10,000
12,000
2,500
Price
$ 79.00
$ 70.00
$ 95.00
$ 75.00
$ 80.00
$ 110.00
Direct labor
12.35
16.25
13.00
12.35
16.25
13.00
Direct materials
16.00
20.00
22.00
16.00
20.00
22.00
Contribution
margin
$ 50.65
$ 33.75
$ 60.00
$ 46.65
$ 43.75
$ 75.00
Cont. margin %
64%
48%
63%
62%
55%
68%
Manufacturing
overhead
Machine
expenses
11.25
11.25
6.75
11.25
11.25
6.75
Setup labor
0.43
1.56
21.94
0.52
0.52
6.24
Machine setup
cost
0.30
1.08
15.19
0.36
0.36
4.32
Receiving and
production
control
0.10
0.30
2.11
0.15
0.13
0.75
Engineering
0.65
1.56
12.19
0.49
1.63
13.00
Package &
ship
4.13
4.20
5.25
4.10
4.15
5.00
Total
manufacturing
overhead
$ 16.87
$ 19.95
$ 63.42
$ 16.87
$ 18.03
$ 36.06
Total costs
45.22
56.20
98.42
45.22
54.28
71.06
Gross margin
$ 33.78
$ 13.80
$ (3.42)
$ 29.78
$ 25.72
$ 38.94
GM %
43%
20%
–4%
40%
32%
35%
Chapter 4: Activity-Based Cost Systems
– 149 –
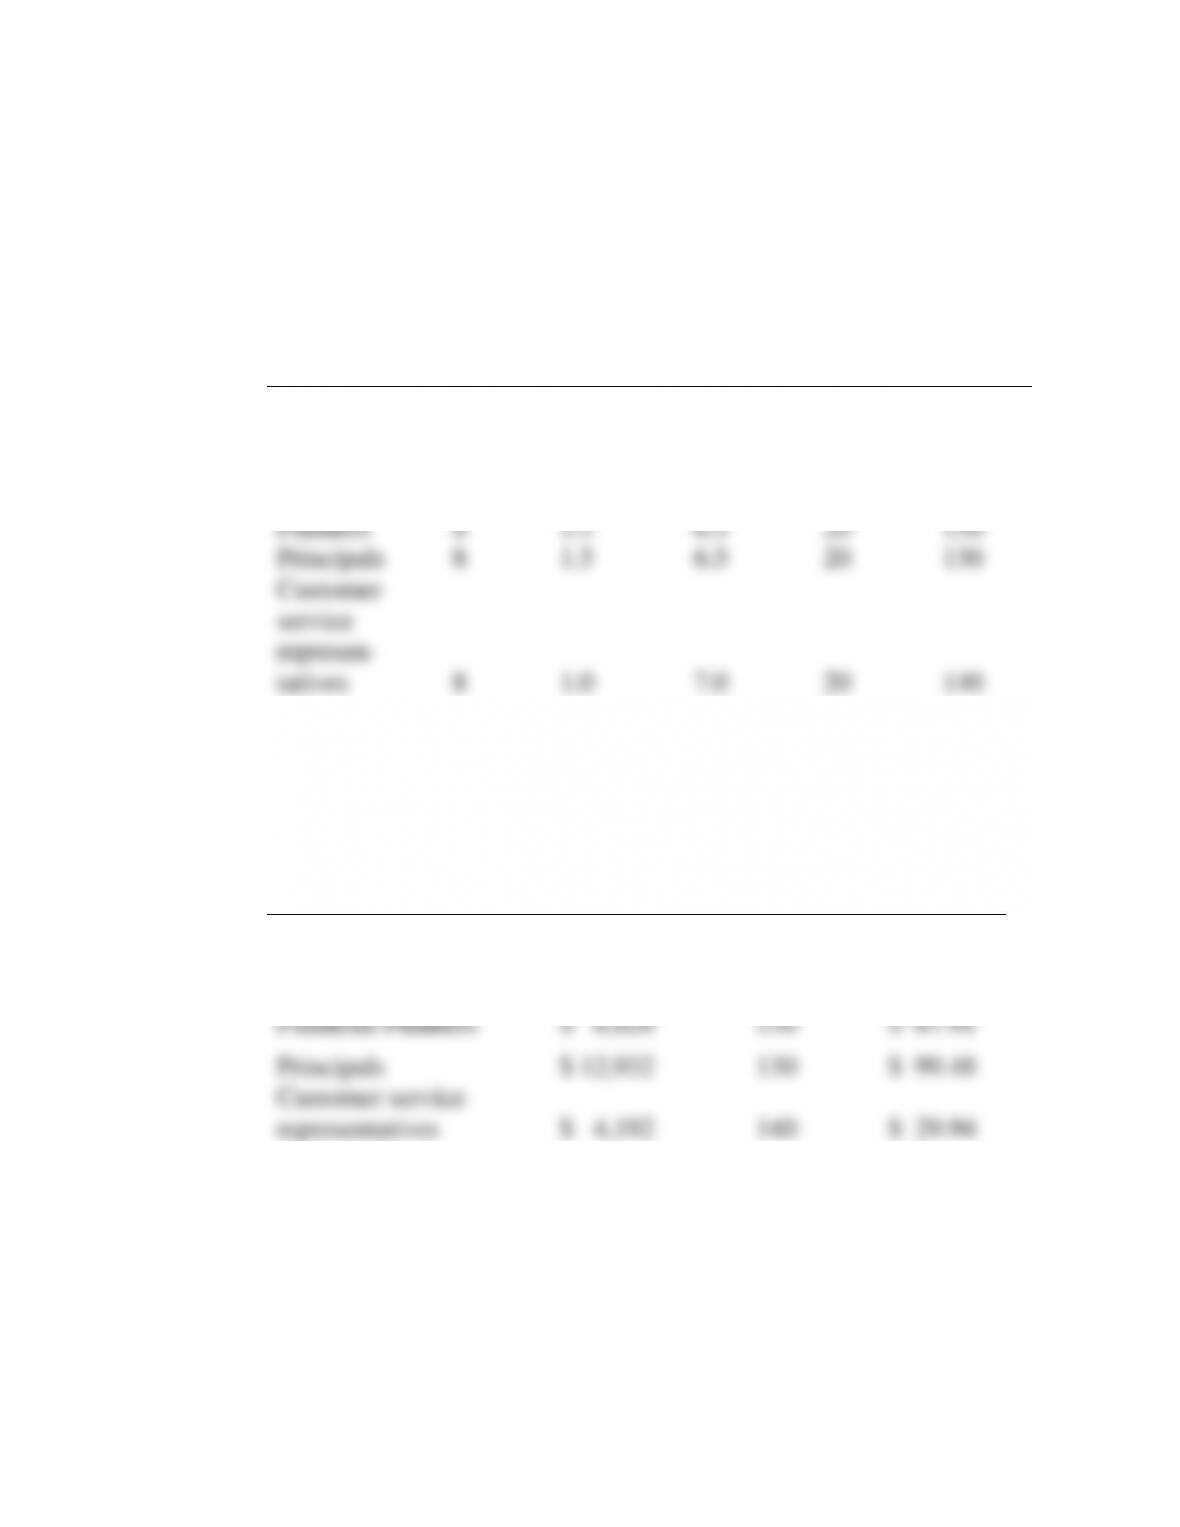
5-38 (a) Practical capacity for the personnel resources is calculated as follows:
Paid
Hours
per
Day
Nonpro–
ductive
Hours per
Day
Productive
Hours per
Day
Days
Used
per
Month
Practical
Capacity
Hours per
Month
Brokers
8
1.5
6.5
20
130
Account
Managers
8
1.5
6.5
20
130
Financial
Planners
8
1.5
6.5
20
130
Principals
8
1.5
6.5
20
130
Customer
service
represen-
tatives
8
1.0
7.0
20
140
Capacity cost rates are calculated as follows:
Cost Per
Person Per
Month
Practical
Capacity
Hours Per
Month
Capacity
Cost Rate
Brokers
$ 6,787
130
$ 52.21
Account Managers
$ 8,954
130
$ 68.88
Financial Planners
$ 8,828
130
$ 67.91
Principals
$ 12,932
130
$ 99.48
Customer service
representatives
$ 4,192
140
$ 29.94
Atkinson, Solution Manual t/a Management Accounting, 4E
– 150 –
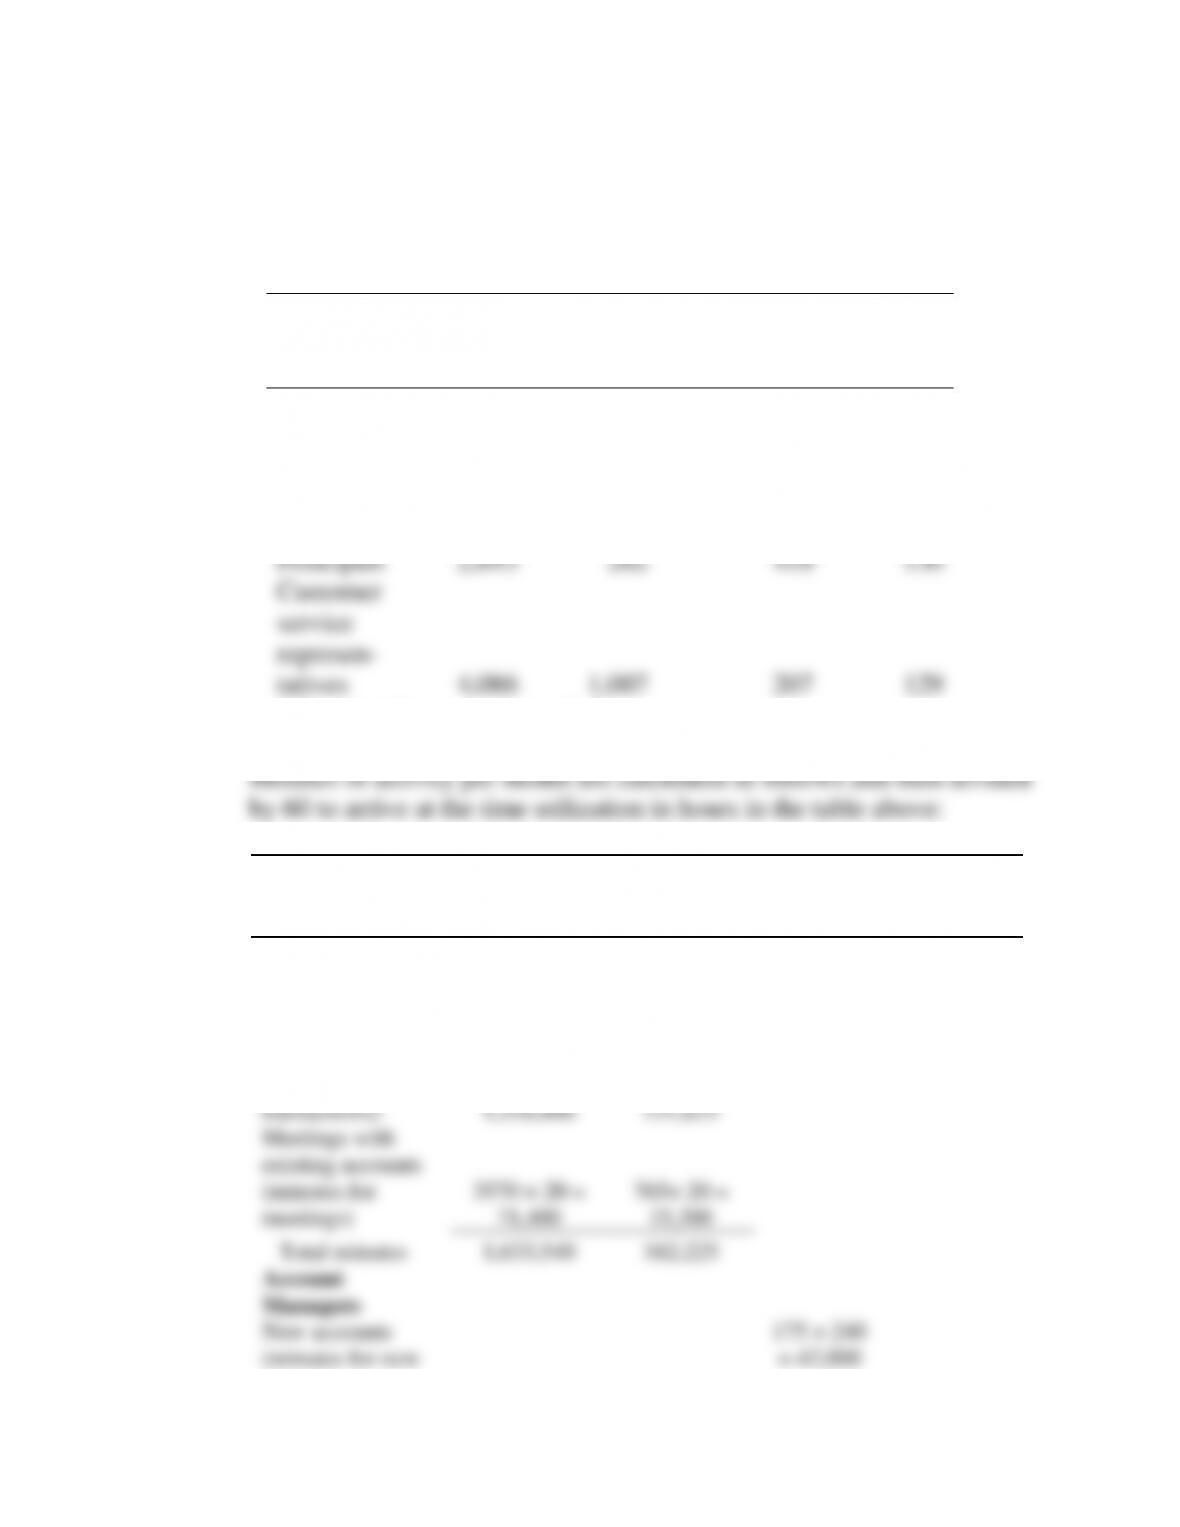
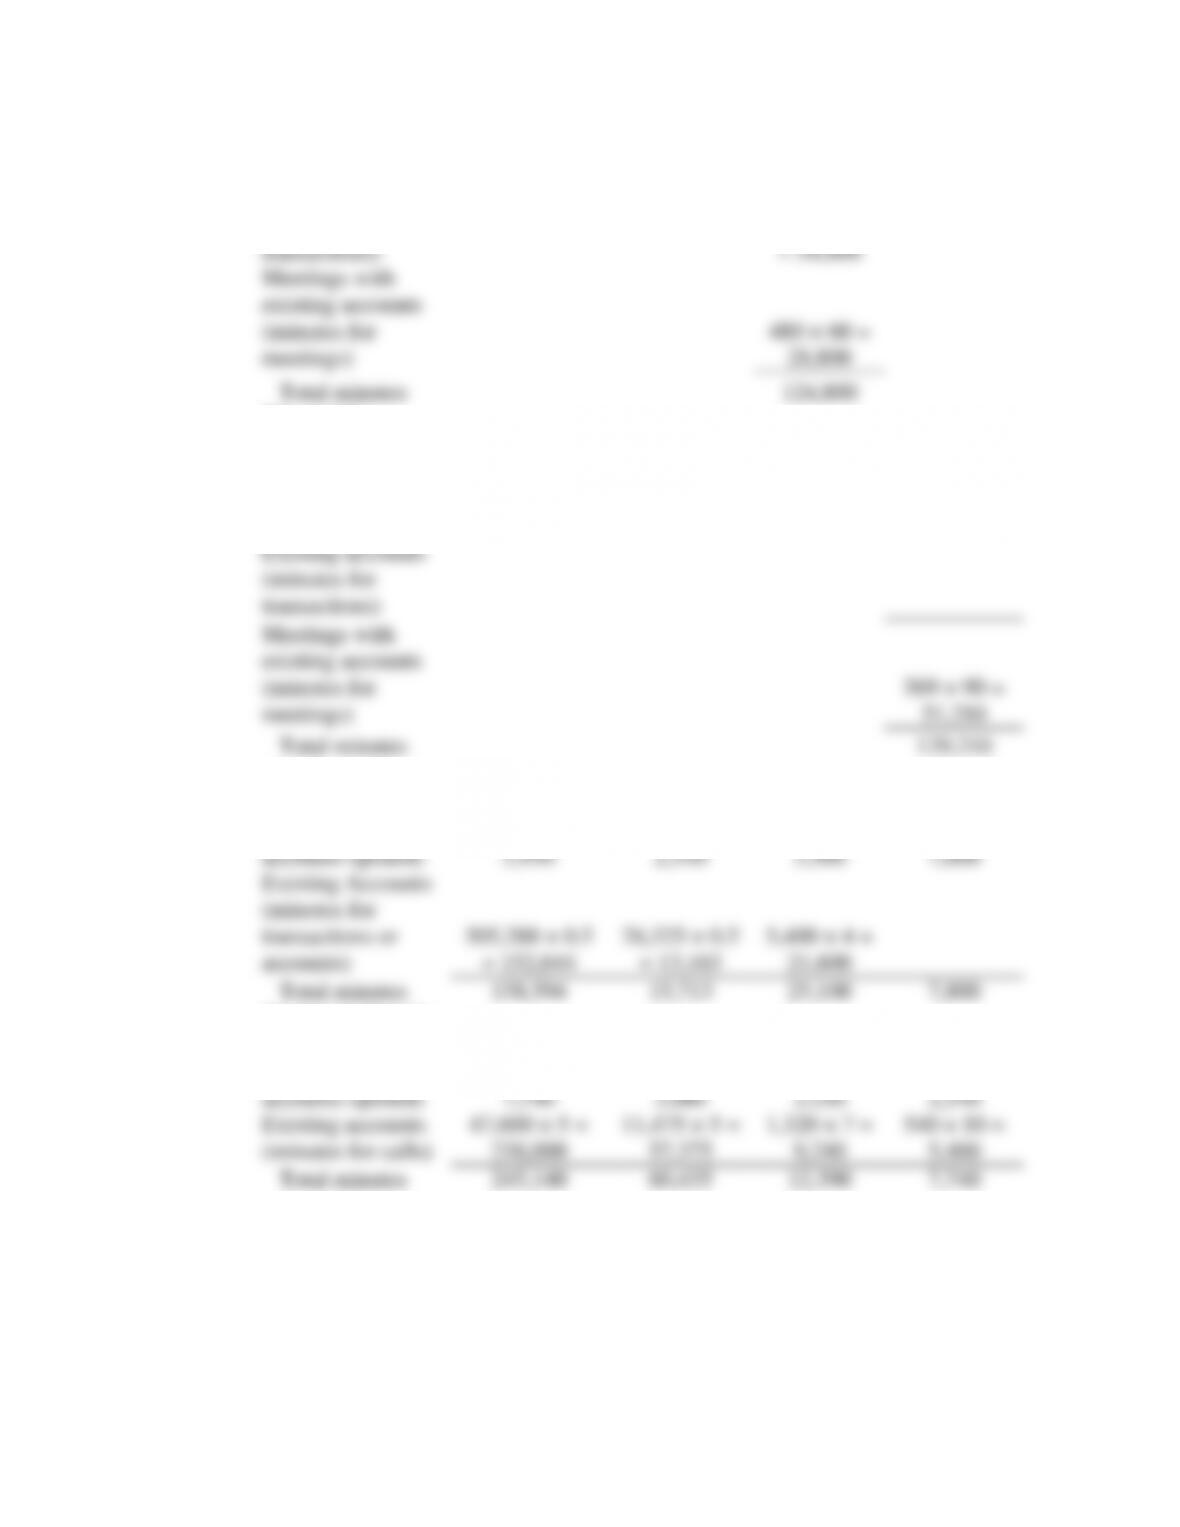
(b) A summary table of time utilization appears below, and supporting
computations appear in the subsequent table.
Time
Utilization
(Hours)a
Stock
Trading
Mutual
Fund
Trading
Account
Management
Financial
Planning
Brokers
27,226
2,704
Account
Managers
2,080
Financial
Planners
2,154
Principals
2,643
262
418
130
Customer
service
represen-
tatives
4,086
1,007
207
129
a Computations are shown below.
Minutes of
Activity Per
Month
Stock Trading
Mutual Fund
Trading
Account
Manage-
ment
Financial
Planning
Brokers
New accounts
(minutes for new
accounts opened)
595× 60 =
35,700
255× 60 =
15,300
Existing accounts
(minutes for
transactions)
305,288 × 5 =
1,526,440
26,325 × 5 =
131,625
Meetings with
existing accounts
(minutes for
meetings)
3570 × 20 =
71,400
765× 20 =
15,300
Total minutes
1,633,540
162,225
Account
Managers
New accounts
(minutes for new
175 × 240
= 42,000
Chapter 4: Activity-Based Cost Systems
– 151 –
accounts opened)
Existing accounts
(minutes for
transactions)
5,400 × 10
= 54,000
Meetings with
existing accounts
(minutes for
meetings)
480 × 60 =
28,800
Total minutes
124,800
Financial
Planners
New accounts
(minutes for new
accounts opened)
130 × 600 =
78,000
Existing accounts
(minutes for
transactions)
Meetings with
existing accounts
(minutes for
meetings)
569 × 90 =
51,210
Total minutes
129,210
Principals
New Accounts
(minutes for new
accounts opened)
595 × 10 =
5,950
255 × 10 =
2,550
175 × 20 =
3,500
130 × 60 =
7,800
Existing Accounts
(minutes for
transactions or
accounts)
305,288 × 0.5
= 152,644
26,325 × 0.5
= 13,163
5,400 × 4 =
21,600
Total minutes
158,594
15,713
25,100
7,800
Customer Service
New accounts
(minutes for new
accounts opened)
595 × 12 =
7,140
255 × 12 =
3,060
175 × 18 =
3,150
130 × 18 =
2,340
Existing accounts
(minutes for calls)
47,600 × 5 =
238,000
11,475 × 5 =
57,375
1,320 × 7 =
9,240
540 × 10 =
5,400
Total minutes
245,140
60,435
12,390
7,740
– 152 –
(c) A summary table of MIPS usage during peak and non-peak hours
appears below, and sample computations appear in the subsequent table.
MIPS
Usage
Stock
Trading
Mutual
Fund
Trading
Account
Manage-
ment
Financial
Planning
Total*
Available
Productive
Time
Peak
465,913
30,200
96,783
11,823
604,718
668,800
Non-
peak
99,358
105,986
72,212
11,860
289,415
334,400
MIPS usage during peak and non-peak hours is calculated by
multiplying MIPS per transaction by the number of transactions during
Transactions
Processed by
Servers
MIPS Per
Transaction
Number of
Transactions:
Stock Trading
MIPS for Stock
Trading
Peak
Non-
Peak
Peak
Non-
Peak
Order placements,
trades and order
clearing and
settlement activities
1.4
305,288
0
427,403
0
Account balance
inquiries
0.1
52,695
23,730
5,270
2,373
Quotation requests
0.1
332,400
177,100
33,240
17,710
Balance transfers
0.7
0
75,000
0
52,500
Account statement
preparation
0.9
0
29,750
0
26,775
Total
690,383
305,580
465,913
99,358
is as follows:
Chapter 4: Activity-Based Cost Systems
– 153 –
Each server is available for (22 days) × (24 hours per day) = 528 hours
should be charged to peak-hour users. Thus, the peak-usage hourly rate
is $6 × (608 + 912)/608 = $15 per hour.
The non-peak cost per MIPS is $6/50 = $0.12 and the peak cost per
MIPS is $15/50 = $0.30, as stated in the case.
(000s)
Stock
Trad-
ing
Mutual
Fund
Trad-
ing
Account
Manage
-ment
Finan-
cial
Plan-
ning
Total
Used
Unused
Capacity
Total
Supplied
Sales
$2,687
$ 1,091
$ 90
$156
$4,024
$4,024
Costs:
Brokers
1,421
141
1,563
(2)
1,561
Account
Managers
143
143
18
161
Financial
Planners
0
146
146
30
177
Principals
263
26
42
13
344
44
388
Customer
service
reps.
122
30
6
4
163
14
176
Computer
server
expenses
152
22
38
5
216
25
241
Total Costs
1,958
219
229
168
2,574
129
2,704
Margin
$ 728
$ 872
$ (139)
$ (12)
$1,450
$ (129)
$1,320
Margin %
27%
80%
-154%
-8%
36%
-3%
33%
S, G & A
1,300
Operating
Income
$20
Operating
Margin
0.5%
– 154 –
Stock trading sales = $8.80 × 305,288 = $2,686,534.
The computer server expenses are calculated by multiplying the peak–
usage MIPS by $0.30 and the non-peak-usage MIPS by $0.12. For
Cost Per
Resource
Month
Number of
Resources
Total Cost
Brokers
$ 6,787
230
$1,561,010
Account Managers
$ 8,954
18
$ 161,172
Financial Planners
$ 8,828
20
$ 176,560
Principals
$12,932
30
$ 387,960
Customer service
representatives
$ 4,192
42
$ 176,064
Computer server
expenses
$ 3,168
76
$ 240,768
Total
$2,703,534
personnel (account managers and principals for account management,
and financial planners for financial planning) in proportion to product
Chapter 4: Activity-Based Cost Systems
– 155 –
below.)
Costs as a Percent of Own Product Line Sales
Stock
Trading
Mutual
Fund
Trading
Account
Management
Financial
Planning
Brokers
52.9%
12.9%
0.0%
0.0%
Account
Managers
0.0%
0.0%
159.2%
0.0%
Financial
Planners
0.0%
0.0%
0.0%
93.6%
Principals
9.8%
2.4%
46.2%
8.3%
Customer
service
representatives
4.6%
2.8%
6.9%
2.5%
Computer
server expenses
5.6%
2.0%
41.9%
3.2%
Total
72.9%
20.1%
254.2%
107.6%