Chapter 5: Activity-Based Cost Systems
–137–
cost rates?
(b) Capacity Cost Rates
Cost/
Days Used
Paid Hrs
Nonprod.
Prod.
Prod.
Cost
Month
Per Month
Per Day
Hours
Hrs/Day
Hrs/Mo
Per Hr
Production and Setup Labor
$3,900
20
7.5
1.5
6.0
120
$32.50
Machine Expenses
$5,400
20
12.0
240
$22.50
Receiving and Production
Control
$3,900
20
7.5
1.0
6.5
130
$30.00
Engineering
$9,750
20
7.5
1.5
6.0
120
$81.25
Packaging and Shipping
$3,900
20
7.5
1.0
6.5
130
$30.00
Hours Used
Valves*
Pumps
Flow
Controllers*
Total
Hours
Production Volume
7,500
12,500
4,000
24,000
DL (Production and
Assembly)
2,850
6,250
1,600
10,700
Machine Runs
3,750
6,250
1,200
11,200
Machine Setups
100
600
2,700
3,400
Total Machine
14,600
Setup Labor
100
600
2,700
3,400
Receiving and Production
Control
25
125
281
431
Engineers
60
240
600
900
Packaging and Shipping
1,033
1,750
700
3,483
*For valves,
DL hours = 7,500 valves × 0.38 DL hours per valve = 2,850
Receiving and production hours = 1.25 × 20 production runs = 25
Engineering hours (from case): 60
–138–
For flow controllers:
DL hours = 4,000 × 0.40 =1,600
Machine run hours= 4,000 × 0.30 =1,200
The figures for pumps are computed similarly.
Practical and Used Capacity
Hours
Resources
Res.
Avail/
Hours
Hours
Avail −
% Cap.
Quant.
Res. Unit
Avail.
Used
Used Hrs
Used
DL (Production and
Assembly)
90
120
10,800
10,700
100
99%
Machines (Runs and
Setup)
62
240
14,880
14,600
280
98%
Setup Labor
30
120
3,600
3,400
200
94%
Receiving and
Production Control
4
130
520
431
89*
83%
Engineers
8
120
960
900
60
94%
Packaging and
Shipping
28
130
3,640
3,483
157*
96%
*Rounded

Chapter 5: Activity-Based Cost Systems
–139–
line:
Total Time Cost Rate Cost Assigned Unit Cost (4,000)
Machine run time: 1,200 $22.50 $ 27,000 $ 6.75
Set-ups (labor) 2,700 32.50 87,750 21.94
Set-ups (machines) 2,700 22.50 60,750 15.19
Receive/Prod Ctrl 225×(75/60)
281.25 30.00 8,438 2.11
Hand out sheet of P&L of Sippican. Do you believe the revised P&L?
Atkinson, Solutions Manual t/a Management Accounting, 6E
–140–
(c) (Small discrepancies in totals are due to calculations performed in a spreadsheet package.)
Valves
Valves:
per unit
costs
Pumps
Pumps:
per unit
costs
Flow
Contr.
FCs: per
unit
costs
Total
Unused
Capacity*
Actual
Percent
of Sales
Units
7,500
12,500
4,000
Sales
$592,500
$79.00
$875,000
$70.00
$380,00
0
$95.00
$1,847,500
$1,847,500
100%
Materials Expenses
120,000
16.00
250,000
20.00
88,000
22.00
$458,000
$458,000
DL Expenses
92,625
12.35
203,125
16.25
52,000
13.00
$347,750
$3,250
$351,000
Contribution Margin
379,875
50.65
421,875
33.75
240,000
60.00
$1,041,750
-$3,250
$1,038,500
56%
Manufacturing Overhead
Machine Expenses
84,375
11.25
140,625
11.25
27,000
6.75
$252,000
$6,300
$258,300
Setup Labor
3,250
0.43
19,500
1.56
87,750
21.94
$110,500
$6,500
$117,000
Machine Setup**
2,250
0.30
13,500
1.08
60,750
15.19
$76,500
$0
$76,500
Receiving and Production
Control
750
0.10
3,750
0.30
8,438
2.11
$12,938
$2,663
$15,600
Engineering
4,875
0.65
19,500
1.56
48,750
12.19
$73,125
$4,875
$78,000
Packaging and Shipping
31,000
4.13
52,500
4.20
21,000
5.25
$104,500
$4,700
$109,200
Total Manufacturing Overhead
126,500
16.87
249,375
19.95
253,688
63.42
$629,563
$25,038
$654,600
35%
Total costs
339,125
45.22
702,500
56.20
393,688
98.42
$1,435,313
$28,288
$1,463,600
Gross Margin
253,375
33.78
172,500
13.80
-13,688
-3.42
$412,188
-$28,288
$383,900
21%
Gross Margin/Sales %
42.8%
19.7%
-3.6%
22.3%
20.8%
Selling and Administrative Exps.
$350,000
19%
Operating Profit
$33,900
2%
Return on Sales
1.83%
* See the following table.
**Machine Setup unused capacity is included with Machine Expenses unused capacity.
Chapter 4: Activity-Based Cost Systems
– 141 –
of unused capacity is as follows.
Resources
Available −
Cost of
Used Hrs
Cost/Hr
Unused Capacity
DL (Production and
Assembly)
100.00
$32.50
$3,250
Machines (Runs and Setup)
280.00
$22.50
$6,300
Setup Labor
200.00
$32.50
$6,500
Receiving and Production
Control
88.75
$30.00
$2,663
Engineers
60.00
$81.25
$4,875
Packaging and Shipping
156.67*
$30.00
$4,700
*Rounded
overhead per unit, and valves the least. Based on the more accurate TDABC
assignment of machine and support expenses, management can see that valves
are even more profitable than they thought; pumps, while not earning the
targeted 35% gross margin, are still strong profit contributors, and flow
customers.
Atkinson, Solution Manual t/a Management Accounting, 4E
– 142 –
Traditional Cost Analysis
Valves
Pumps
Flow Controllers
Selling price
$79.00
$70.00
$95.00
Direct labor cost
$12.35
$16.25
$13.00
Direct material cost
16.00
20.00
22.00
Manufacturing overhead at 185% of
DL cost
22.85
30.06
24.05
Standard unit costs
$51.20
$66.31
$59.05
Gross margin
$27.80
$3.69
$35.95
Gross margin (%)
35%
5%
38%
Time-Driven ABC Analysis
Valves
Pumps
Flow Controllers
Selling price
$79.00
$70.00
$95.00
Direct labor cost
$12.35
$16.25
$13.00
Direct material cost
16.00
20.00
22.00
TDABC overhead
16.87
19.95
63.42
Standard unit costs
$45.22
$56.20
$98.42
Gross margin
$33.78
$13.80
($3.42)
Gross margin (%)
43%
20%
-3.6%
an example.
Time-driven activity-based costing reduced some of the barriers associated
with developing and updating the common approach to activity-based
costing, which assigns many resource expenses to activities based on
Chapter 4: Activity-Based Cost Systems
– 143 –
thought to be very profitable are actually unprofitable, some processes are
inefficient, or there is substantial unused capacity. Individuals may be
concerned that they will then be judged as poor managers, even though they
(e) The company should reconsider its product strategy and focus on its core
products—valves and pumps. Sippican might attempt to increase market
share in valves by offering discounts for large orders of valves. Furthermore,
Sippican could reduce discounting for pumps, especially for small orders.
minimum order size.
Sippican can also focus on improving processes. For example, the company
could reduce setup times or schedule production of components for multiple
product orders to share components across multiple batches. These
reducing capacity and related costs.
This discussion can be carried forward in the same context to include topics
PowerPoint presentation available to instructors.)
In Sippican (A), the company experiences declining profits and struggles to
understand why it is encountering severe price competition on one product
line. The controller collects data that will enable development of a time–
– 144 –
motivation and design of a time-driven, activity-based system, the action
steps that emerge from a more accurate cost analysis, and a powerful
connection between strategic planning and operational budgeting.
operational budgeting.
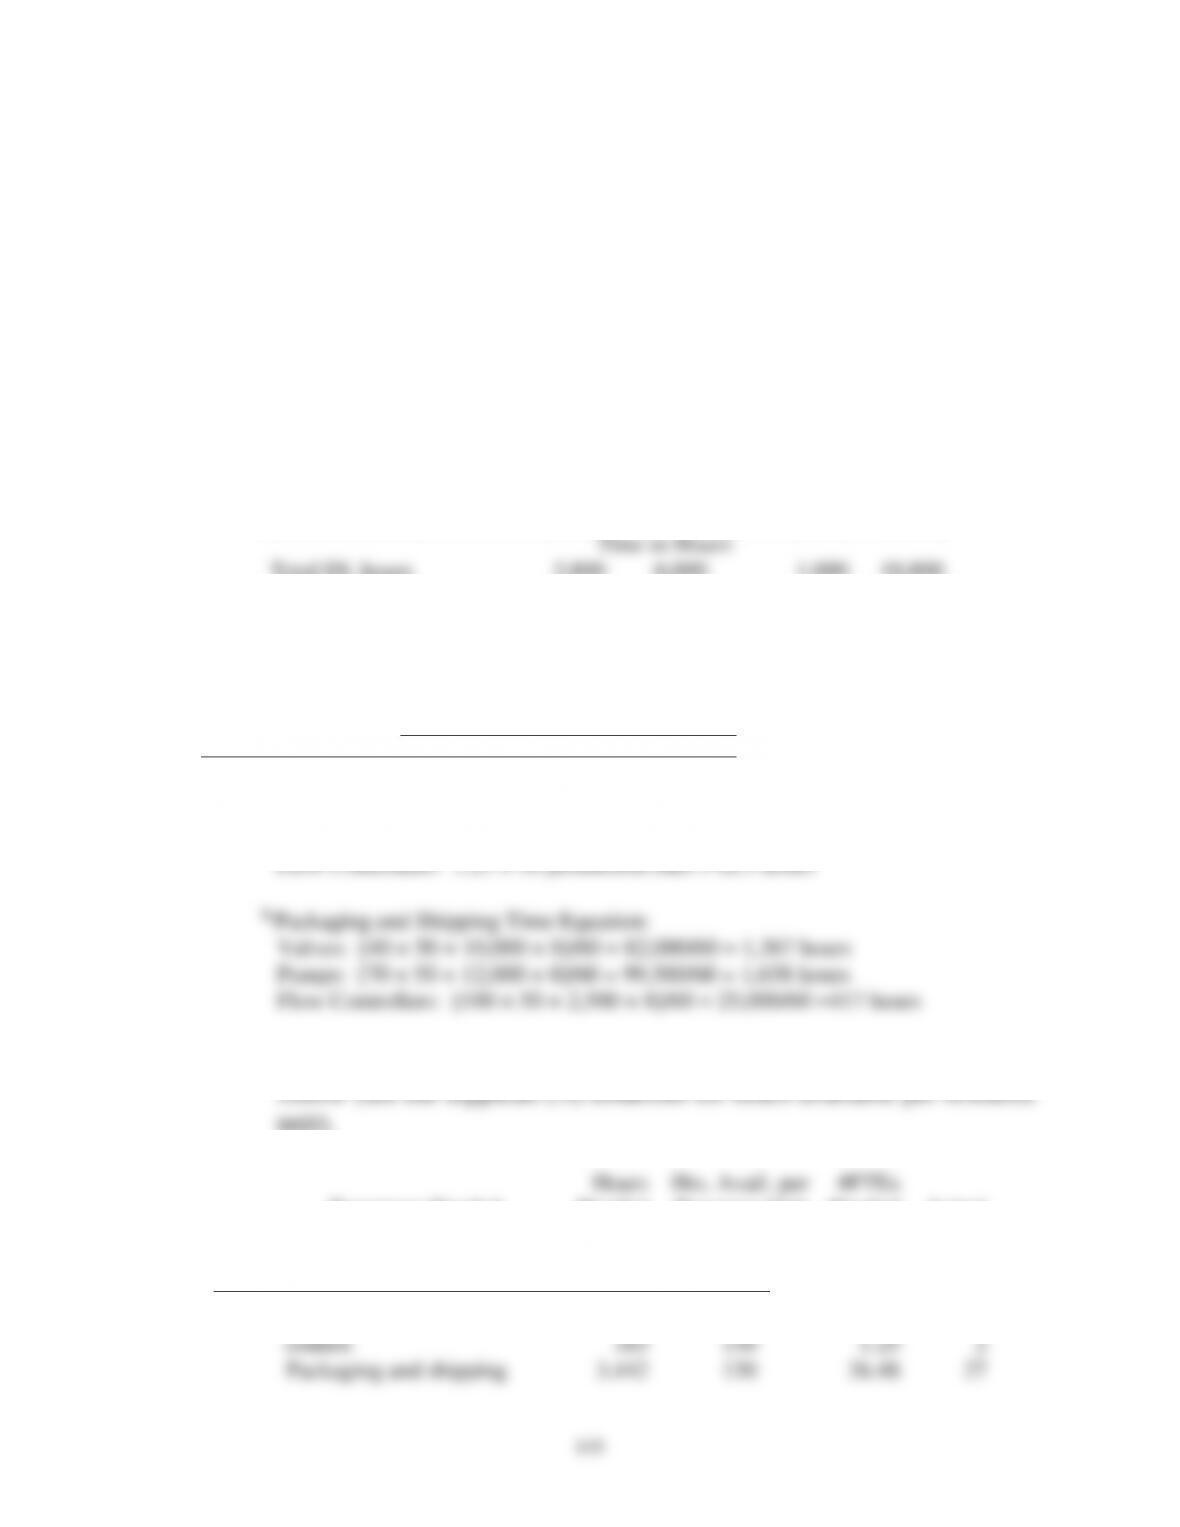
A new integrated approach links strategic planning with operational
budgeting.
Resource Plan
•People
•Capital
•Support
BSC
•Objectives
•Measures
•Targets
Activity-Based
Costing
Develop
Strategy and
Strategy Map
•Revenue Growth & Mix
•Productivity and Process
Improvements
SWOT
5 Forces
Model
Budget and
Pro Forma
P&L
Product and
Customer
Profitability
Strategic Initiative
Expense Budget
Initiative
Management
Process
Management
Select
Strategic
Initiatives
Propose
Production &
Sales Plans
Activity-
Based
Budgeting
Develop Sales
Forecasts
Teaching Plan
and not avoidable over some not very long time period. While one can have
“fixed” costs with one machine and one indirect worker, 62 machines and
Chapter 4: Activity-Based Cost Systems
– 145 –
because of fewer production runs and reductions in setup time. Small
reductions also occur in indirect labor and engineering time. Activity-based
budgeting is a powerful tool for creating bottoms-up operational budgets.
particularly those performing support functions.
(a) The planned hours used can be computed based on the data provided
in Exhibit 5-12 and case 5-36 (Sippican (A)):
Valves
Pumps
Flow
Controllers
Total
Production units
10,000
12,000
2,500
24,500
Time in Hours
Total DL hours
3,800
6,000
1,000
10,800
Total machine run hours
5,000
6,000
750
11,750
Machine setup hours
160
192
480
832
Total machine hours
5,160
6,192
1,230
12,582
Labor setup hours
160
192
480
832
Receiving and
production controla
50
50
62.5
163
Engineering hours
60
240
400
700
Packaging and shippingb
1,367
1,658
417
3,442
b Packaging and Shipping Time Equation:
Valves: [40 × 50 + 10,000 × 8]/60 = 82,000/60 = 1,367 hours
unit).
Resources Needed
Hours
Needed
Hrs. Avail. per
Resource Unit
#FTEs
Needed
Actual
Direct labor
10,800
120
90.00
90
Setup labor
832
120
6.93
7
Machines
12,582
240
52.43
53
Receiving and production
control
163
130
1.25
2
Packaging and shipping
3,442
130
26.48
27
– 146 –
Engineers
700
120
5.83
6
Capacity” will increase.
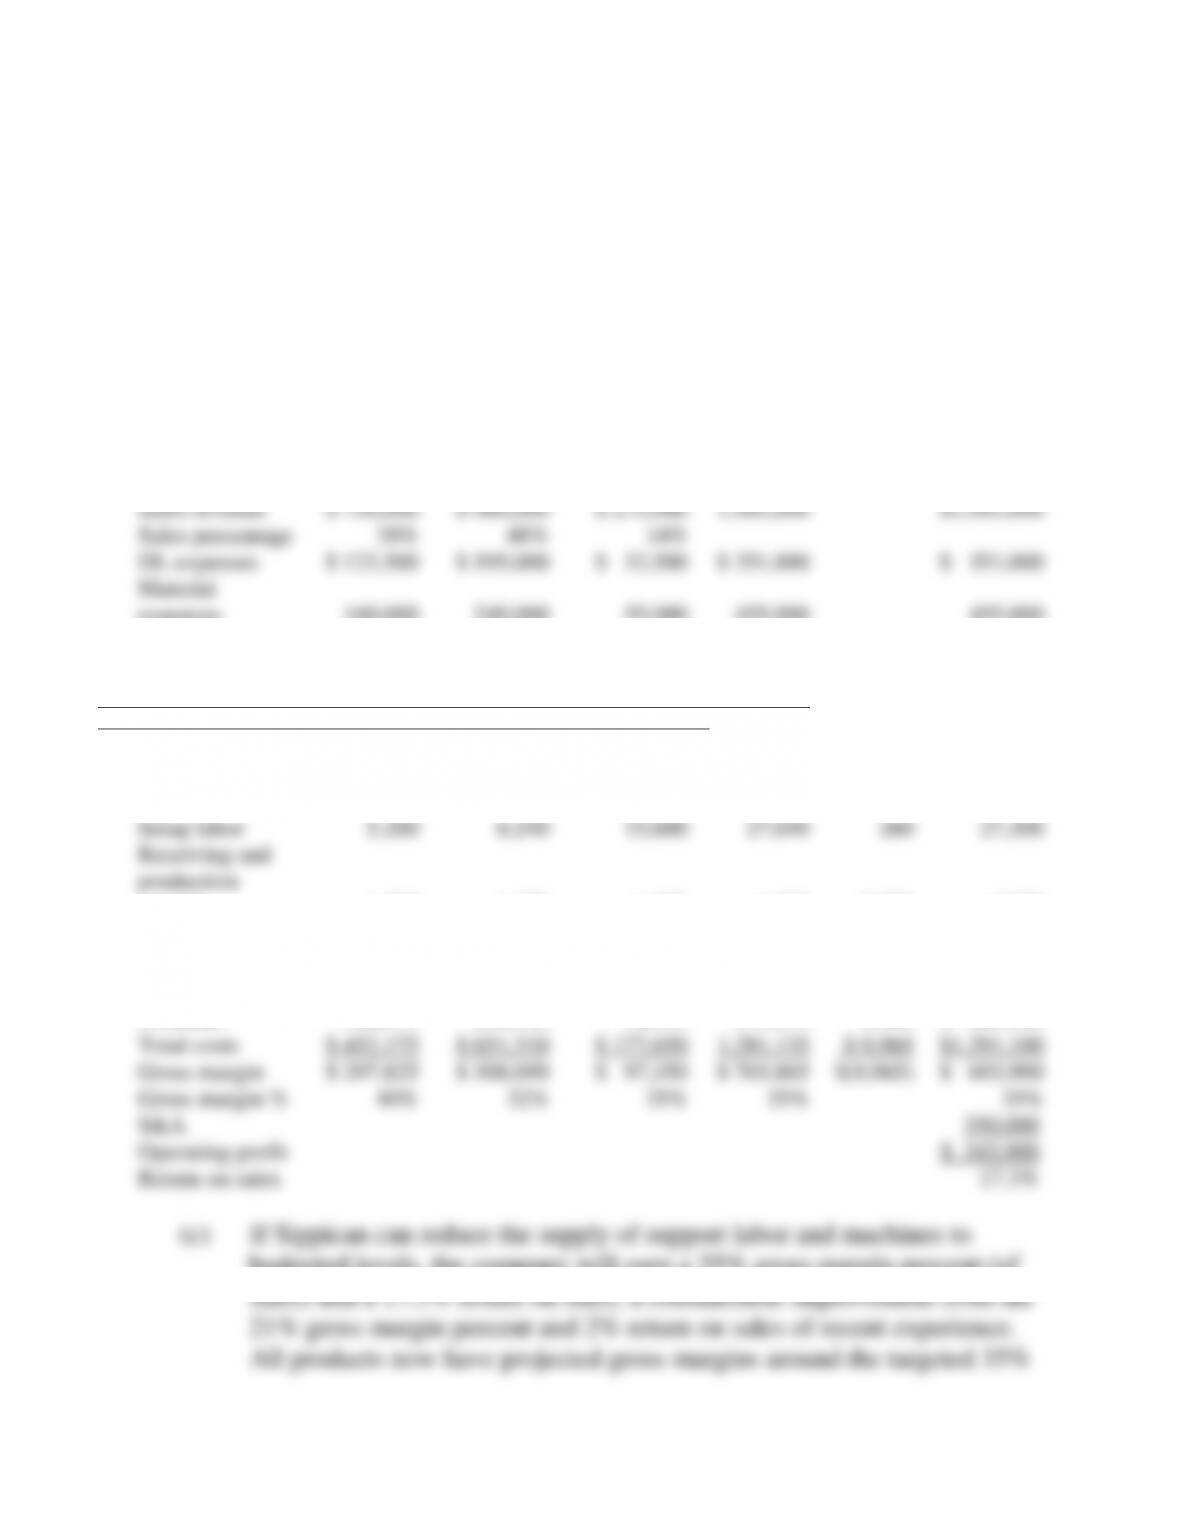
Sippican (B)
Pro Forma
Valves
Pumps
Flow
Controllers
Charged
Unused
Capacity
Actual
Sales (units)
10,000
12,000
2,500
Sales revenue
$ 750,000
$ 960,000
$ 275,000
1,985,000
$1,985,000
Sales percentage
38%
48%
14%
DL expenses
$ 123,500
$ 195,000
$ 32,500
$ 351,000
$ 351,000
Material
expenses
160,000
240,000
55,000
455,000
455,000
Contribution
margin
466,500
525,000
187,500
1,179,000
1,179,000
62%
55%
68%
59%
0%
59%
Machine run-
time expense
112,500
135,000
16,875
264,375
3,105
267,480
Machine set-up
expense
3,600
4,320
10,800
18,720
Setup labor
5,200
6,240
15,600
27,040
260
27,300
Receiving and
production
control
1,500
1,500
1,875
4,875
2,925
7,800
Engineering
4,875
19,500
32,500
56,875
1,625
58,500
Package & ship
41,000
49,750
12,500
103,250
2,050
105,300
Manufacturing
overhead
168,675
216,310
90,150
475,135
9,965
$ 485,100
Total costs
$ 452,175
$ 651,310
$ 177,650
1,281,135
$ 9,965
$1,291,100
Gross margin
$ 297,825
$ 308,690
$ 97,350
$ 703,865
$(9,965)
$ 693,900
Gross margin %
40%
32%
35%
35%
35%
S&A
350,000
Operating profit
$ 343,900
Return on sales
17.3%