
Chapter 9
Market Efficiency, Behavioral Finance,
and Technical Analysis
◼ Outline
Learning Goals
I. Efficient Markets
A. Levels of Market Efficiency
1. Weak Form
2. Semi-Strong Form
3. Strong Form
B. Market Anomalies
1. Calendar Effects
2. Small-Firm Effect
3. Post Earnings Announcement Drift (or Momentum)
4. The Value Effect
C. Possible Explanations
II. Behavioral Finance: A Challenge to the Efficient Markets Hypothesis
A. Investor Behavior and Security Prices
1. Overconfidence and Self-Attribution Bias
2. Loss Aversion
3. Representativeness
a. Overreaction
b. Underreaction
c. Narrow Framing
d. Belief Perseverance
B. Implications of Behavioral Finance for Security Analysis
Concepts in Review
III. Technical Analysis
A. Using Technical Analysis
B. Measuring the Market

Chapter 9 Market Efficiency, Behavioral Finance, and Technical Analysis 163
C. The Big Picture
1. Dow Theory
2. Trading Action
3. Confidence Index
D. Technical Conditions within the Market
1. Market Volume
2. Breadth of the Market
3. Short Interest
4. Odd-Lot Trading
E. Trading Rules and Measures
1. Advance-Decline Line
2. New Highs–New Lows
3. The Arms Index
4. Mutual Fund Cash Ratio
5. On-Balance Volume
6. Relative Strength
F. Charting
1. Bar Charts
2. Point-and-Figure Charts
3. Chart Formations
4. Moving Averages
Concepts in Review
Summary
Key Terms
Discussion Questions
Problems
Case Problems
9.1 Brett Runs Some Technical Measures on a Stock
9.2 Deb Takes Measure of the Market
Excel with Spreadsheets
◼ Key Concepts
1. Weak, semi-strong, and strong versions of the efficient market hypothesis and market anomalies
2. Technical analysis, its role in the security analysis and stock selection process, and the various
measures of market performance that make up technical analysis
3. The idea of random walks and efficient markets, particularly with regard to how the efficient market
concept explains why prices move randomly, and cautioning the investor not to expect to consistently
outperform the market


Chapter 9 Market Efficiency, Behavioral Finance, and Technical Analysis 165
◼ Answers to Concepts in Review
1. The random walk hypothesis claims that stock prices follow a random or erratic pattern. That is,
people who believe in this theory claim that price movements are unpredictable and as a result,
2. To outperform the market, one must consistently earn more than the required rate of return on
securities. In other words, one must be able to consistently find stocks selling below their justified
3. Market anomalies are deviations from what one would expect in an efficient market and, hence,
refute the efficient market hypothesis. Most of these anomalies are empirical anomalies, suggesting
4. Beyond firm fundamentals, behavioral finance advocates believe that investors’ decisions are affected
5. (a) Since investors tend to extrapolate past bad news into the future to an extent that would not
be justified based on the information alone, one should sell firms that have done poor recently

166 Gitman/Joehnk/Smart • Fundamentals of Investing, Eleventh Edition
(b) Investors have a tendency to believe that past events will occur, instead of believing that events
(c) Earnings announcements contain a mix of good and bad news over time. However, investors
looking at a longer historical trend may not recognize that a good announcement may suggest
6. Technical analysis involves the study of the various forces at work in the marketplace. Technical
analysts argue that internal market factors, such as trading volume and price movements, often reveal
7. The market can definitely have an impact on the prices of individual securities, and a significant one
at that. In fact, studies have indicated that between 20 and 50% of stock price behavior can be traced
8. Dow theory is a technical approach based on the idea that the stock market’s behavior can be best
described by the long-term price trend of the Dow Jones Industrial Index and the Dow Jones
9. (a) The breadth of the market measure contrasts the number of firms with share price advancing to
(b) Short interest is a measure of the number of shares in the stock market that have been sold short.

Chapter 9 Market Efficiency, Behavioral Finance, and Technical Analysis 167
(c) Odd-lot trading is based on the cynical assumption that small investors will be the last to invest
10. (a) An advance-decline line is the difference between the number of shares going up in price and the
(b) The Arms Index builds on the advance-decline line by considering the volume in advancing and
(c) On balance volume (OBV) is a momentum indicator that relates volume to price change. When
(d) The relative strength index (RSI) is a measure of the average price change on up days to the
(e) Moving averages compare current share price to the average share price over a specified period.
11. A stock chart is simply a historical record (or “picture”) of the behavior of a stock, the market, or
some technical measure (like short interest). Chartists believe that price patterns evolve into chart

168 Gitman/Joehnk/Smart • Fundamentals of Investing, Eleventh Edition
◼ Suggested Answers to Discussion Questions
1. Answers will vary by student. The main points to include would be:
2. Several of the key assumptions about investor behavior that serve as a basis for behavioral finance are
given below.
3. Stock valuation is often based on forecasts of dividends and discount rates. Overly optimistic investors
will overstate the expected dividend stream and underestimate the risk (and hence discount rate).
4. Technical analysis involves the study of the various forces at work in the marketplace. Technical
analysts argue that internal market factors, such as trading volume and price movements, often

170 Gitman/Joehnk/Smart • Fundamentals of Investing, Eleventh Edition
◼ Solutions to Problems
1. TRIN = (# of up stocks/# of down stocks)/(Up volume/Down volume)
because even though more stocks rose than fell, the trading volume in the falling stocks was greater.
2. (a)
Period 1
Period 2
Period 3
Period 4
Yield on high-grade bonds
5.30%
5.70%
5.10%
4.65%
Average bond yield
6.50%
7.32%
6.00%
4.90%
Yield spread (basis points)
Average yield/high-grade yield
120
155
90
25
Confidence Index
High-grade yield/average yield
81.54%
77.87%
85.00%
94.9%
(b) The yield spread has fallen from 155 to 25 over the past year (remember, each period lasts six
(c) The higher Confidence Index suggests that investors are more confident about future economic
3. OBVt+1 = OBVt + Total volume if price rose (or less Total volume if price fell)
Day 1
Up Day:
OBV = 50,000 + 70,000 = 120,000
Day 2
Down Day:
OBV = 120,000 − 45,000 = 75,000
Day 3
Up Day:
OBV = 75,000 + 120,000 = 195,000
In general, there is an upward trend. There was lower volume on the day the stock price fell.
4. One approach would subtract the number of new lows from the number of new highs. Resulting
values are added together, as shown below.
July
117 − 22
= 95
95
August
95 − 34
= 61
95 + 61 = 156
September
84 − 41
= 43
156 + 43 = 199
October
64 − 79
= −15
199 − 15 = 184
November
53 − 98
= −45
184 − 45 = 139
December
19 −101
= −82
139 − 82 = 57

Chapter 9 Market Efficiency, Behavioral Finance, and Technical Analysis 171
The number of new highs exceeded the number of new lows from July through September. Starting
7. (a)
Day
New Highs
New Lows
NH-NL Indicator
1
117
22
95
2
95
34
61
3
84
41
43
4
64
79
−15
5
53
98
−45
6
19
101
−82
7
19
105
−86
8
18
110
−92
9
19
90
−71
10
22
88
−66
Average
−25.8
(b)
Day
New Highs
New Lows
NH-NL Indicator
1
120
20
100
2
117
22
95
3
95
34
61
4
84
41
43
5
64
79
−15
6
53
98
−45
7
19
101
−82
8
19
106
−86
9
18
110
−92
10
19
90
−71
Average
−9.2
©2011 Pearson Education, Inc. Publishing as Prentice Hall
9.
A
B
A/B
Week
Mutual Fund Cash Position
Mutual Fund Total Assets
MFCR
Most Recent
$281,478,000
$2,345,650,000
12%
2
$258,500,000
$2,350,000,000
11%
3
$234,800,000
$2,348,000,000
10%
4
$211,950,000
$2,355,000,000
9%
5
$188,480,000
$2,356,000,000
8%
Conventional wisdom says that when the cash ratio exceeds 10 to 12%, the ratio is sending a bullish
signal. However, students may also argue that, given the trend and how recent the buildup in cash is,
the signal is bearish in the current time frame.
10.
Day
Closing Price
Day
Closing Price
10-Day
Moving Avg.
1
$25.25
11
$30.00
$27.75
2
$26.00
12
$30.00
$28.15
3
$27.00
13
$31.00
$28.55
4
$28.00
14
$31.50
$28.90
5
$27.00
15
$31.00
$29.30
6
$28.00
16
$32.00
$29.70
7
$27.50
17
$29.00
$29.85
8
$29.00
18
$29.00
$29.85
9
$27.00
19
$28.00
$29.95
10
$28.00
20
$27.00
$29.85
Based on the data, the price fell below the 10-day moving average on Day 17, providing a sell signal.
Chapter 9 Market Efficiency, Behavioral Finance, and Technical Analysis 173
◼ Solutions to Case Problems
Case 9.1 Brett Runs Some Technical Measures on a Stock
(a) RSI = 100 − [100/(1 + APCup days/APCdown days)]
APC = Average price change
Day of
Period
9/30/07–10/31/07
11/30/07–12/31/07
Advance
Decline
Advance
Decline
1
0.55
−0.75
2
0.10
−0.75
3
0.15
0.25
4
0.20
0.50
5
0.10
1.05
6
−0.18
1.25
7
−0.37
−0.30
8
−1.05
−0.25
9
0.75
10
−0.25
0.90
11
−0.25
0.10
12
−0.25
0.75
13
−0.25
0.75
14
0.05
0.75
15
−0.40
0.75
16
0.65
0.25
17
0.35
−0.10
18
0.07
0.60
19
0.09
0.25
20
0.50
21
0.05
Average
0.231
−0.375
0.591
−0.430
RSI (October): 100 − {100/[1 + (.231/.375)]} = 100 − 61.9 = 38.1
RSI (December): 100 − {100/[1 + (.591/.430)]} = 100 − 42.1 = 57.9
1. The RSI is getting bigger, suggesting that Nautilus Navigation is reaching a point where it is
174 Gitman/Joehnk/Smart • Fundamentals of Investing, Eleventh Edition
(b) 1. Ten-day moving averages and respective share prices are given below.
Price
Moving
Average
Price
Moving
Average
Price
Moving
Average
17.20
15.85
17.31 (10/31)
16.87
17.50
19.60
18.00
16.25
17.77
16.92
16.75
19.22
18.00 (9/30)
16.62
18.23
17.04
17.00
18.84
18.55
17.00
19.22
17.29
17.50
18.59
18.65
17.32
20.51
17.69
18.55
18.44
18.80
17.60
20.15
18.05
19.80
18.40
19.00
17.90
20.00
18.44
19.50
18.35
19.10
18.20
20.21
18.78
19.25
18.33
18.92
18.35
20.25
19.09
20.00
18.41
18.55
18.48
20.16
19.38
20.90
18.68
17.50
18.51
20.00
19.65
21.00
19.02
17.50
18.46
20.25
19.90
21.75
19.52
17.25
18.38
20.50
20.12
22.50
20.08
17.00
18.23
20.80
20.28
23.25
20.65
16.75
18.04
20.00
20.23
24.00
21.20
16.50
17.81
20.00
20.22
24.25
21.64
16.55
17.56
20.25
20.24
24.15
22.10
16.15
17.27
20.00
20.22
24.75
22.66
16.80
17.06
19.45
20.14
25.00
23.16
17.15
16.92
19.20
20.04
25.50
23.62
17.22
16.89
18.25 (11/30)
19.87
25.55 (12/31)
24.07
2. At the end of August, the price is above the moving average. From that point forward, there are
six times when the price crosses the moving average value, as signified by the arrow signs. There
3. The moving average signal as of 12/31/07 would be to buy shares since its current share price
Chapter 9 Market Efficiency, Behavioral Finance, and Technical Analysis 175
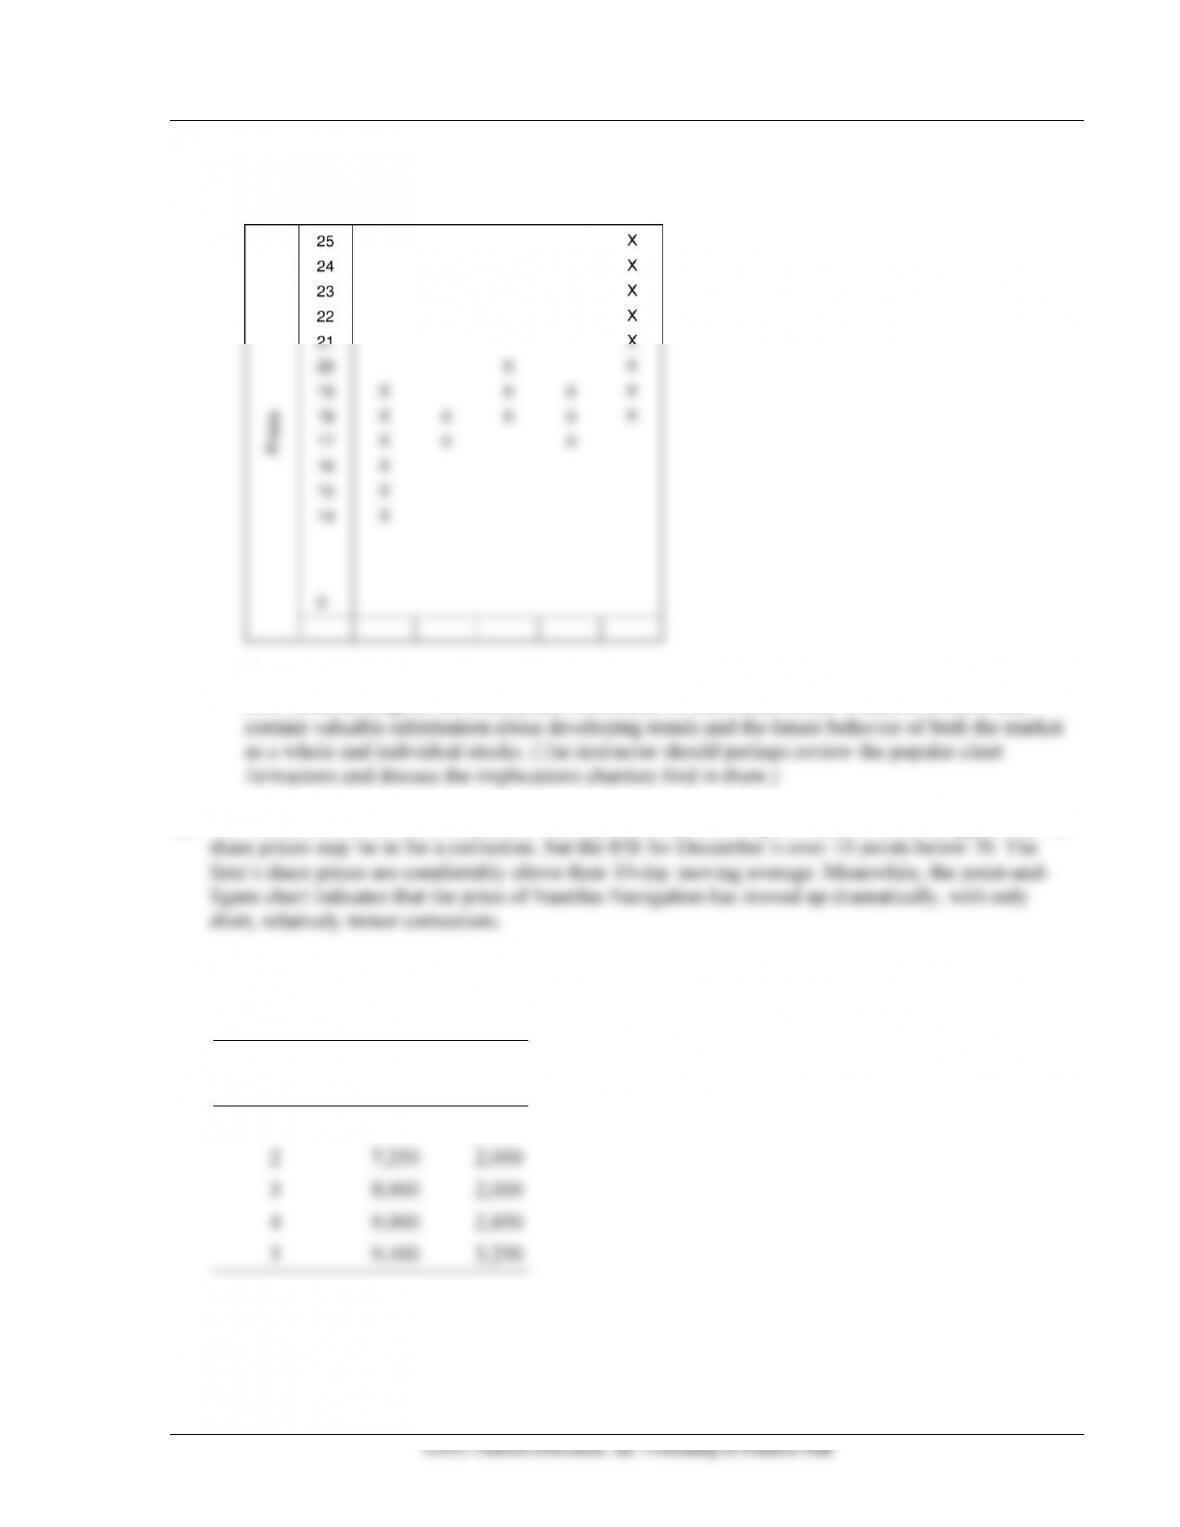
(c) 1. The point-and-figure chart, given below, shows that Nautilus Navigation’s shares are following an
upward trend.
Point-and-figure charts (along with other charts) are used by chartists to plot everything from the
Dow Jones average to the share price movements of individual stocks. Chartists believe they
(d) The technical indicators are in general sending Brett a positive signal. The RSI index suggests that the
Case 9.2 Deb Takes Measure of the Market
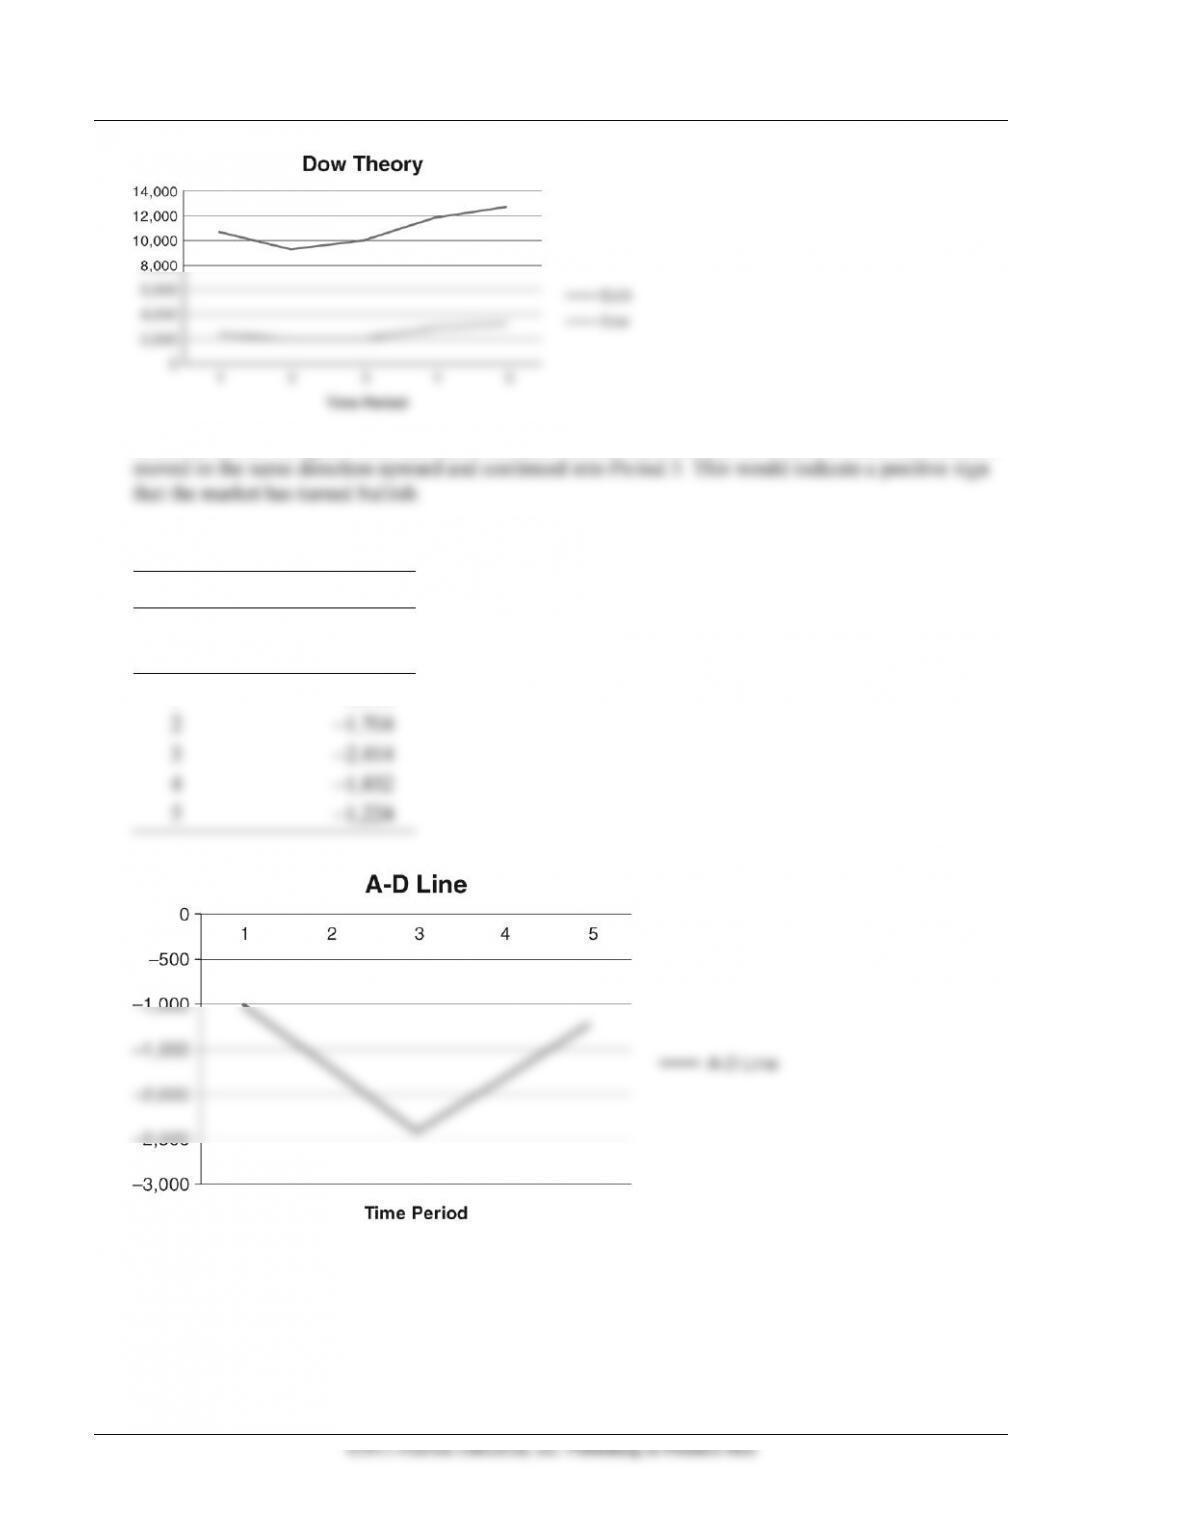
(a) Dow Theory. Students should graph the Dow averages. The graph is as follows:
x
y
y
Time Period
DJIA
Dow
1
8,300
2,375
2
7,250
2,000
3
8,000
2,000
4
9,000
2,850
5
9,400
3,250
176 Gitman/Joehnk/Smart • Fundamentals of Investing, Eleventh Edition
©2011 Pearson Education, Inc. Publishing as Prentice Hall
Students should recognize that the market reached a confirmation point in Period 4 when both indexes
(b) Advance-Decline Line. The advance-decline chart based on the data from the table:
Advance-Decline Line
x
y
Time Period
A-D Line
1
−1,010
2
−1,704
3
−2,414
4
−1,832
5
−1,224
Chapter 9 Market Efficiency, Behavioral Finance, and Technical Analysis 177
Advancing Issues (NYSE)
1,120
1,278
1,270
1,916
1,929
Declining Issues (NYSE)
2,130
1,972
1,980
1,334
1,321
Advance-Decline Plot
(1,010)
(694)
(710)
582
608
Plot Point
(1,010)
(1,704)
(2,414)
(1,832)
(1,224)
The advance-decline line, adding the net advance/decline from previous period (plot point):
Based on the rising advance-decline line, it appears the market has turned bullish. Many more stocks
are closing up than down since Period 3. This confirms the reading from the Dow theory above.
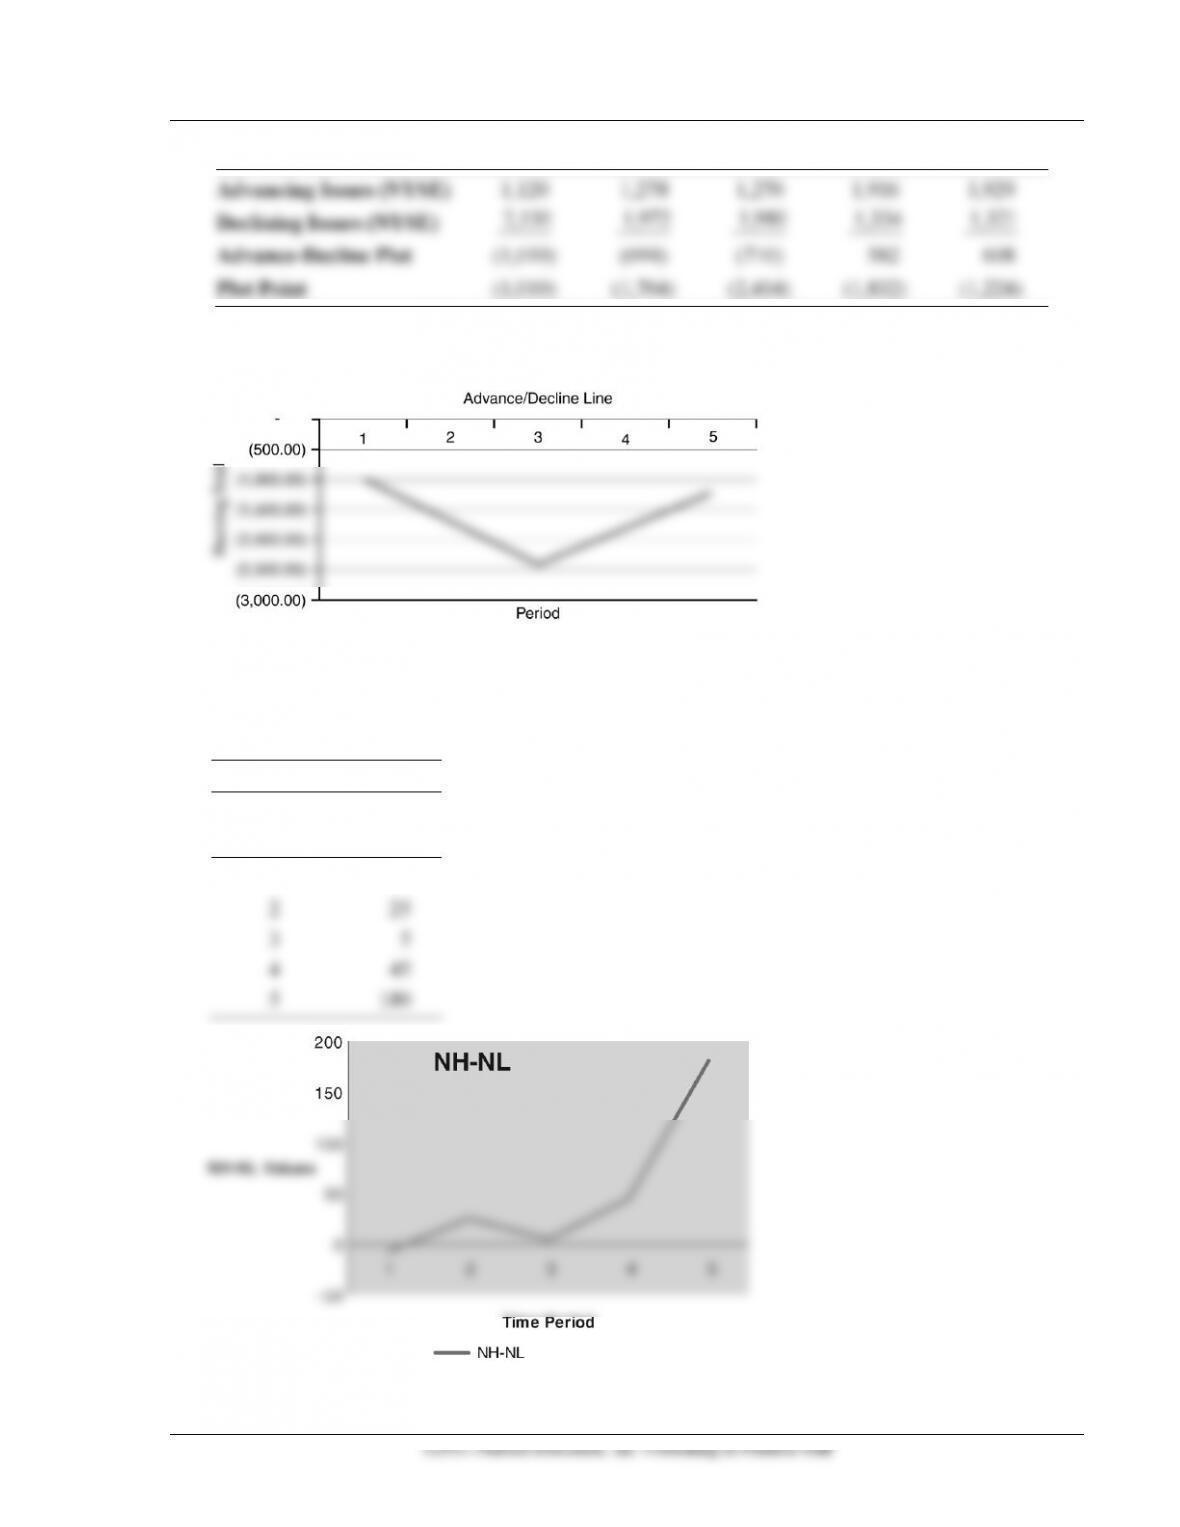
(c) New highs–new lows (the NH-NL indicator):
NH–NL
x
y
Time Period
NH–NL
1
−7
2
25
3
5
4
45
5
180
178 Gitman/Joehnk/Smart • Fundamentals of Investing, Eleventh Edition
New Highs
68
85
85
120
200
New Lows
75
60
80
75
20
NH–NL
(7)
25
5
45
180
The problem states that the current NH-NL 10-day moving average is 0 and that the past 10 periods
were 0. Therefore, students should begin with 0 and add each period while subtracting 0 for the
moving average. The graph presents as follows:
The NH-NL indicator is very positive. This is further confirmation of the bullish trend because many
more stocks are closing at new highs than at new lows since Period 3. The trend has accelerated in
Period 5.
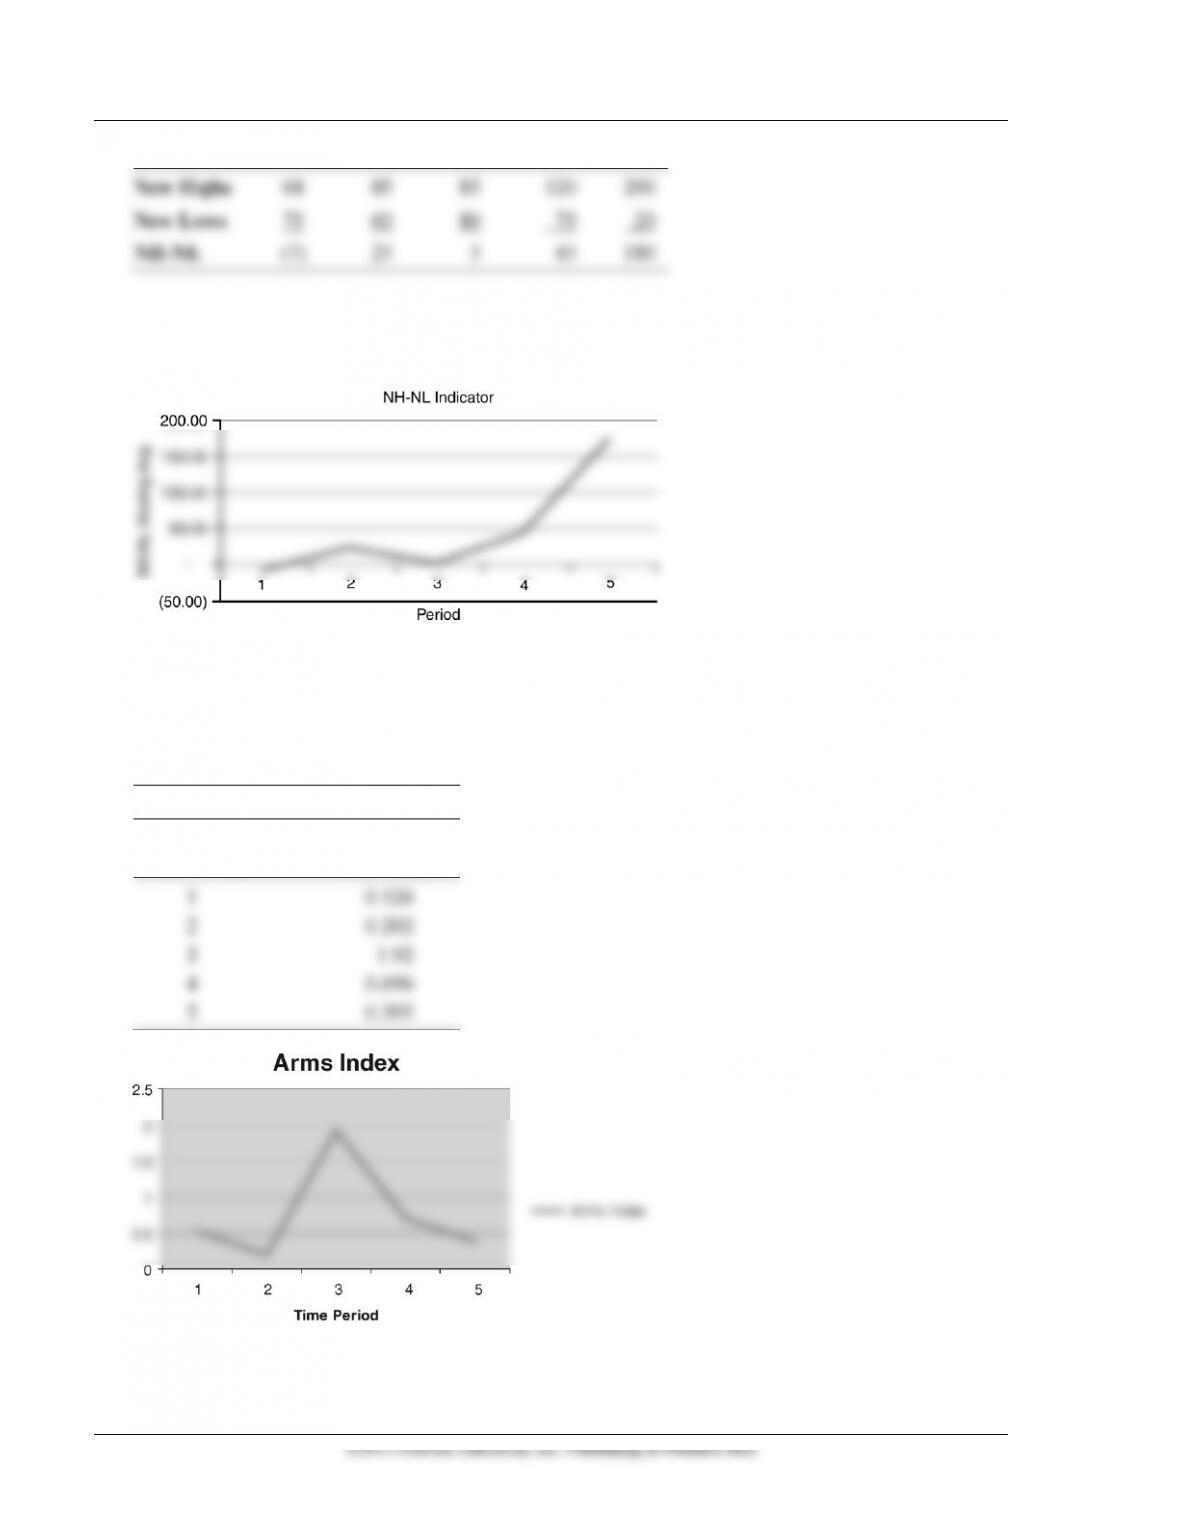
(d) The Arms Index, or TRIN, is calculated as follows:
Arms Index
x
y
Time Period
Arms Index
1
0.526
2
0.202
3
1.92
4
0.696
5
0.395
Chapter 9 Market Efficiency, Behavioral Finance, and Technical Analysis 179
©2011 Pearson Education, Inc. Publishing as Prentice Hall
TRIN = [(# of up stocks)/(# of down stocks)]/[(volume in up stocks)/(volume in down stocks)]
Advancing Issues (NYSE)
1,120
1,278
1,270
1,916
1,929
Declining Issues (NYSE)
2,130
1,972
1,980
1,334
1,321
Advances/Declines
0.53
0.65
0.64
1.44
1.46
Volume Up
600,000,000
836,254,123
275,637,497
875,365,980
1,159,534,297
Volume Down
600,000,000
263,745,877
824,362,503
424,634,020
313,365,599
Up/Down
1.00
3.17
0.33
2.06
3.70
TRIN
0.52
0.20
1.92
0.70
0.39
Higher TRIN values are interpreted as bad for the market, while lower TRIN values are interpreted as
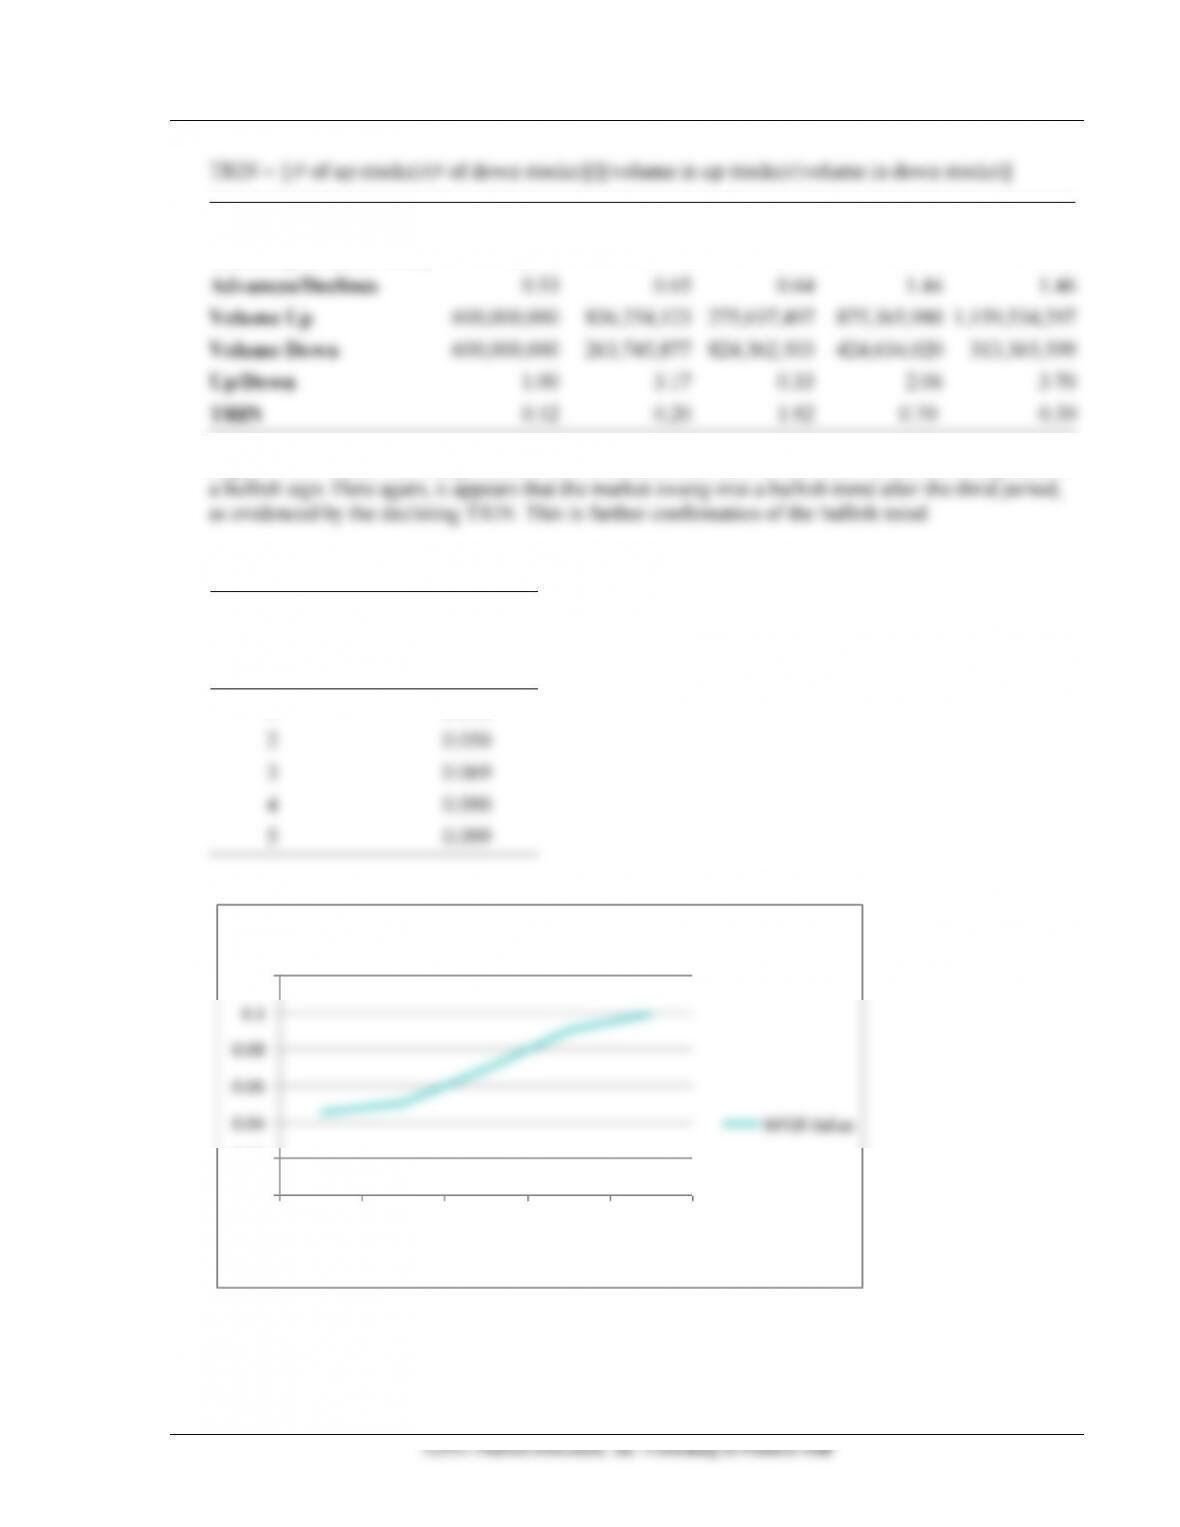
(e) The mutual fund cash ratio is calculated as follows:
Mutal Fund Cash Ratio
x
y
Time Period
MFCR Value
1
0.045
2
0.050
3
0.069
4
0.090
5
0.099
MFCR Value
0
0.02
0.04
0.06
0.08
0.1
0.12
1 2 3 4 5
Time Period
MFCR Value

180 Gitman/Joehnk/Smart • Fundamentals of Investing, Eleventh Edition
MFCR = Mutual fund cash position/Total assets under management
Mutual Fund Cash (Tril. $)
$0.31
$0.32
$0.47
$0.61
$0.74
Total Assets Managed (Tril. $)
$6.94
$6.40
$6.78
$6.73
$7.42
MFCR
4.5%
5.0%
7.0%
9.0%
10.0%
The MFCR is also positive, again confirming the bullish trend. Funds are holding a large amount of
cash in Period 5 at 10% of total assets. There could be pent-up demand for stocks even with the other
Time period comment: Some students may point to changes in the trends over the five period time
horizon and express concern that they may have missed the trend. This is healthy skepticism and
◼ Answers to CFA Questions (Part III)
1. c