
Chapter 8
Stock Valuation
◼ Outline
Learning Goals
I. Valuation: Obtaining a Standard of Performance
A. Valuing a Company and Its Future
1. Forecasted Sales and Profits
2. Forecasted Dividends and Prices
a. Getting a Handle on the P/E Ratio
b. A Relative Price/Earnings Multiple
c. Estimating Earnings Per Share
d. Pulling It All Together
B. Developing an Estimate of Future Behavior
C. The Valuation Process
1. Required Rate of Return
Concepts in Review
II. Stock Valuation Models
A. The Dividend Valuation Model
1. Zero Growth
2. Constant Growth
a. Applying the Constant-Growth DVM
3. Variable Growth
a. Applying the Variable-Growth DVM
4. Defining the Expected Growth Rate
B. Other Approaches to Stock Valuation
1. Dividends-and-Earnings Approach
2. Finding the Value of Non–Dividend-Paying Stocks
3. Determining Expected Return
4. The Price/Earnings (P/E) Approach
C. Other Price-Relative Procedures
1. A Price-to–Cash-Flow (P/CF) Procedure
2. Price-to-Sales (P/S) and Price-to-Book-Value (P/BV) Ratios
Concepts in Review

Chapter 8 Stock Valuation 143
Summary
Key Terms
Discussion Questions
Problems
Case Problems
8.1 Chris Looks for a Way to Invest His Newfound Wealth
8.2 An Analysis of a High-Flying Stock
Excel with Spreadsheets
◼ Key Concepts
1. The role a company’s future prospects plays in the stock valuation process and a framework for
developing such forecasts
2. Developing a forecast of a stock’s expected cash flow, starting with corporate sales and earnings and
then moving to expected dividends and share prices
3. The concept of intrinsic value as a standard of performance and its use in judging the investment
suitability of a share of common stock
4. Valuation of a stock using zero growth, constant growth, and variable growth dividend valuation
models
5. Other stock valuation models: dividend-and-earnings (D&E) and IRR approaches
6. Price relative measures, including price/earnings, price/cash flow, price/sales, and price/book value
7. Understanding that different valuation models work in different instances depending on the payment
of dividends and earnings persistence
◼ Overview
The topics of stock valuation and security analysis are further considered in this chapter. It is basically a
continuation of the discussion in the preceding chapter. Also addressed are some major changes taking
place in the market, as they affect the valuation process.
1. After analyzing a company’s performance to date, the investor projects the company’s future
performance. Basic performance projections are related to the sales and profits of the company,
subject to various economic and industry projections. Next, estimates of future dividends and stock
prices are obtained. Using the example in the text, the instructor should stress the usefulness and
limitations of historical growth rates in obtaining estimates of the future.
2. The P/E ratio is then extensively discussed, including the relationship between a company’s P/E
ratios and the market’s P/E. This ratio is shown to be a function of the growth of the firm, the risk
associated with that growth, and P/E ratios in the marketplace.
Chapter 8 Stock Valuation 147
◼ Suggested Answers to Discussion Questions
1. Answers will vary by student.
2. (a) 1. The value of a growth stock that pays little or nothing in dividends could be found using a
dividends-and-earnings (D&E) approach.
2. The S&P 500 would best be valued with a constant growth model, since abnormally good
3. All decisions are made in light of future consequences. Shareholder investment decisions are based
upon the future cash inflows arising from their investment. New firm-specific events (i.e., anticipated
4. (a) Increase. The answer depends upon the impact of the dividend payout ratio going up on growth.
If sales and earnings, and consequently cash paid out over time, do not change, as assumed in the
question, receiving investment returns more quickly would be advantageous. Investors also cheer
148 Gitman/Joehnk/Smart • Fundamentals of Investing, Eleventh Edition
(d) Increase. A decrease in the T-bill rate decreases the required rate of return. As the required rate
◼ Solutions to Problems
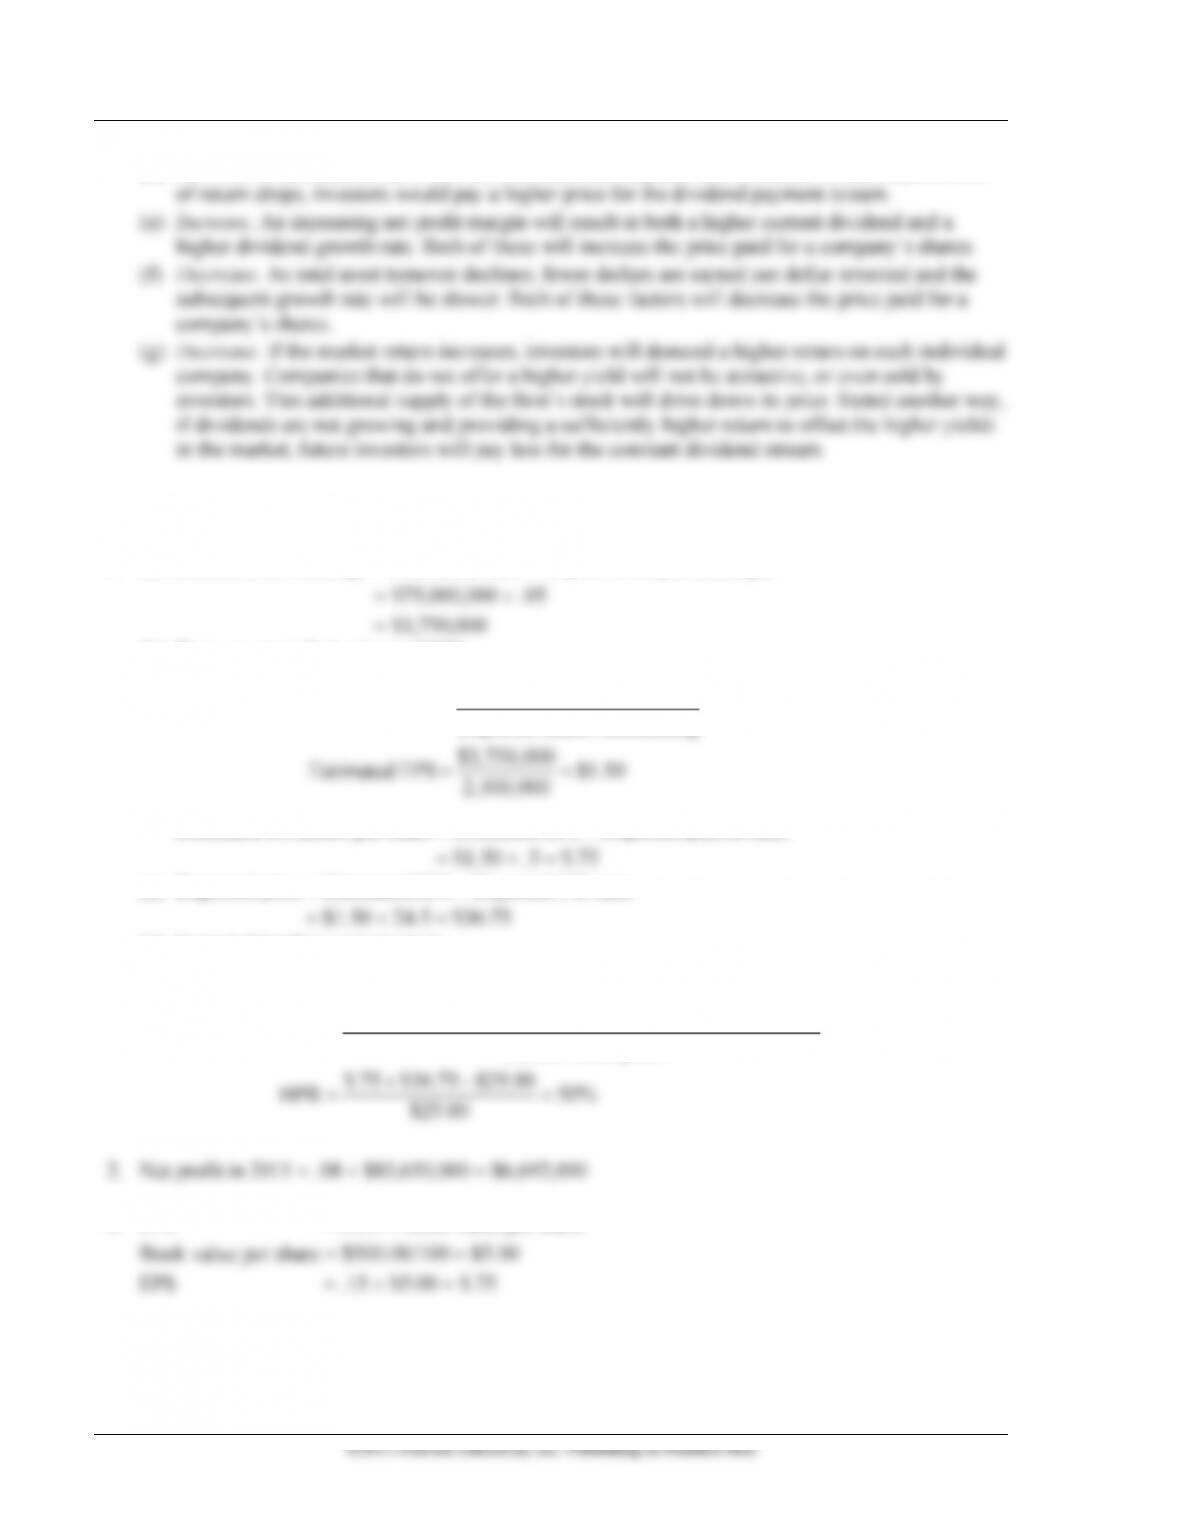
1. (a) Estimated net earnings = Estimated sales Expected net profit margin
(b) First, we must find estimated EPS:
Estimated net earnings
Estimated EPS Expected shares outstanding
$3,750,000
Estimated EPS $1.50
2,500,000
=
==
Estimated dividends per share = Estimated EPS Expected payout ratio
(c) Expected price = Estimated EPS Expected P/E ratio
(d) Expected holding period return:
Future dividend Future sale price Current stock
receipts of stock price
HPR Current stock price
$.75 $36.75 $25.00
HPR 50%
$25.00
+−
=
+−
==
3. EPS = ROE Book value per share
©2011 Pearson Education, Inc. Publishing as Prentice Hall
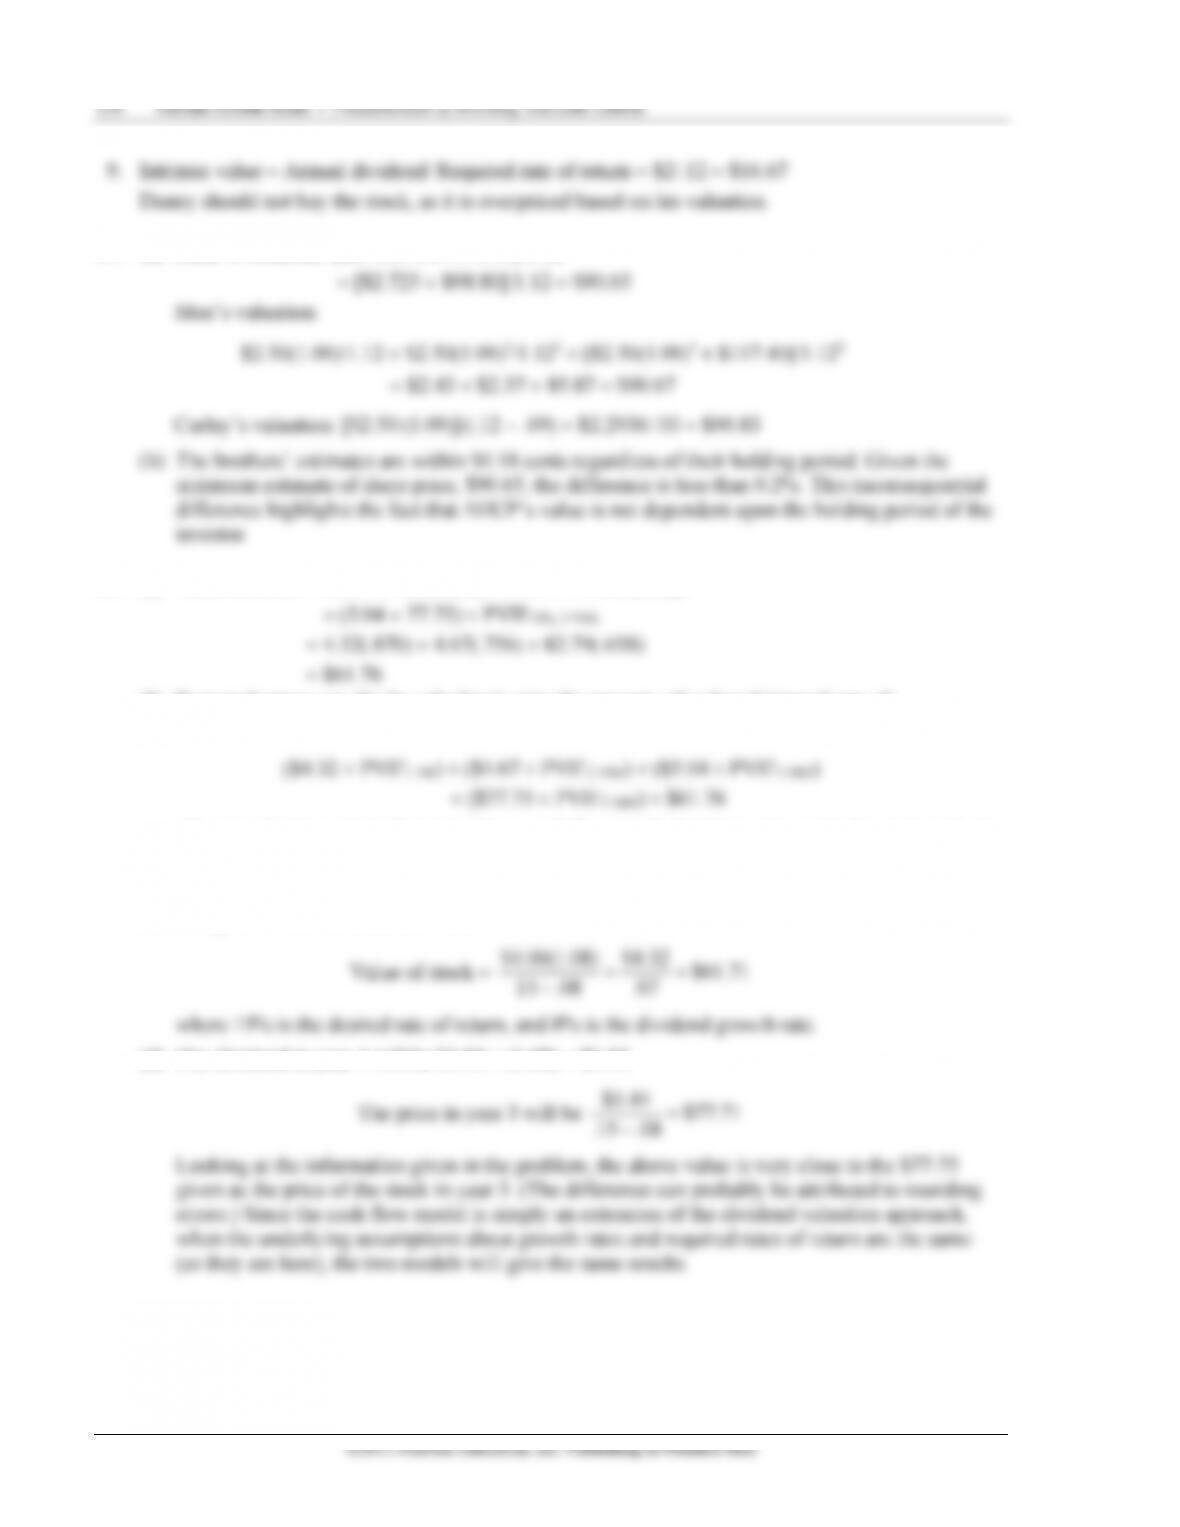
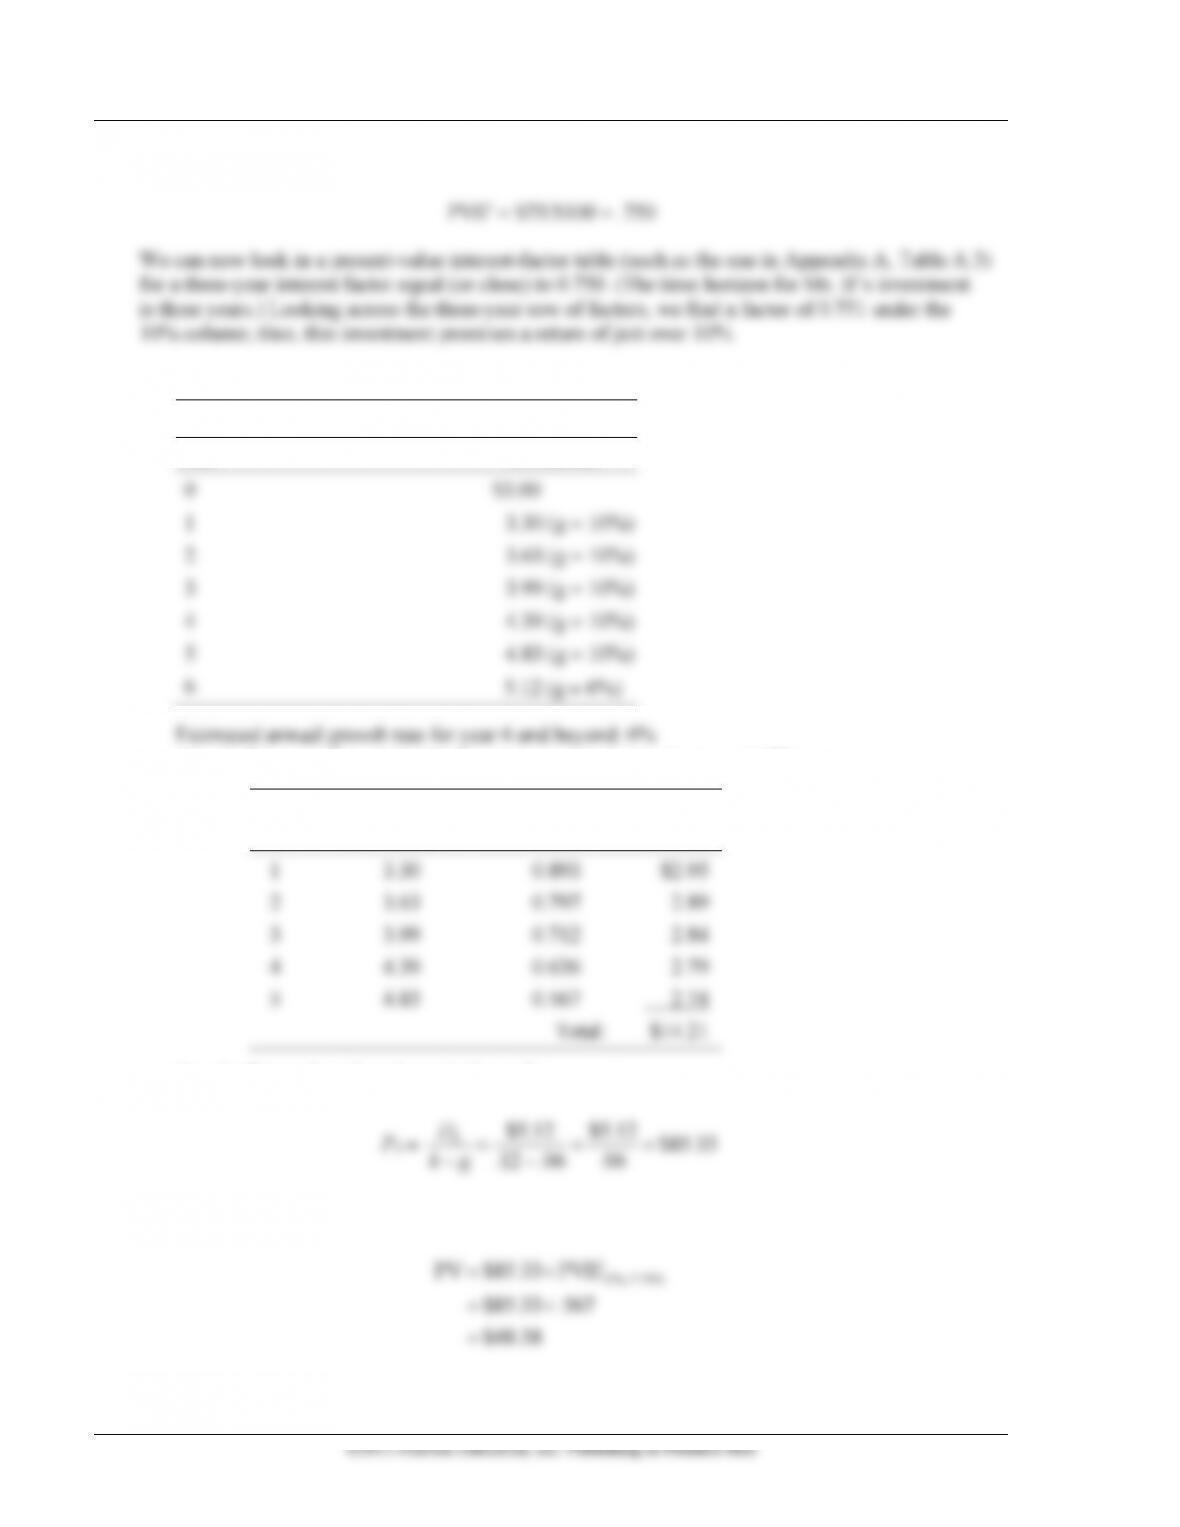
10. (a) Larry’s valuation: [$2.50(1.09) +$98.80]/1.12
11. (a) Value of stock = 4.32 PVIF15%, 1 YR. + 4.67 PVIF15%, 2 YRS.
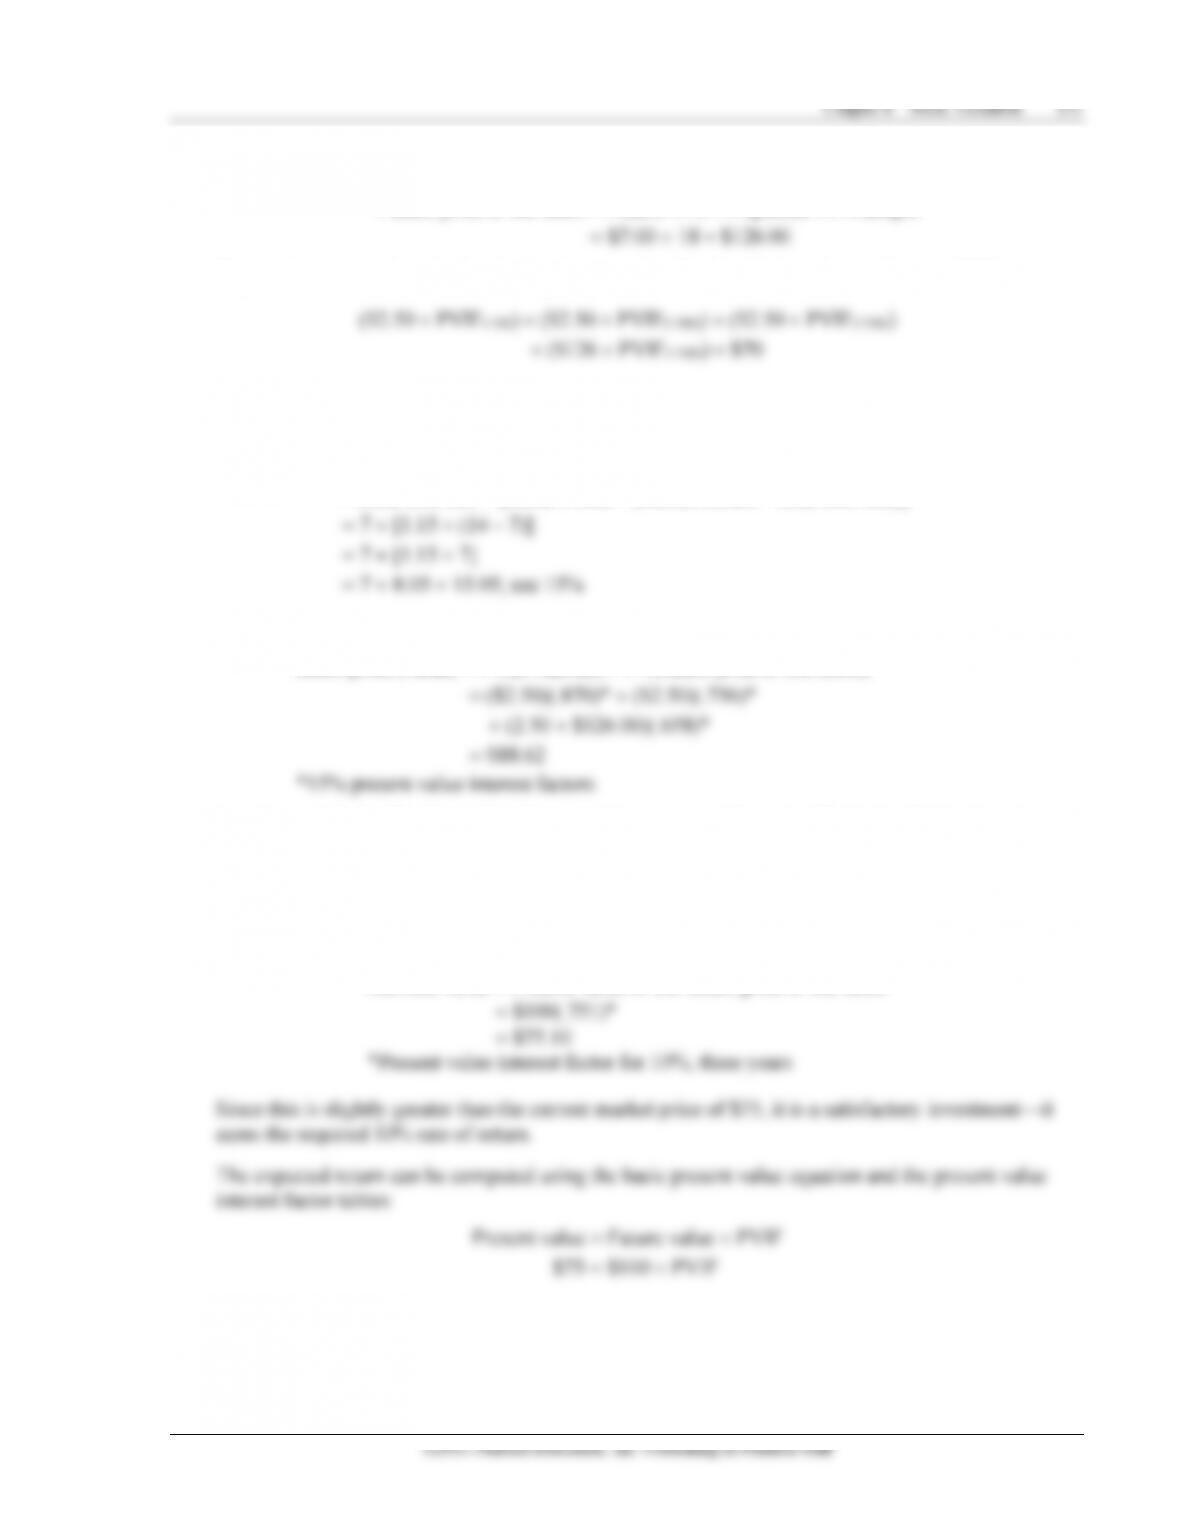
(b) Expected return can also be calculated using the present-value-based internal rate of
return (IRR):
The rate of return which discounts future cash flows such that their sum equals the current stock
price is 15%. This is also the required rate of return used in part (a). Hence, the answer to the
following item has been verified.
(c) Using the dividend valuation model:
$4.00(1.08) $4.32 $61.71
(d) The dividend in year 4 will be $5.04 (1.08) = $5.44.
$5.44 $77.71
152 Gitman/Joehnk/Smart • Fundamentals of Investing, Eleventh Edition
Solving the equation for PVIF:
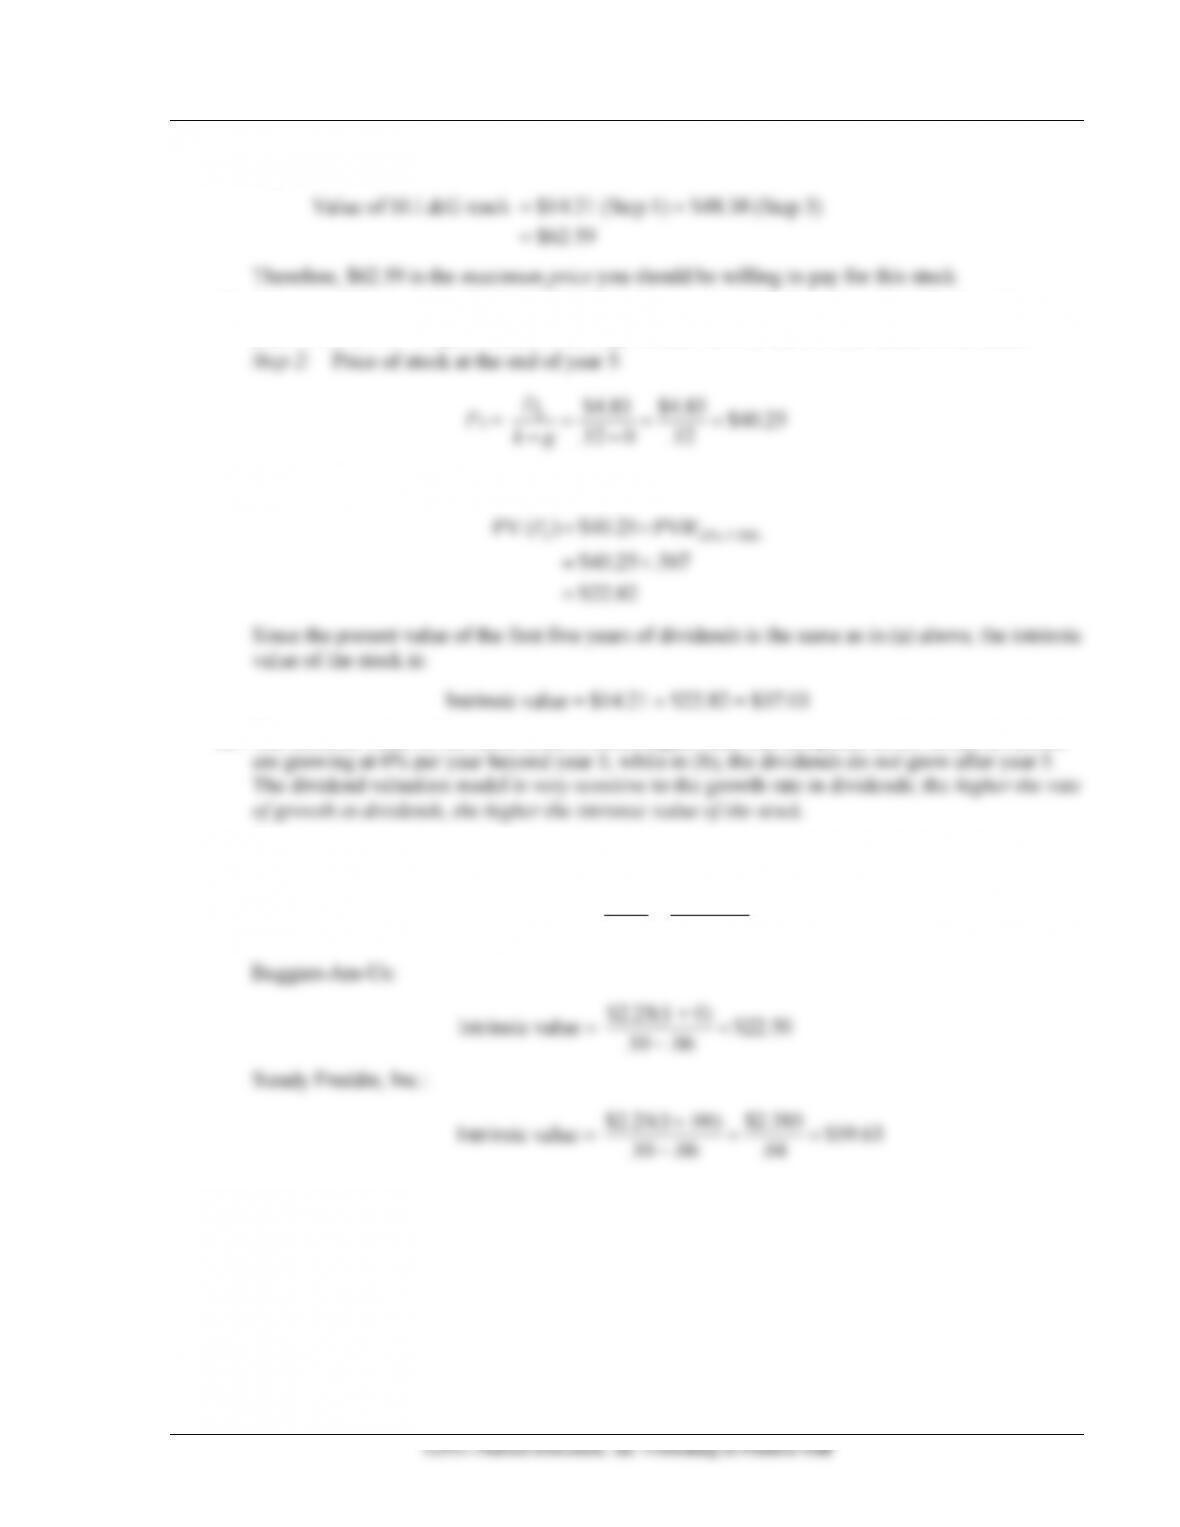
14. (a)
Projected Annual Dividends
Year
Dividends
0
$3.00
1
3.30 (g = 10%)
2
3.63 (g = 10%)
3
3.99 (g = 10%)
4
4.39 (g = 10%)
5
4.83 (g = 10%)
6
5.12 (g = 6%)
Estimated annual growth rate for year 6 and beyond: 6%
Step 1: Present value of dividends using a required rate of return of 12%:
Year
Dividends
PVIF,
12%
Present
Value
1
3.30
0.893
$2.95
2
3.63
0.797
2.89
3
3.99
0.712
2.84
4
4.39
0.636
2.79
5
4.83
0.567
2.74
Total:
$14.21
Step 2: Price of stock at the end of year 5:
6$5.12 $5.12 $85.33
.12 .06 .06
D
kg
−−
Step 3: Present value of the stock price:
12%, 5 YRS.
PV $85.33 PVIF
$85.33 .567
$48.38
=
=
=
Chapter 8 Stock Valuation 153
Step 4:
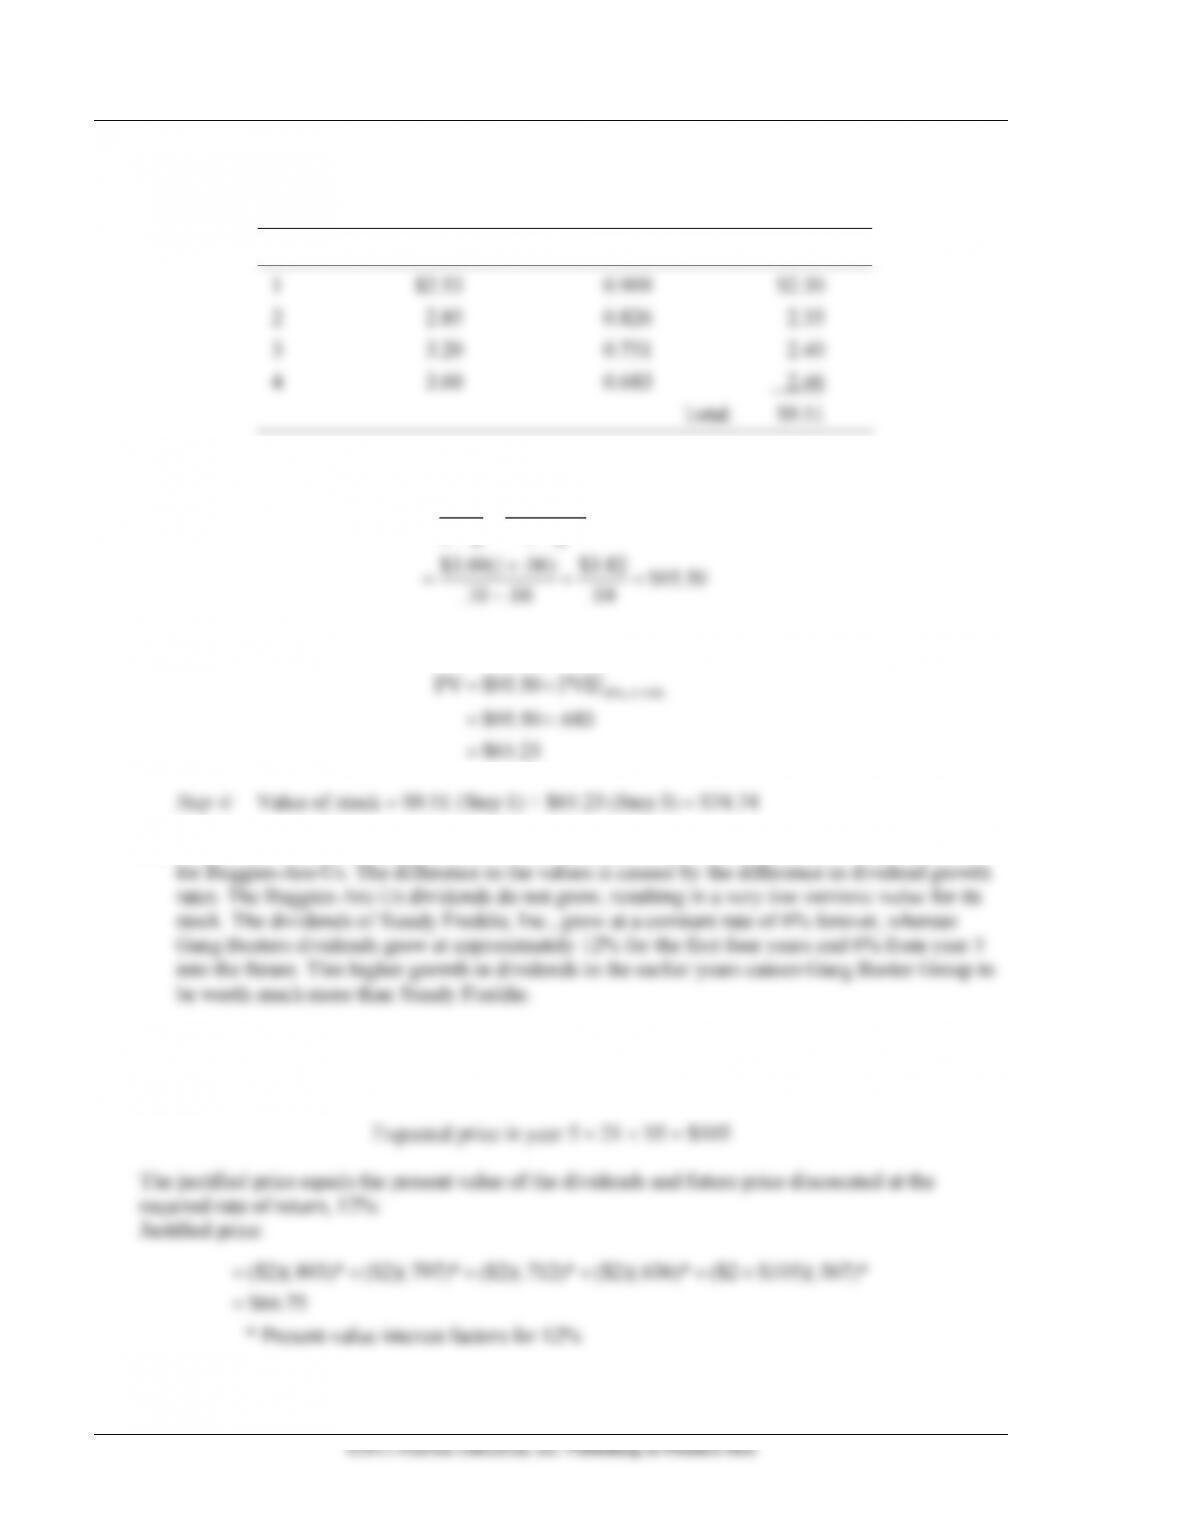
(b) Since g = 0 for year 6 and beyond, dividends for year 6 will be the same as the dividend for
year 5; i.e., $4.83. We just need to redo steps 2 and 3 to find the intrinsic value of the stock:
.12 0 .12
kg
−−
Step 3: Present value of the stock price:
5 12%, 5 YRS.
PV ( ) $40.25 PVIF
$40.25 .567
$22.82
P=
=
=
Since the present value of the first five years of dividends is the same as in (a) above, the intrinsic
value of the stock is:
Intrinsic value = $14.21 + $22.82 = $37.03
(c) The intrinsic value of the stock in (a) is much higher than that computed in (b). In (a), dividends
15. (a) Valuation using the DVM:
Intrinsic value =
0
1(1 )Dg
D
k g k g
+
=
−−
.10 .06 .04
−
154 Gitman/Joehnk/Smart • Fundamentals of Investing, Eleventh Edition
Gang Buster Group:
Step 1: Present value of dividends using a required rate of return of 10%:
Year
Dividends
PVIF, 10%
Present Value
1
$2.53
0.909
$2.30
2
2.85
0.826
2.35
3
3.20
0.751
2.40
4
3.60
0.683
2.46
Total:
$9.51
Step 2: Price of stock at the end of year 4:
54
4(1 )
$3.60(1 .06) $3.82 $95.50
.10 .06 .04
D D g
Pk g k g
+
==
−−
+
= = =
−
Step 3: Present value of the stock price:
10%, 4 YRS.
PV $95.50 PVIF
$95.50 .683
$65.23
=
=
=
Step 4: Value of stock = $9.51 (Step 1) + $65.23 (Step 3) = $74.74
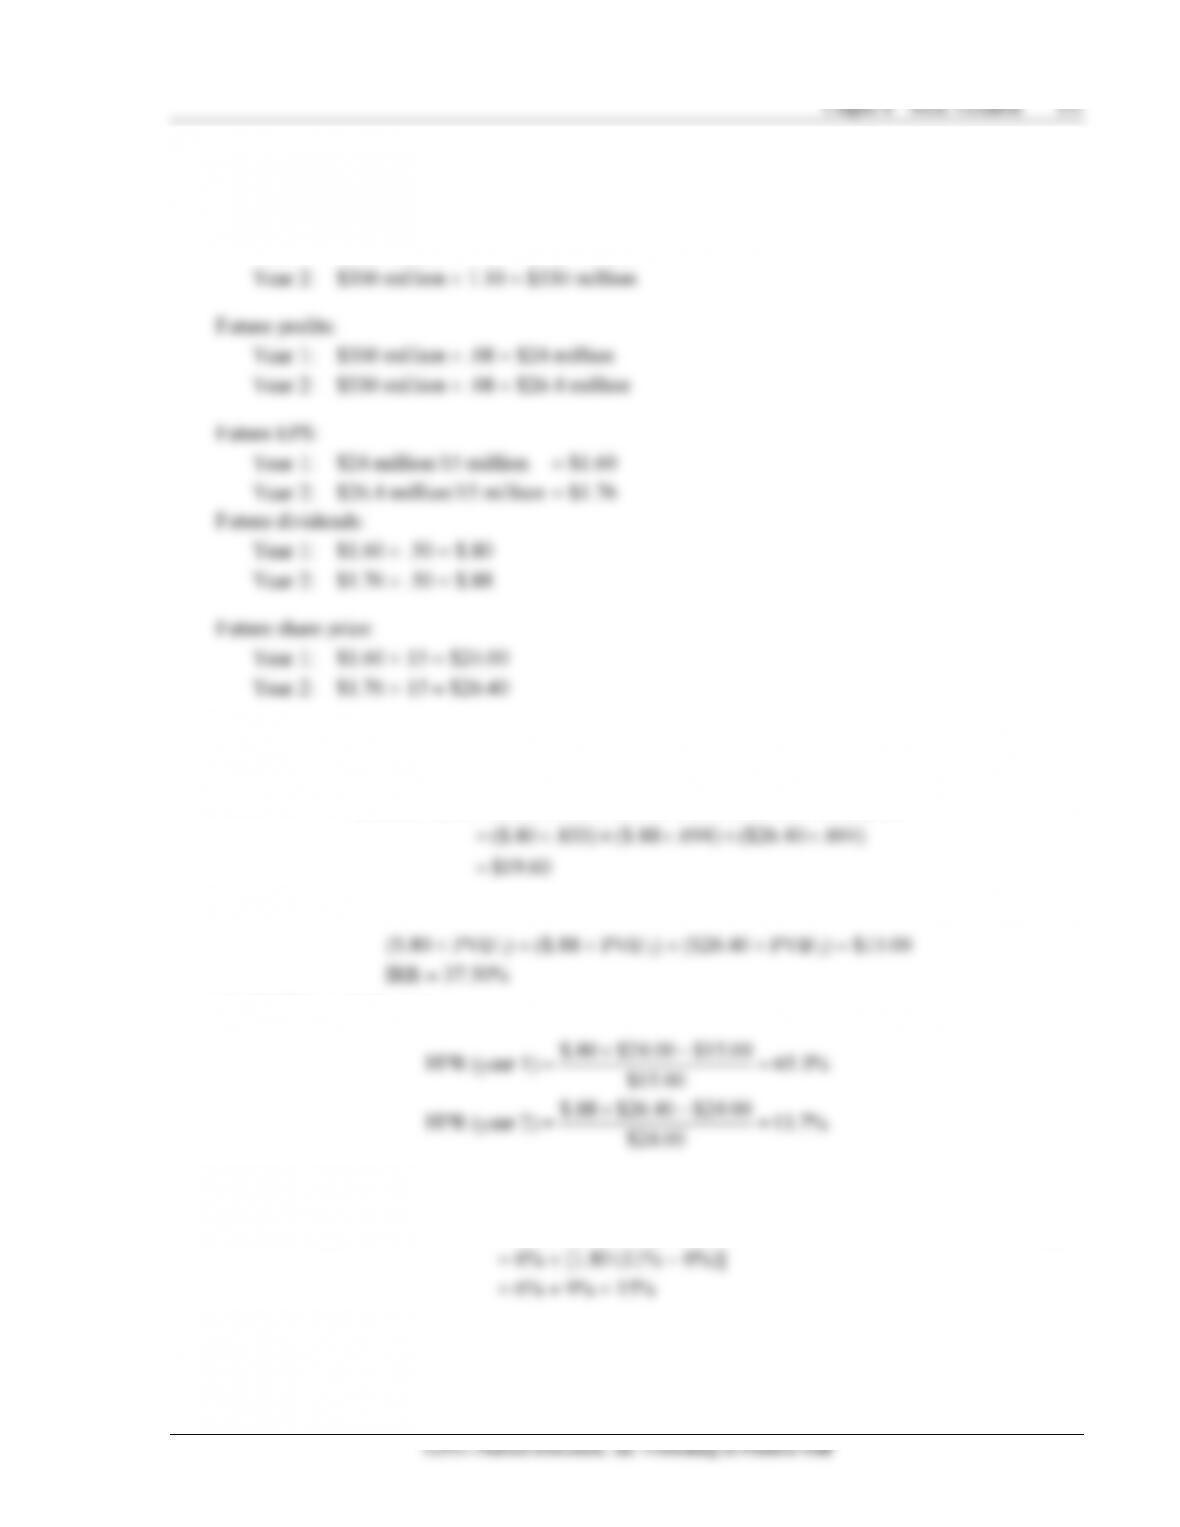
(b) The intrinsic value of Gang Busters is $74.74, compared to $59.63 for Steady Freddie and $22.50
16. To compute the justified price, one needs expected dividends and the expected future price. Expected
annual dividends are given at $2 per share. The expected price is estimated by multiplying the
expected $5 in earnings per share by the expected price earnings ratio of 21:
* Present-value interest factors for 12%
156 Gitman/Joehnk/Smart • Fundamentals of Investing, Eleventh Edition
(ii) Value the stock using the variable growth dividend model:
Value of stock = (D1 PVIF1) + (D2 PVIF2) + (D3 PVIF3) + (D4 PVIF4) + PVIF4
4(1 )Dg
kg
+
−
19. (i) Find the growth rate in dividends:
ROE Firm’s retention rate,
1 Dividend payout ratio
.20 (1 0.4)
.12 or 12%
g rr
rr
g
g
=
=−
= −
=
(ii) Use the constant growth rate dividend model:
Value of the stock in four years =
4(1 )Dg
kg
+
−
$3.00(1.12)
(iii) Value of stock today:
20. In order to value this company, you first need to determine the firm’s ROE, then the growth rate in
dividends, and finally the dividend payment.
Net income $3,750,000 .15 or 15%
.12 .09
kg
−−

Chapter 8 Stock Valuation 161
These books contain daily stock prices for an entire quarter for companies traded on the NYSE, Amex,
and OTC. Obtain the required information (daily high, low, and closing prices) for a period of three to
six months; confine your data gathering to the most recent time period.
Once you’ve collected the data, make the graph. Then observe and study the price trends and patterns you
just graphed. Note how volatile daily prices are. Look for similarities in the patterns or for unusual price
changes. If you want to expand the project, plot the Dow Jones Industrial Average (use just the daily
closing figures) during the period and note how the stock price changes are correlated with the DJIA.
There is a lot of information on a price chart. Remember, some people see this information as very
valuable, and some believe markets are so efficient that what you have graphed is of little or no value.
What is your opinion?