132 Gitman/Joehnk/Smart • Fundamentals of Investing, Eleventh Edition
(d) Both the EPS and P/E drop—to $1.50 and 10 times earnings:
Market price of stock
10 $1.50
Market price of stock $15.00
=
=
(e) As shown in the case of Financial Learning Systems, higher earnings improve the stock price for
a given P/E multiple, and when the P/E multiple rises, for a given level of earnings, the stock
price rises.
10. We will use the following three ratios:
Return on assets = Net profit after taxes/Total assets
Net profit margin = Net profit after taxes/Sales
Note: Or this problem can also be solved by simply multiplying the company’s asset turnover by
its profit margin; i.e., 2 .15 = 30%.
(b) To solve this part of the problem, first find the firm’s equity. We know it has $10 million in
assets and the problem states that 40% of the assets are financed with equity. Therefore:
Chapter 7 Analyzing Common Stocks 133
11. Price/earnings (P/E) ratio =
Market price of the stock
EPS
First, find EPS:
Net profit after taxes
EPS Number of shares of stock outstanding
=
Sales $150,000,000
SPS Number of shares outstanding 5,000,000
$30 per share
==
=
Now the price-sales ratio is:
$25
PSR .833
$30
Dividends per share EPS Dividend payout ratio*
Dividend yield Market price of common Market price of common
$3 .35 $1.05 4.2%
$25 $25
==
==
==
*Note: Dividends per share = EPS Dividend payout ratio
PEG ratio =
Stock‘s P/E ratio
3 5 years growth rate in earnings−
This implies: Growth =
Stock’s P/E Ratio
PEG Ratio
Growth = 8.3/2 = 4.15%
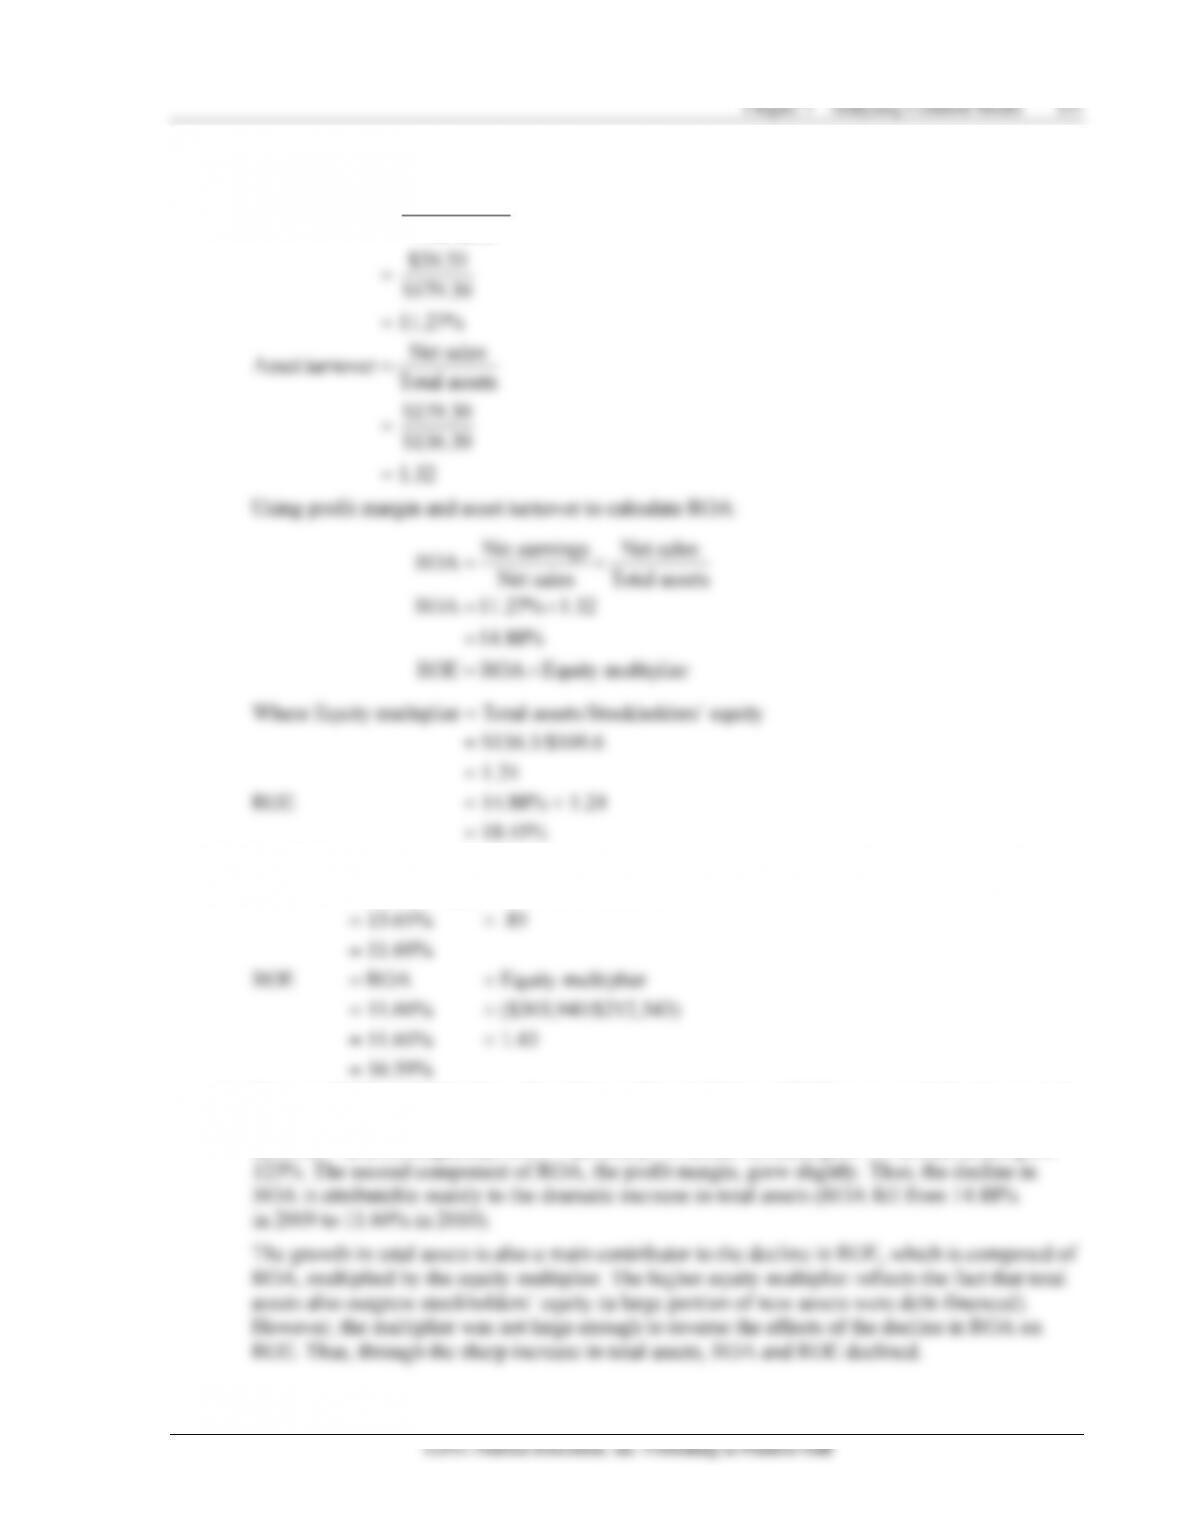
12. ROA = Net profit margin Total asset turnover = .08 2 = .16 or 16%
13. ROE = ROA Equity multiplier
ROA = Net profit margin Total asset turnover
136 Gitman/Joehnk/Smart • Fundamentals of Investing, Eleventh Edition
(9)
Dividend yield
= Dividends per share/Market price per share
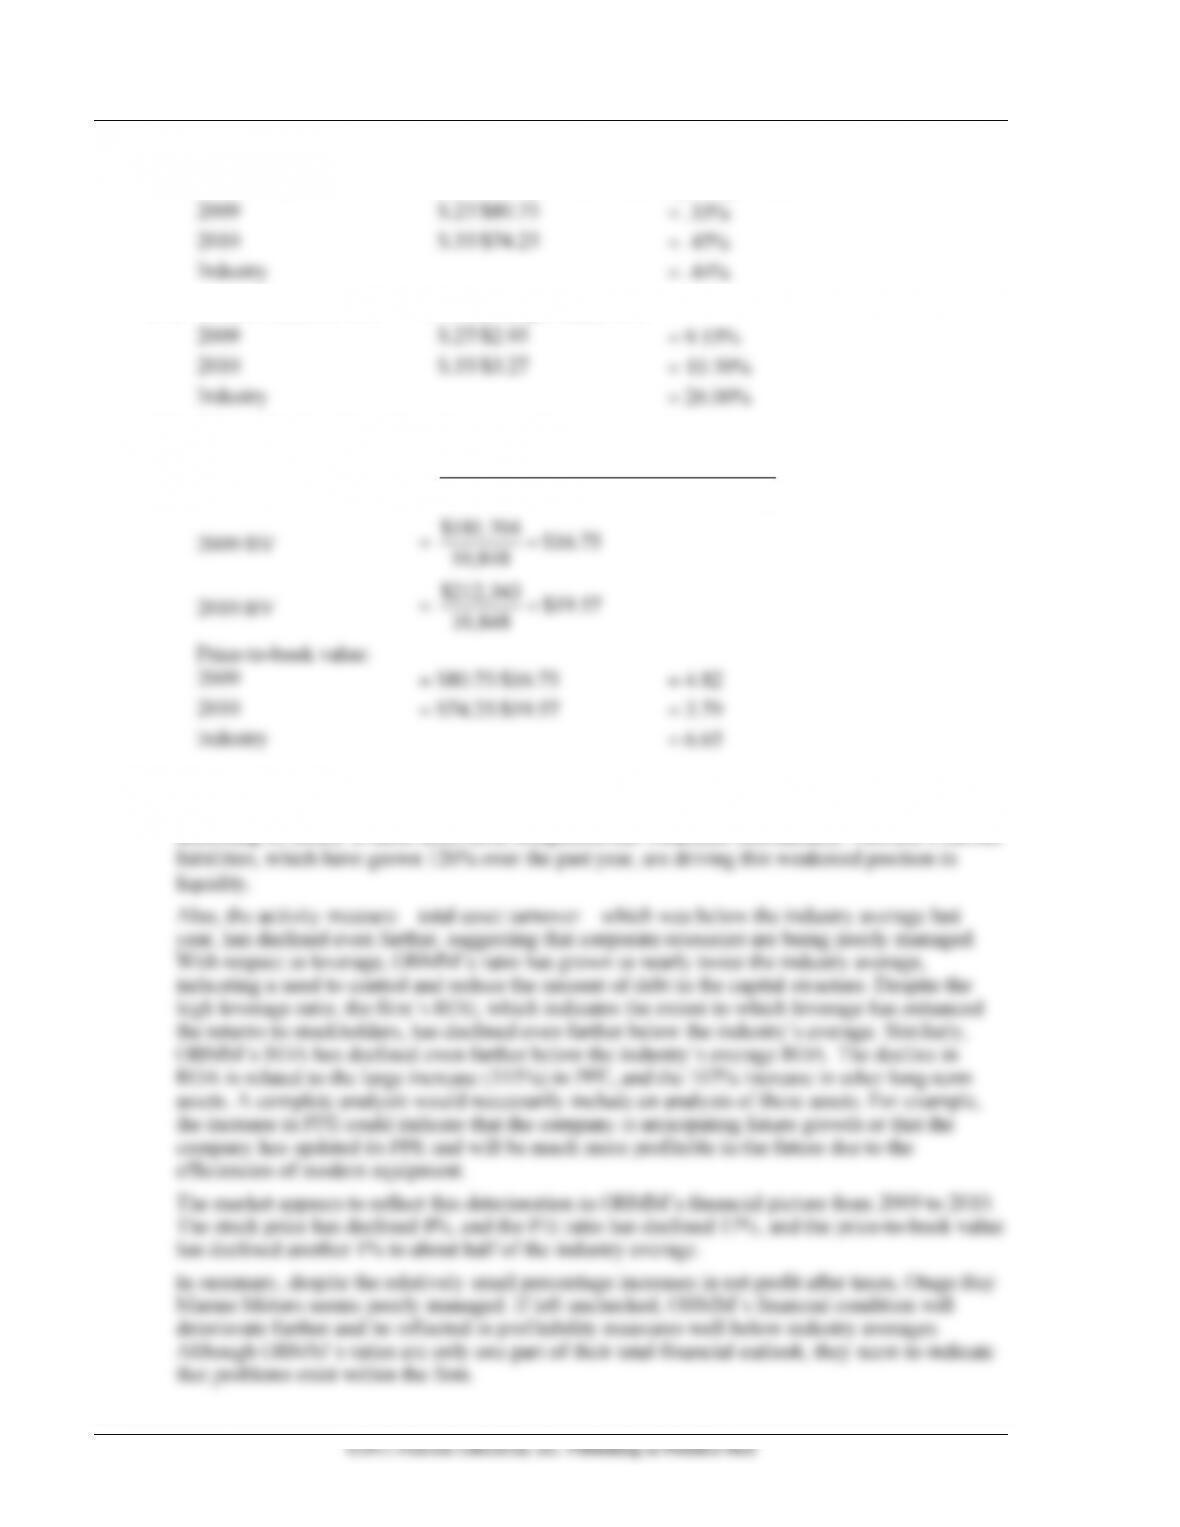
2009
$.27/$80.75
= .33%
2010
$.35/$74.25
= .47%
Industry
= .44%
(10)
Dividend payout ratio
= Dividends per share/EPS
2009
$.27/$2.95
= 9.15%
2010
$.35/$3.27
= 10.70%
Industry
= 26.00%
(11)
Price-to-book-value ratio
= Share price/Book value per share
Book value per share
=
Stockholders’ equity
Number of common shares outstanding
2009 BV
=
$181,704 $16.75
10,848
=
2010 BV
=
$212,343 $19.57
10,848
=
Price-to-book value:
2009
= $80.75/$16.75
= 4.82
2010
= $74.25/$19.57
= 3.79
Industry
= 6.65
(b) Based on the comparison to industry average ratios, the financial condition of Otago Bay Marine
Motors (OBMM) appears to be deteriorating. First, OBMM’s current ratio has declined 63%,
indicating its ability to meet short-term obligations has weakened substantially. OBMM’s current
138 Gitman/Joehnk/Smart • Fundamentals of Investing, Eleventh Edition
(d) Generally, these changes from 2009 to 2010 do not appear fundamentally healthy for Otago Bay
Marine Motors. The increased total assets account, a large percentage of which was financed by
◼ Solutions to Case Problems
Case 7.1 Some Financial Ratios Are Real Eye-Openers
The objective of this case is to have students calculate and interpret ratios as part of the fundamental
analysis of a firm.
1. All the ratios below for South Plains Chemical are computed according to the formulas in the chapter.
South Plains Chemical (dollars in thousands)
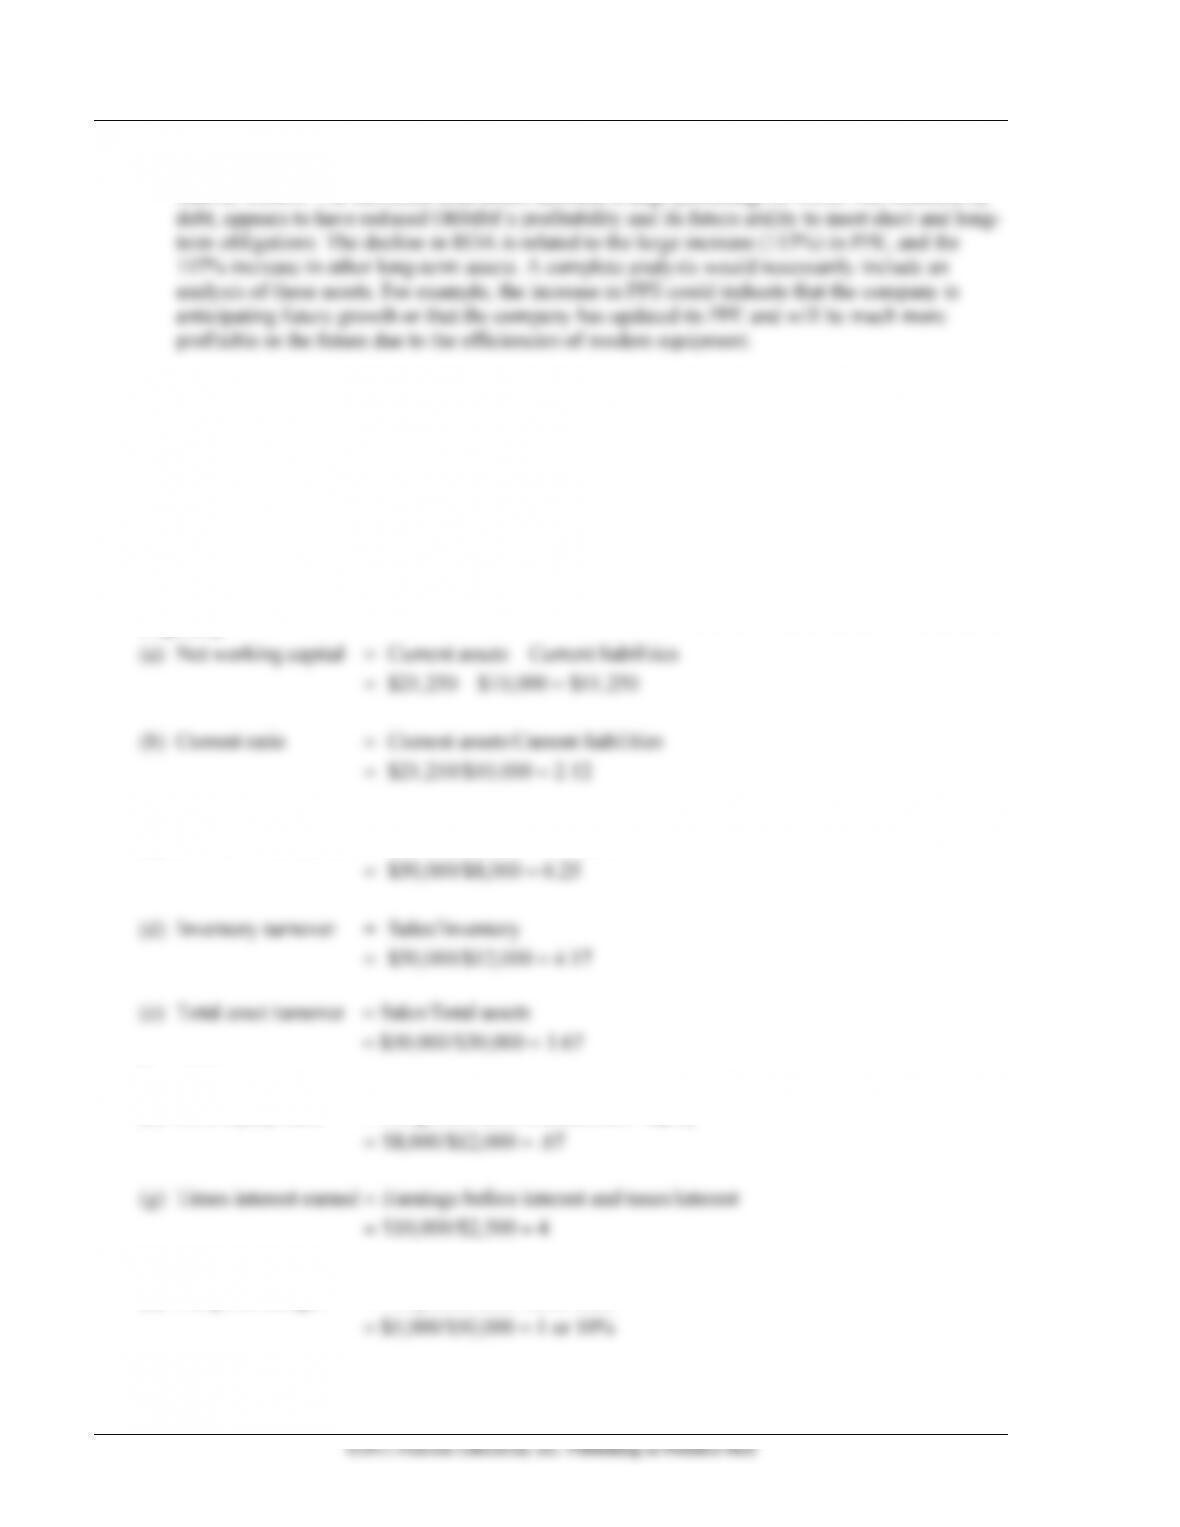
Liquidity
Activity
(c) Receivables turnover = Sales/Accounts receivable
Leverage
(f ) Debt-equity ratio = Long-term debt/Stockholders’ equity
Profitability
(h) Net profit margin = Net profits after taxes/Sales
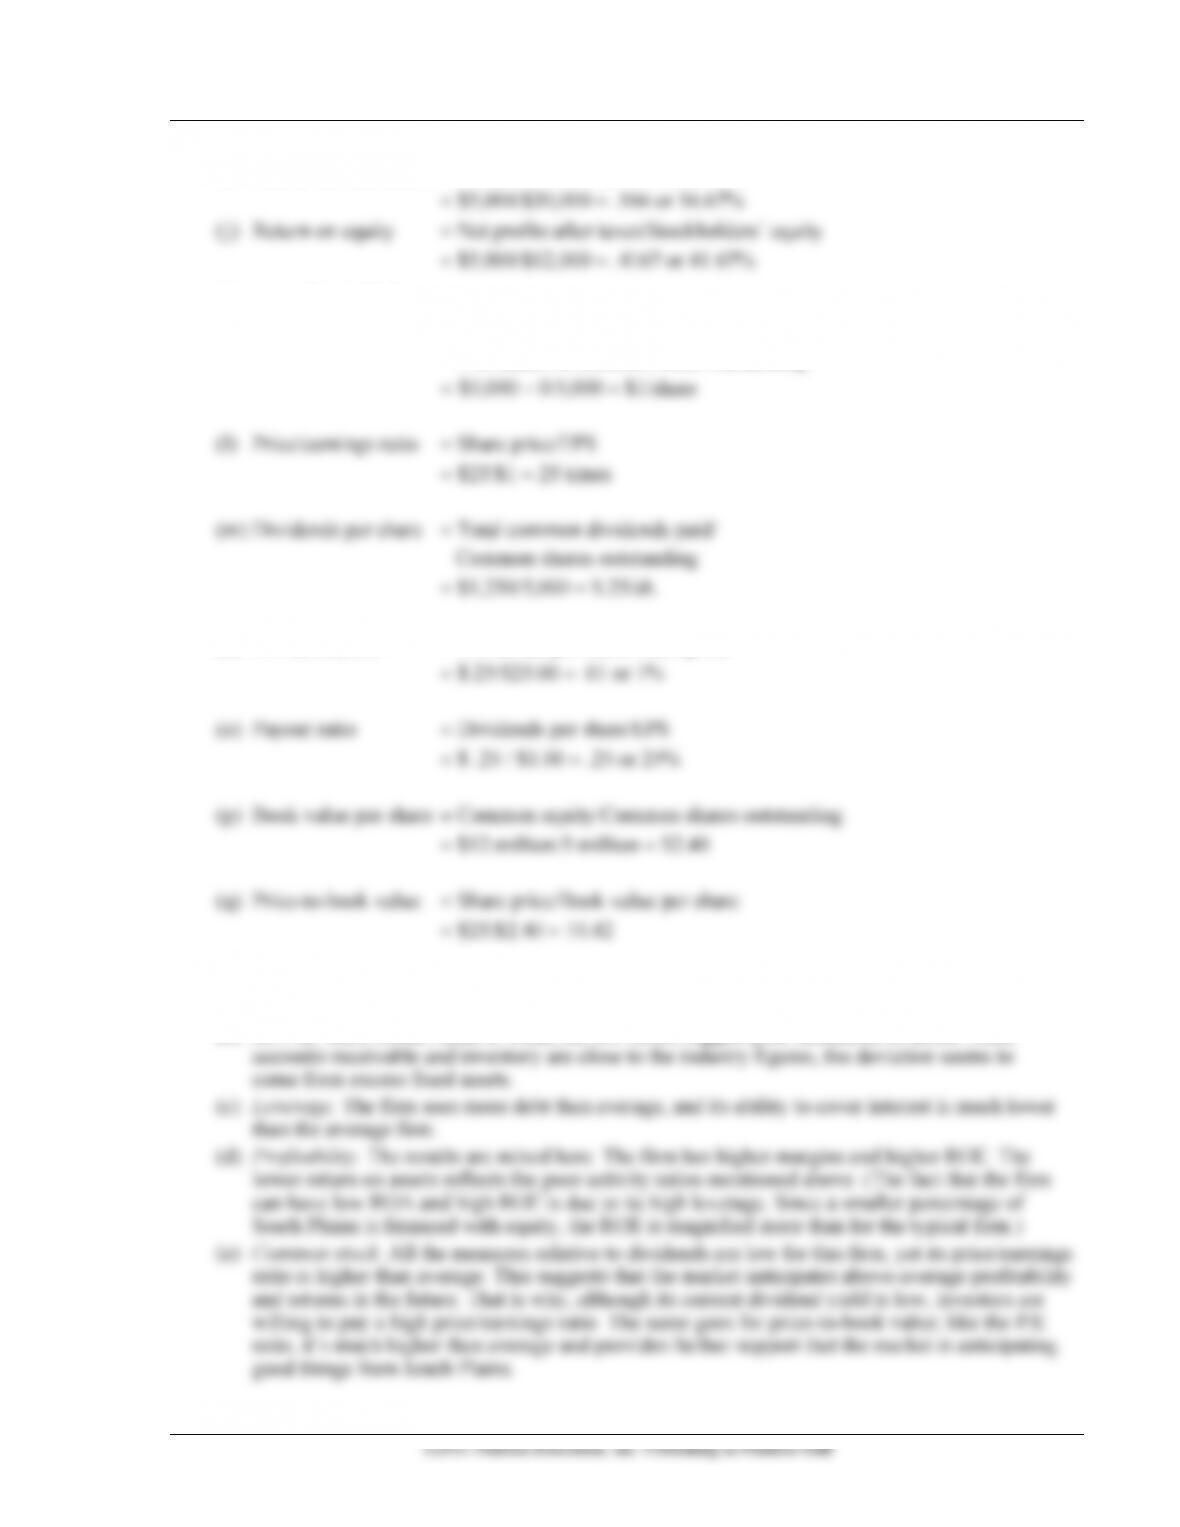
Chapter 7 Analyzing Common Stocks 139
(i) Return on total assets = Net profits after taxes/Total assets
Common Stock Ratios
(k) Earnings per share = (Net profits after taxes – Preferred dividends)/
# of shares of common stock outstanding
(n) Dividend yield = Dividends per share/Share price
2. Comparing the ratios computed in Question 1 to the latest industry averages, we find:
(a) Liquidity. South Plains is more liquid than the average firm in its industry.
(b) Activity. Here South Plains is weak; the low ratios suggest poor utilization of assets. Since

Chapter 7 Analyzing Common Stocks 141
©2011 Pearson Education, Inc. Publishing as Prentice Hall
Sales = 1.5 $25 billion = $37.5 billion
Chapter 7 Analyzing Common Stocks 143
Solving for dividends, we have:
Price per share $37.50
◼ Answer to Chapter Opening Problem
The net profit margin equals net income divided by sales (or revenues). In January 2009, Dell’s net income
◼ Outside Project
Chapter 7 Going to the Source: The Annual Report
Most financial statements and stock valuation examples found in college textbooks tend to be couched in
fairly simple terms. The question that students often ask is: How close to reality are we working? This
project will get you as close to reality as possible by having you look at the actual numbers of a real
corporation.
Get an annual report of any corporation. It does not have to be the most recent one, but it should be a large
company in a nonregulated, nonfinancial industry. Avoid utilities and financial institutions, like banks, as
the accounting for these companies is very different and could be confusing. Companies will usually send
annual reports if you simply ask them, or libraries often have annual report files. Once you have an annual
report, find the income statements and balance sheets, and calculate all the ratios you possibly can. Use the
liquidity, activity, leverage, profitability, and common stock formulas presented in the text. You will have
to look in the financial news for current price and dividend information. Note that there is little value in
knowing a ratio for one year. You need to look at several years, and the annual report will have a 5 or
10 year summary of the most important information. After you’ve run the ratios (you should have the
financial data to run the ratios for at least two years), take a few minutes and analyze your results: What
do the numbers tell you that you like? That you don’t like?
When doing this project, take time to think through and read the report; the annual report is not just
numbers. The discussion of the company by its chairman usually provides information about the recent
past and the prospects for the future; in addition, there’s considerable information in these reports about
product lines, corporate developments, and the like. This report is designed to bring stockholders
up-to-date on company operations. Share your comments and notes about the report with the class.