
Part Two
Important Conceptual Tools
Part Two Includes
Chapter 4 Return and Risk
Chapter 5 Modern Portfolio Concepts

Chapter 4
Return and Risk
◼ Outline
Learning Goals
I. The Concept of Return
A. Components of Return
1. Income
2. Capital Gains (or Losses)
B. Why Return Is Important
1. Historical Performance
2. Expected Return
C. Level of Return
1. Internal Characteristics
2. External Forces
D. Historical Returns
II. The Time Value of Money and Returns
A. Computational Aids for the Use of Time Value Calculations
B. Determining a Satisfactory Investment
Concepts in Review
III. Measuring Return
A. Real, Risk-Free, and Required Returns
B. Holding Period Return
1. Understanding Return Components
2. Computing the Holding Period Return (HPR)
3. Using the HPR in Investment Decisions
C. Yield: The Internal Rate of Return
1. Yield for a Single Cash Flow
a. Calculator Use
b. Spreadsheet Use


Chapter 4 Return and Risk 51
◼ Key Concepts
1. The concept of return, its component parts, and the forces that affect the level of return realized by an
investor; historical returns reviewed
2. Interest income and the concept of time value, its underlying future and present value computations,
and its use in the investment decision-making process
3. Usage of financial calculators, computers, and spreadsheets in measuring risk and return
4. Real, risk-free, and required returns on investments
5. The computation and use of the holding period return and the internal rate of return, and the role yield
can play in the investment decision
6. The sources and basic types of risk, the concept of risk, its positive relationship to return, and its role
in investment decision-making
7. The basic steps involved in evaluating the risk-return characteristics of an investment
◼ Overview
The concepts of return and risk are developed in this chapter. This chapter is conceptually more
demanding than the preceding one, so the instructor should plan to spend more class time on it.
1. Returns are rewards for investing. The components of total return are income and capital gains (or
losses). Income is cash received for holding an investment, whereas capital gains refers to income
that is attributed to an increase—realized or unrealized—in the value of the investment.
2. Expected return motivates a person to invest in a particular vehicle. Expectations of returns are based
on the past returns of that vehicle. Measuring the historical return of a particular investment reveals
its average return as well as the trend of its returns.
3. The level of returns for a particular investment vehicle depends on internal characteristics, such
4. A satisfactory investment is one in which the present value (PV) of benefits (discounted at the
5. The required return of an investment is the rate that compensates the investor for its risk. It is
6. The holding period return (HPR), defined next, is useful in making investment decisions. The
instructor may show the class how HPR is computed, stressing that the HPR from identical periods
should be used when comparing two investments.
Chapter 4 Return and Risk 53
History tells us that stock market returns have averaged well above the interest rates payable on
3. Ignoring risk, a satisfactory investment is one for which the present value of benefits (discounted)
4. (a) The real rate of return is the return earned in a certain, risk-free world. It would equal the
nominal rate of return on a risk-free security less inflation. Historically, it has been relatively
The required rate of return equals the real rate of return plus the expected inflation premium
5. The holding period is simply the period of time over which the investor wishes to measure the return
on an investment. In comparing alternative investments, it is essential to use equal-length holding
6. The yield, or IRR, is the annual rate of return earned by a long-term investment. It is also defined as
Chapter 4 Return and Risk 55
©2011 Pearson Education, Inc. Publishing as Prentice Hall
(g) Event risk is the risk that comes from a largely or totally unexpected event that has a significant
and usually immediate effect on the underlying value of an investment. The effect of this risk
seems to be isolated in most cases, affecting only certain companies and properties.
(h) Market risk is the risk of changes in investment returns caused by factors independent of the
given investment vehicle. It results from factors such as political, economic, and social events, or
changes in investor tastes and preferences.
11. Standard deviation is the most common measure of an asset’s risk. It measures the dispersion of
12. Investors’ attitudes toward risk or their risk-return trade-offs may be classified as one of the following:
Risk-indifferent investors do not require a greater return in exchange for each unit of additional risk.
13. The investment process can be summarized in four steps:
(1) Estimate the expected return over a given holding period using historical data or projected return
data, or both. The time value of these returns must be considered for long-term investments.
◼ Suggested Answers to Discussion Questions
Answers will vary according to student’s selections, tastes, and preferences.
◼ Solutions to Problems

©2011 Pearson Education, Inc. Publishing as Prentice Hall
58 Gitman/Joehnk/Smart • Fundamentals of Investing, Eleventh Edition
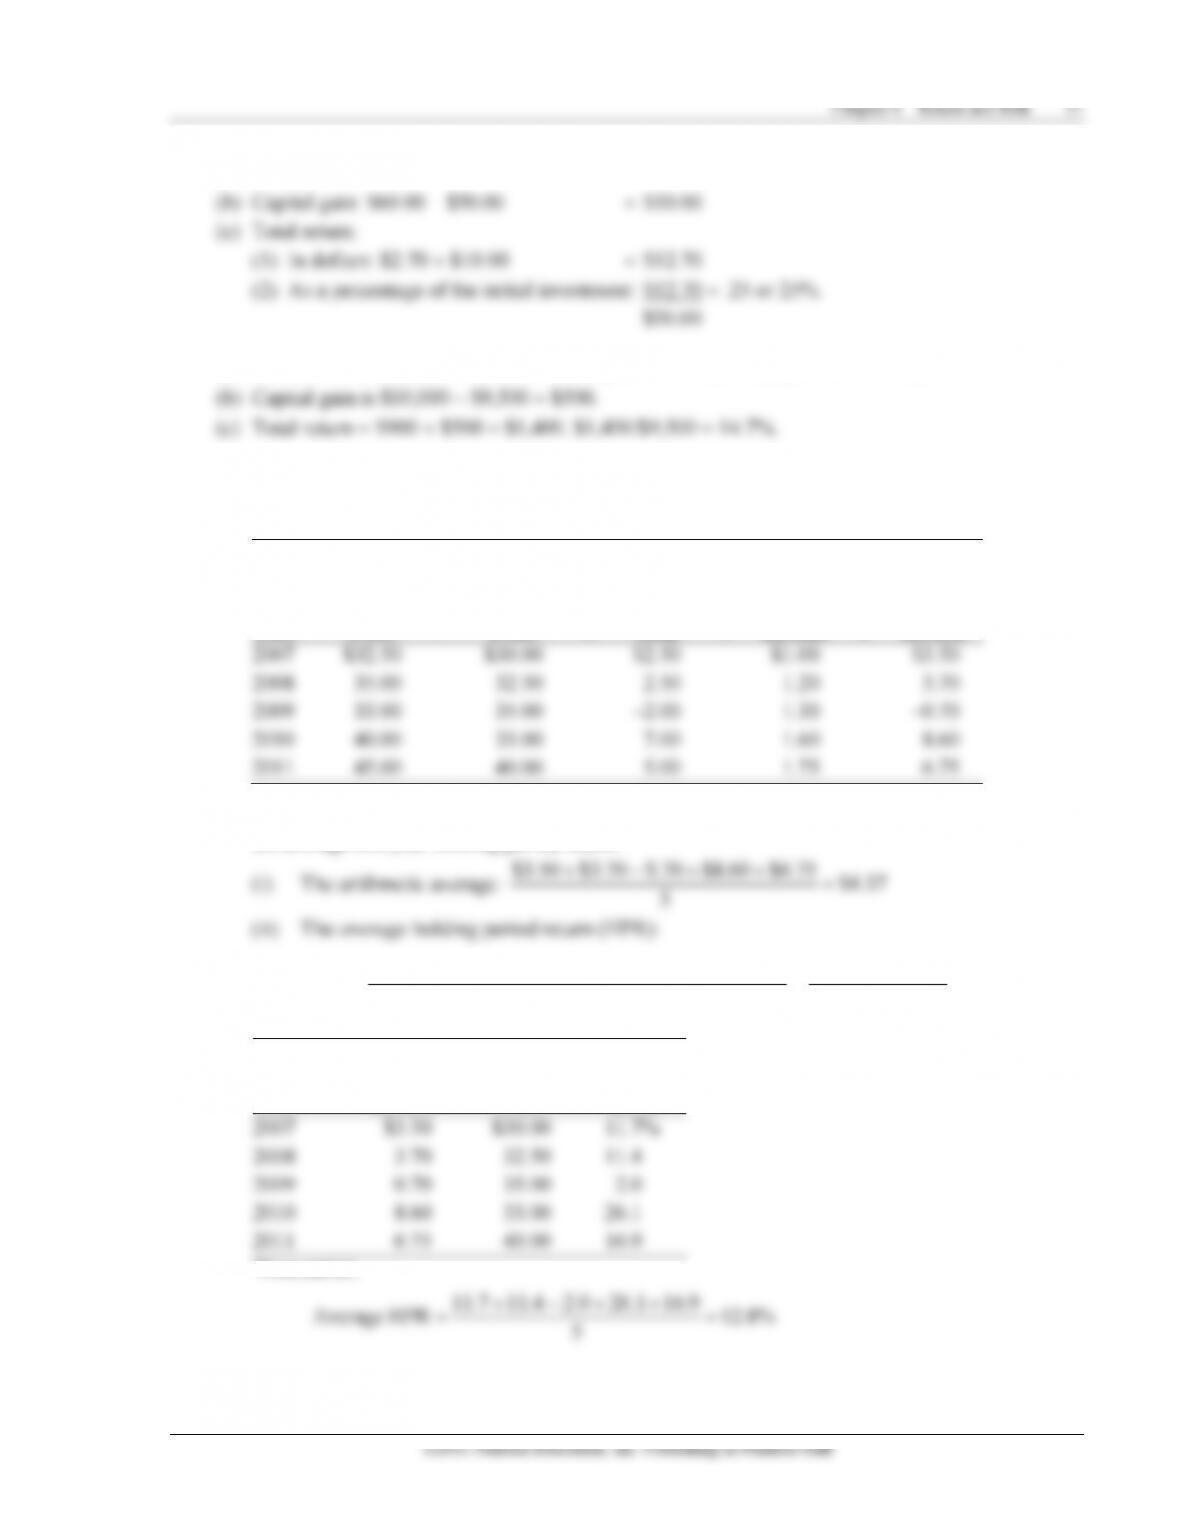
(i)
(ii)
Forecasts
for:
Based on
Arithmetic Average
Based on
Average HPR
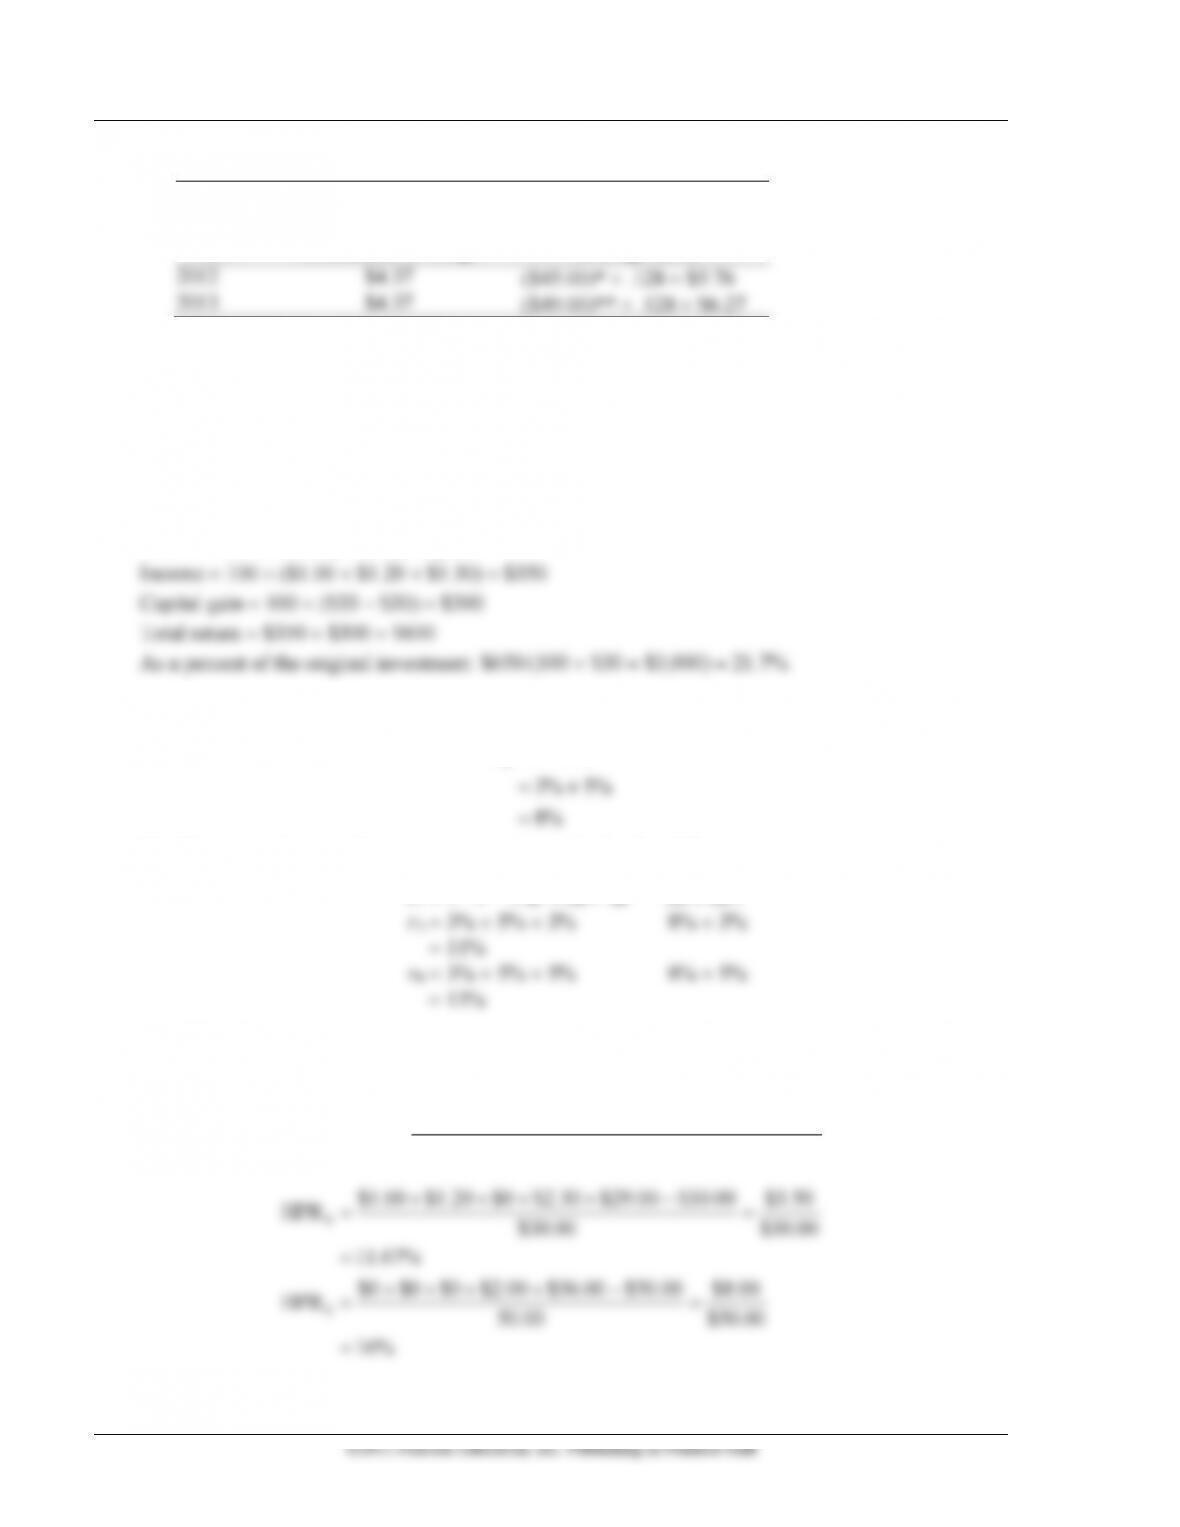
2012
$4.37
($45.00)* .128 = $5.76
2013
$4.37
($49.00)** .128 = $6.27
End of 2005 price gain in original data
For lack of information, we are assuming the 2006 return is $4.00 from capital
gains and $1.76 from income.
(c) Students should be made aware of the fact that many other forecasts are possible. Other factors
may be relevant here: Will the pattern of two good years followed by a bad one continue? Do
future prospects seem bright? (We will discuss forecasting returns on specific investments in
later chapters.)
6. Total return = Income plus capital gains
7. (a) Using the notation given in the chapter, the risk-free rate of interest for both investments is:
=+
=
F* IP
8%
Rr
(b) The required returns for each investment are calculated as follows:
r1 =
*r
*r
+ IP + RPi or RF + RPi
8. The risk-free rate = Real rate + Expected inflation premium. If the expected inflation premium
increases by 1%, then the risk-free rate will increase by 1% to 8%.
9. Holding period return (HPR) =
Current income Ending price Beginning price
Beginning price
+−
+ + + + −
==
=
+ + + + −
==
=
X
Y
$1.00 $1.20 $0 $2.30 $29.00 $30.00 $3.50
HPR $30.00 $30.00
11.67%
$0 $0 $0 $2.00 $56.00 $50.00 $8.00
HPR 50.00 $50.00
16%
Chapter 4 Return and Risk 59
If the investments are held beyond a year, the capital gain (or loss) component would not be realized
and would likely change. Assuming they are of equal risk, Investment Y would be preferred since it
offers the higher return (16.00% for Y versus 11.67% for X).
10. HPR = (Income over the period + Capital gains)/Beginning investment value
The first investment provides the higher annualized return.
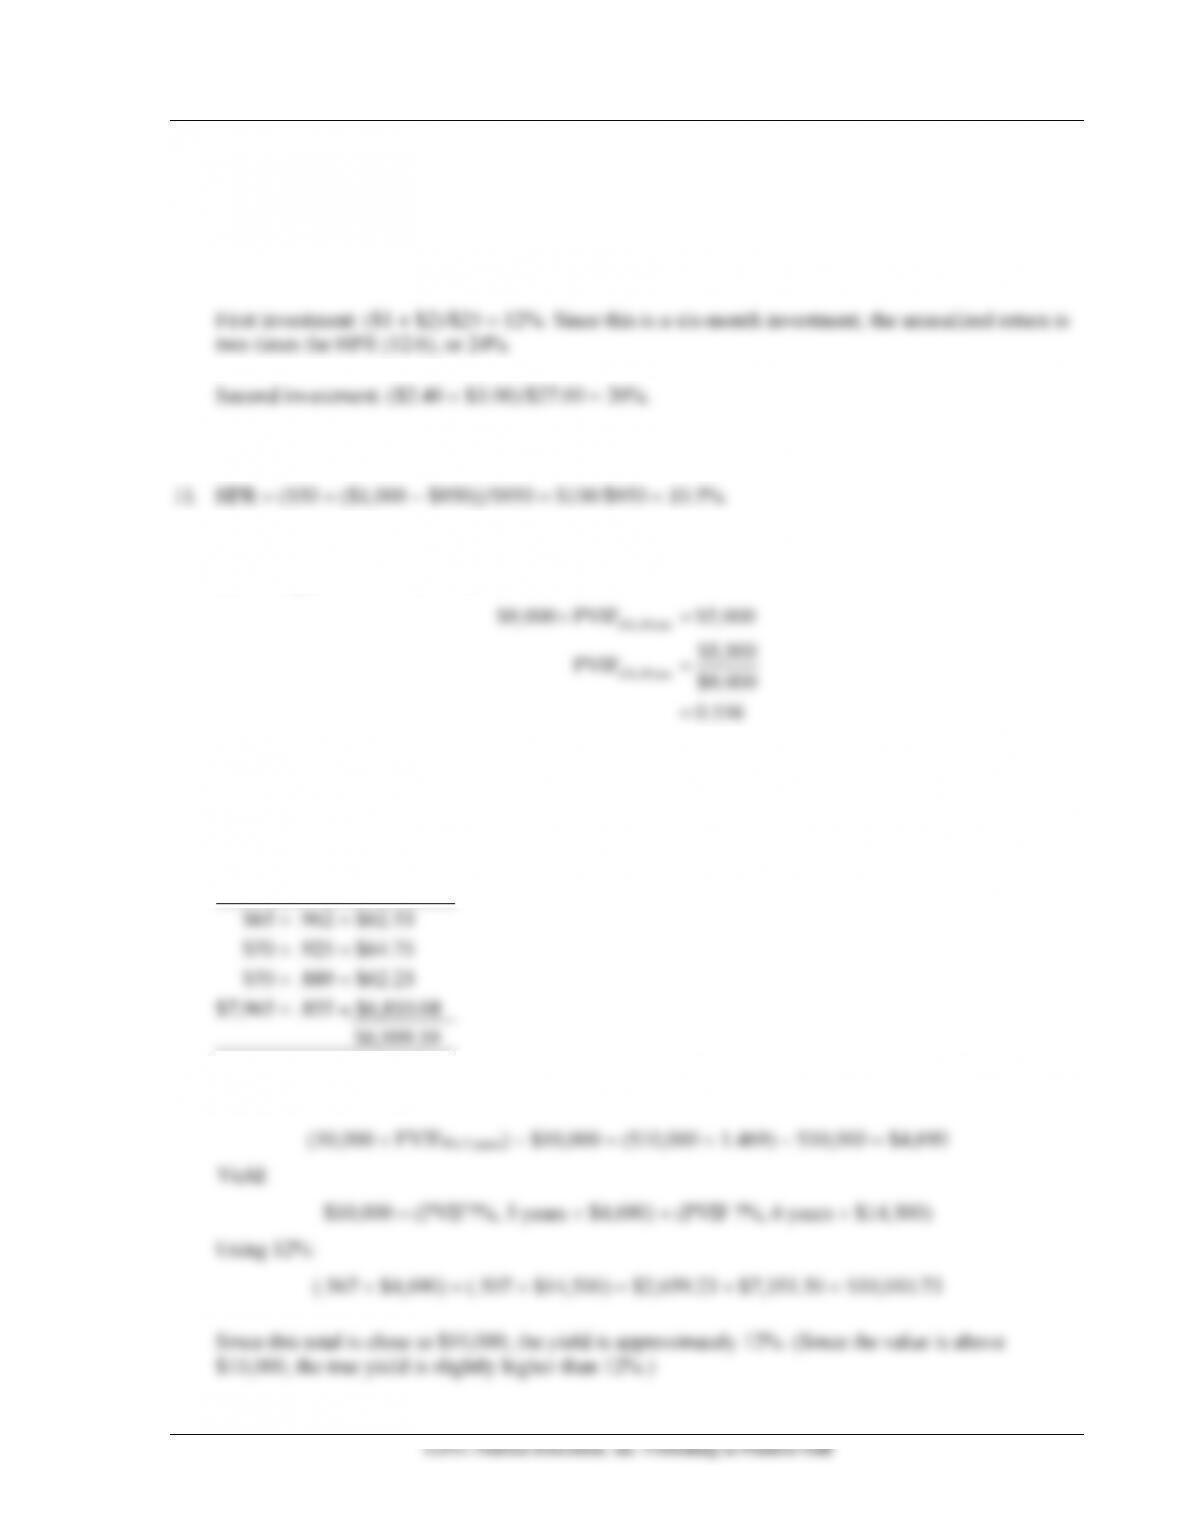
12. The present value is $5,000. The value in 10 years will be $9,000.
(a) Using present value, the yield is calculated as:
=
=
=
x%, 10 yrs.
x%, 10 yrs.
$9,000 PVIF $5,000
$5,000
PVIF $9,000
0.556
From Table A.3, Appendix A, at 10 years the PVIF of 6% is 0.558, which is very close to 0.556.
The yield, then, is estimated to be 6%. (Calculator solution is 6.05%).
(b) If a minimum return of 9% is required, this investment would not be recommended because it
only yields about 6%.
13. Using a present value interest factor of 4%:
$65 .962 = $62.53
$70 .925 = $64.75
$70 .889 = $62.23
$7,965 .855 = $6,810.08
$6,999.59
14. Interest on the investment in year 5:
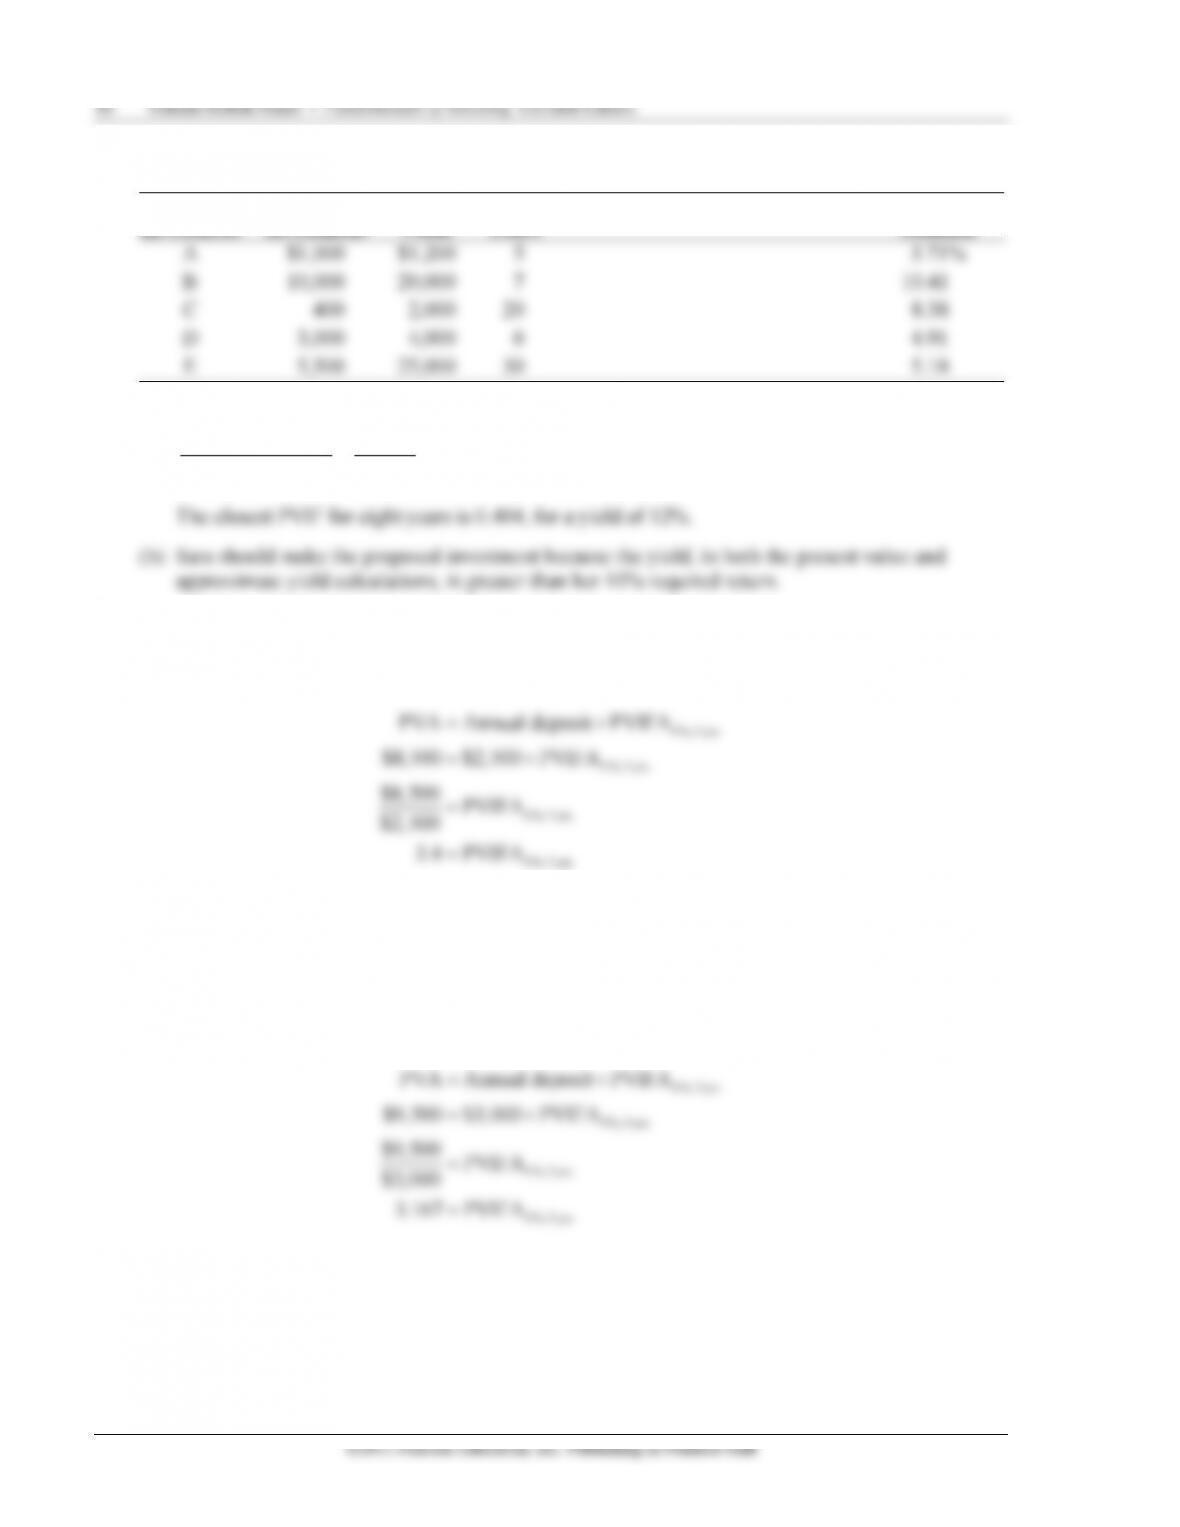
Chapter 4 Return and Risk 61
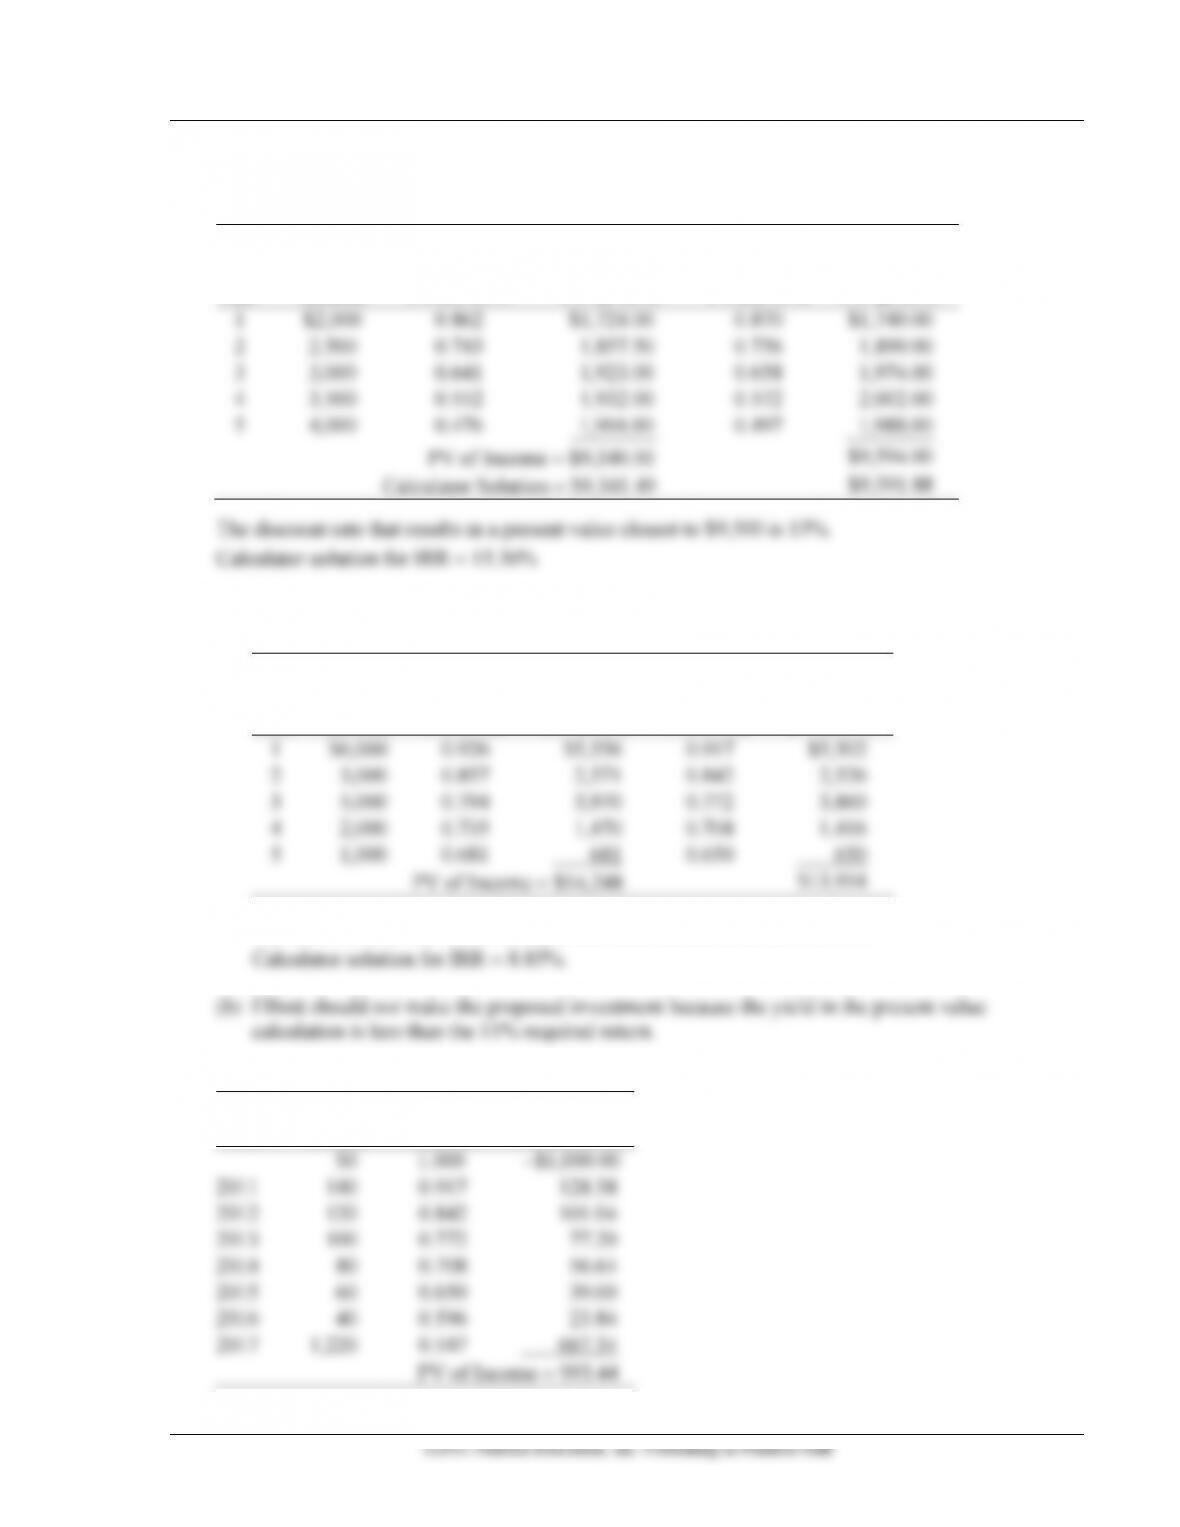
The closest interest rate to 3.167 in Table A.4, Appendix A, is 17%. Because the larger cash flows are
received in the later years, 16% is a good starting point.
(1)
(2)
(3)
(4)
(5)
(1) (4)
Year
Income
PVIF, 16%
PV at 16%
PVIF, 15%
PV at 15%
1
$2,000
0.862
$1,724.00
0.870
$1,740.00
2
2,500
0.743
1,857.50
0.756
1,890.00
3
3,000
0.641
1,923.00
0.658
1,974.00
4
3,500
0.552
1,932.00
0.572
2,002.00
5
4,000
0.476
1,904.00
0.497
1,988.00
PV of Income = $9,340.50
$9,594.00
Calculator Solution = $9,341.49
$9,591.88
The discount rate that results in a present value closest to $9,500 is 15%.
Calculator solution for IRR = 15.36%
18. (a) Using the same technique as shown in the prior question, we find that 7% is a possible discount
rate. Because the larger cash flows occur in the early years, 8% is a good starting point.
(1)
(2)
(3)
(4)
(5)
(1) (2)
(1) (4)
Year
Income
8% PVIF
PV at 8%
9% PVIF
PV at 9%
1
$6,000
0.926
$5,556
0.917
$5,502
2
3,000
0.857
2,571
0.842
2,526
3
5,000
0.794
3,970
0.772
3,860
4
2,000
0.735
1,470
0.708
1,416
5
1,000
0.681
681
0.650
650
PV of Income = $14,248
$13,954
The discount rate that results in a present value closest to $14,000 is 9%.
19.
End of
(1)
(2)
(3)
Year
Income
9% PVIF
PV at 9%
$0
1.000
–$1,000.00
2011
140
0.917
128.38
2012
120
0.842
101.04
2013
100
0.772
77.20
2014
80
0.708
56.64
2015
60
0.650
39.00
2016
40
0.596
23.84
2017
1,220
0.547
667.34
PV of Income = $93.44
62 Gitman/Joehnk/Smart • Fundamentals of Investing, Eleventh Edition
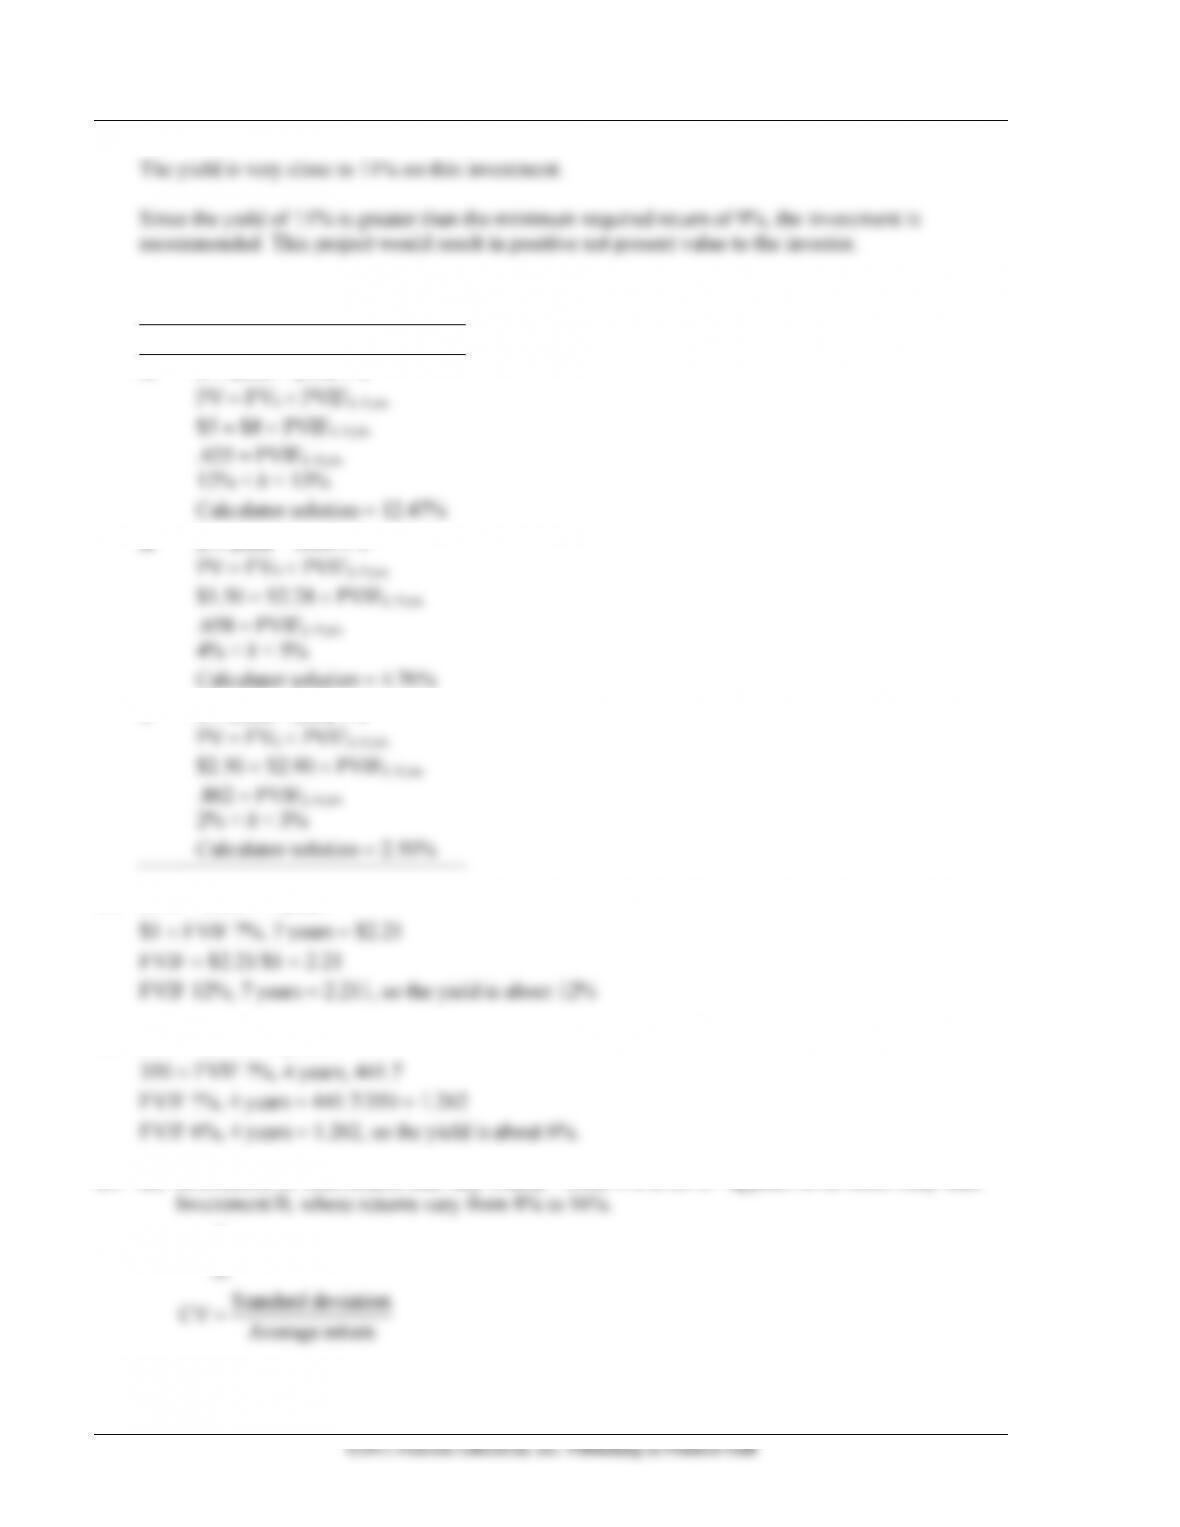
The yield is very close to 11% on this investment.
Since the yield of 11% is greater than the minimum required return of 9%, the investment is
recommended. This project would result in positive net present value to the investor.
20. Growth rates are calculated using the present value formula: PV = FVn PVIFk,n.
Investment
A
n = 2008 – 2004 = 4
PV = FV4 PVIFk, 4 yrs.
$5 = $8 PVIFk, 4 yrs.
.625 = PVIFk, 4 yrs.
12% < k < 13%
Calculator solution = 12.47%
B
n = 2008 – 1999 = 9
PV = FV9 PVIFk, 9 yrs.
$1.50 = $2.28 PVIFk, 9 yrs.
.658 = PVIFk, 9 yrs.
4% < k < 5%
Calculator solution = 4.76%
C
n = 2008 – 2002 = 6
PV = FV6 PVIFk, 6 yrs.
$2.50 = $2.90 PVIFk, 6 yrs.
.862 = PVIFk, 6 yrs.
2% < k < 3%
Calculator solution = 2.50%
21. 2010 – 2003 = 7 years
22. 2010 – 2006 = 4 years
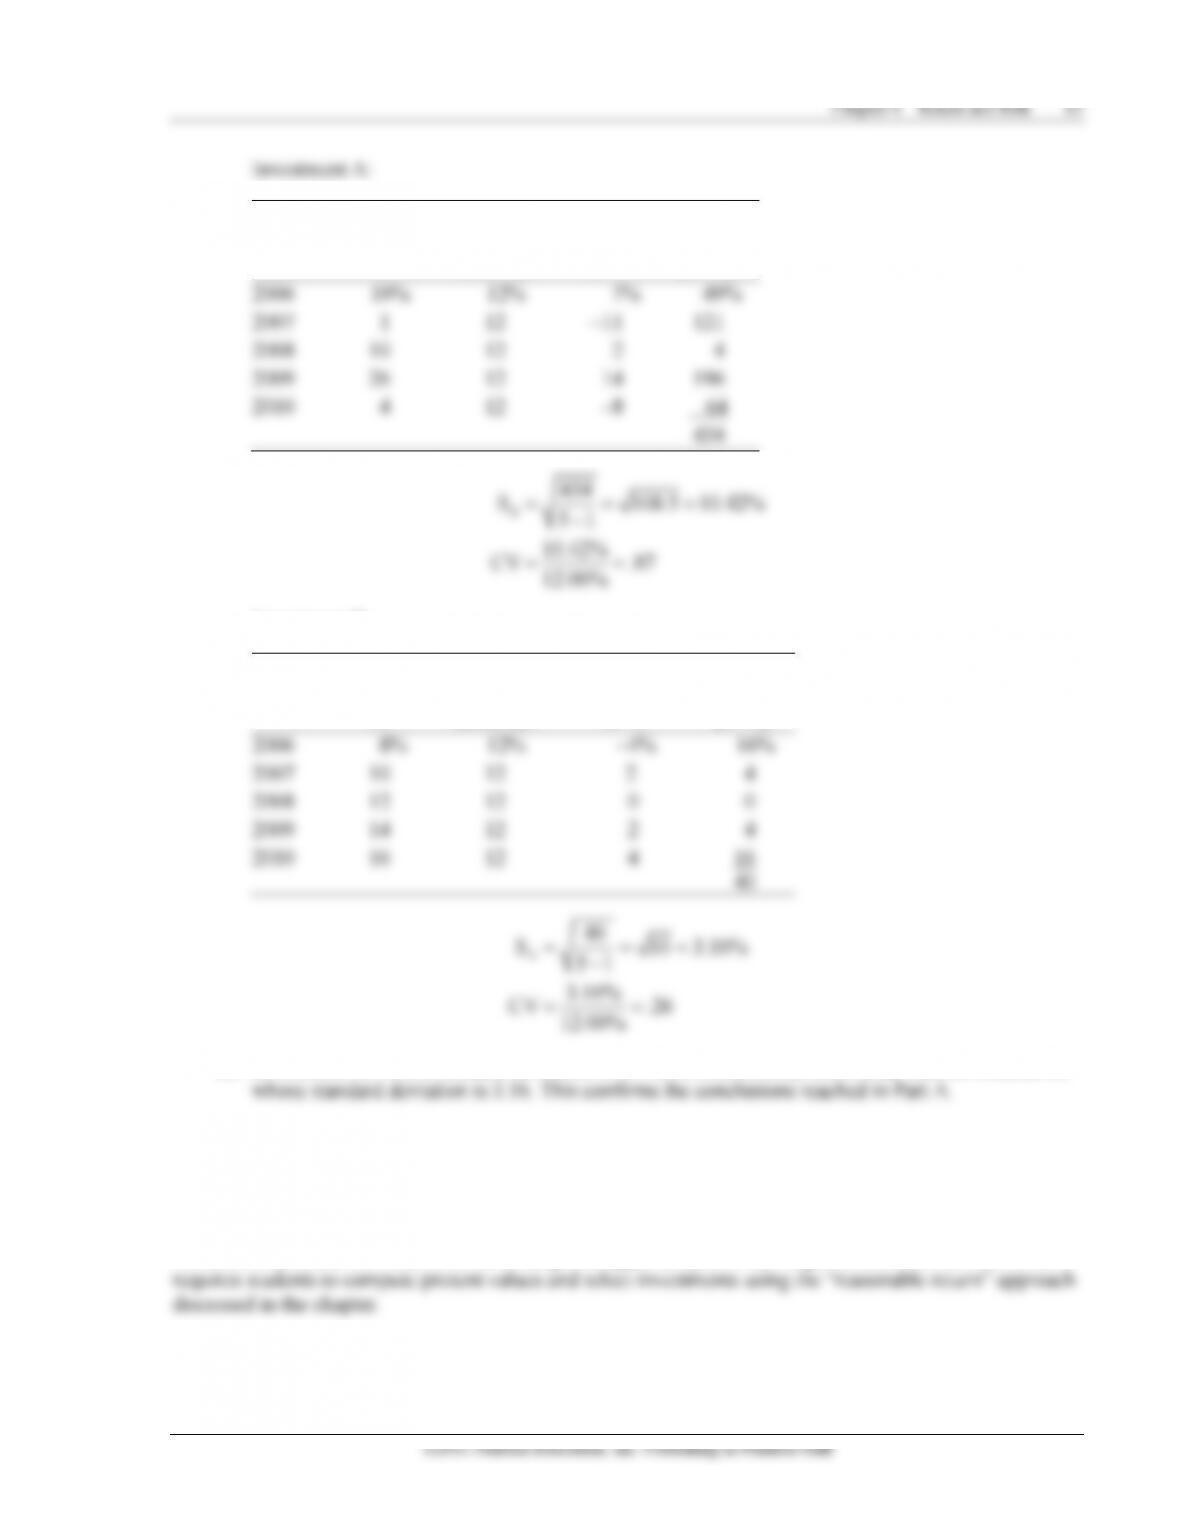
23. (a) Investment A, with returns that vary widely—from 1% to 26%—appears to be more risky than
(b)
2
1
()
n
i
s r r
=
=−
Standard deviation
©2011 Pearson Education, Inc. Publishing as Prentice Hall
(1)
(2)
(3)
(4)
Return
Average
(1) – (2)
(3)2
Year
r I
Return, r
ri – r
(ri – r)2
2006
19%
12%
7%
49%
2007
1
12
–11
121
2008
10
12
–2
4
2009
26
12
14
196
2010
4
12
–8
64
434
= = =
−
==
A
434
S 108.5 10.42%
10.42%
CV .87
12.00%
Investment B:
(1)
(2)
(3)
(4)
Year
Return
Average
(1) – (2)
(3)2
r i
Return, r
ri – r
(ri – r)2
2006
8%
12%
–4%
16%
2007
10
12
–2
4
2008
12
12
0
0
2009
14
12
2
4
2010
16
12
4
16
40
= = =
−
==
A
40
S 10 3.16%
3.16%
CV .26
12.00%
(c) Investment A, with a standard deviation of 10.42, is considerably more risky than Investment B,
◼ Solutions to Case Problems
Case 4.1 Coates’ Decision
This case introduces the student to the concepts of opportunity cost and required rate of return. It further
64 Gitman/Joehnk/Smart • Fundamentals of Investing, Eleventh Edition
(a) Using the present value technique for the equally risky projects, we select the one with the highest
=+
=
$799.20 $370.30
$1,169.50
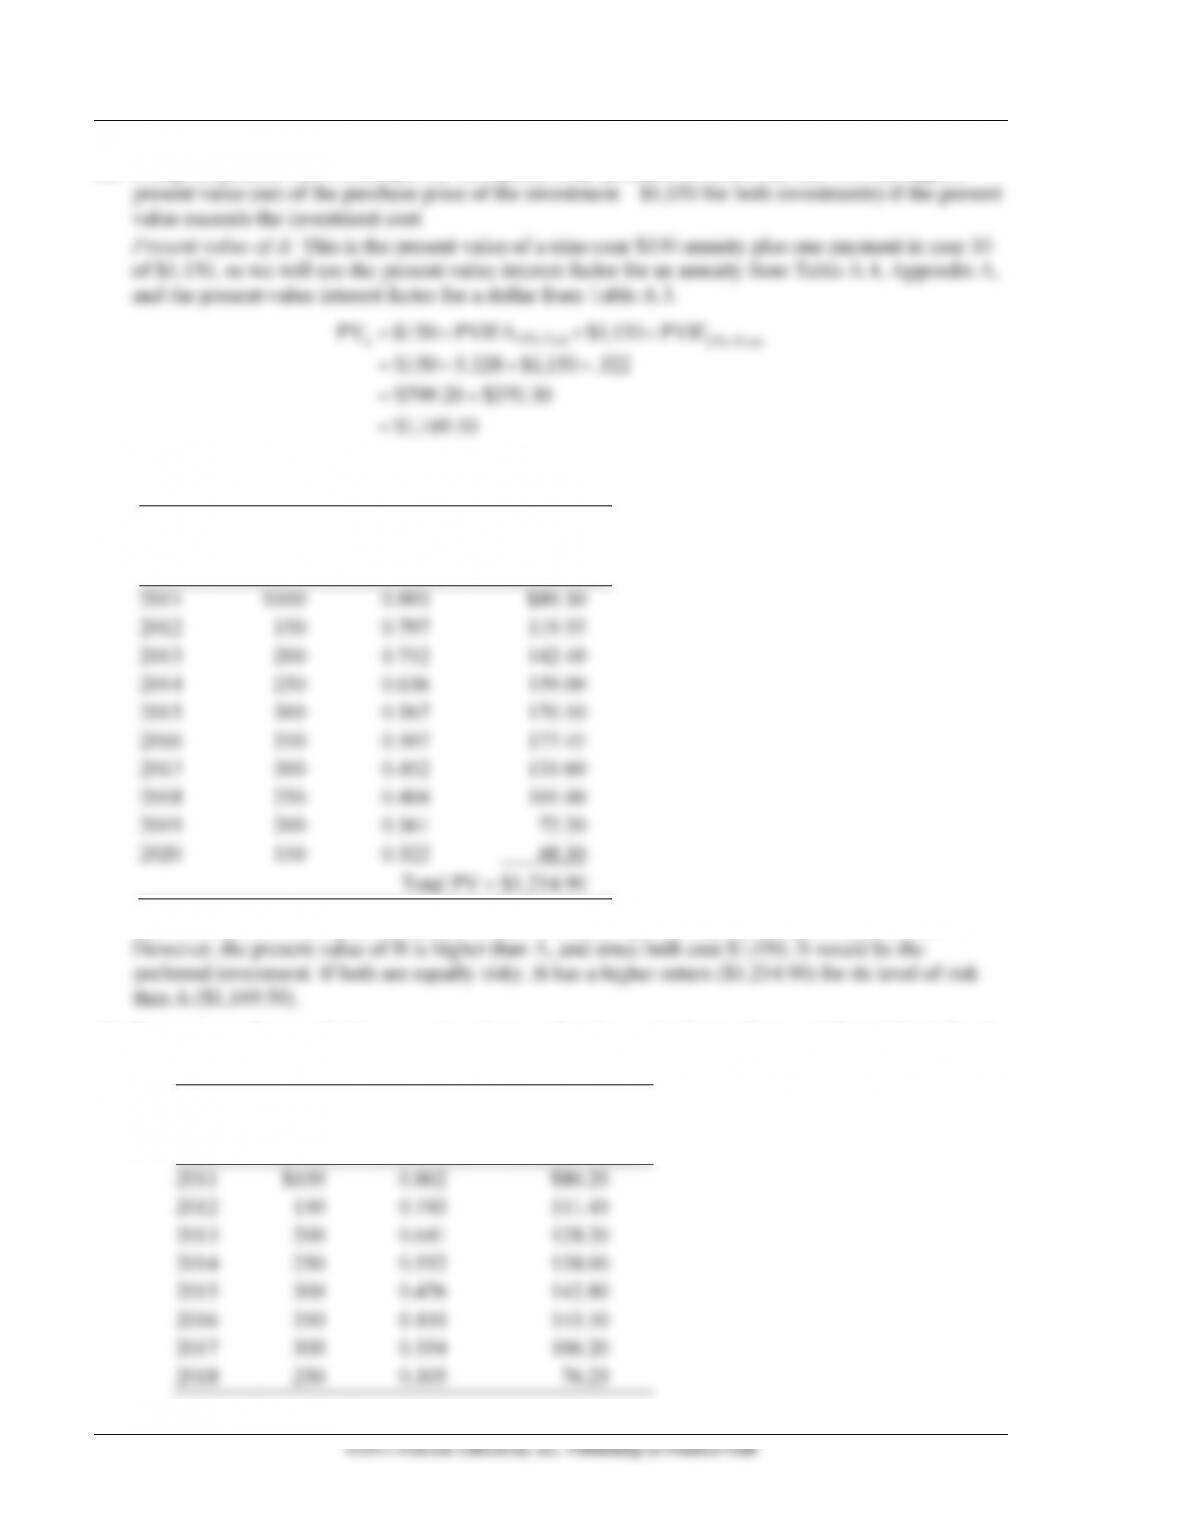
Present value of B: This is the present value of a mixed stream, so we use the present-value interest
factors for one dollar from Table A.3.
(1)
(2)
(3)
(1) (2)
Year
Benefit
12% PVIF
Present Value
2011
$100
0.893
$89.30
2012
150
0.797
119.55
2013
200
0.712
142.40
2014
250
0.636
159.00
2015
300
0.567
170.10
2016
350
0.507
177.45
2017
300
0.452
135.60
2018
250
0.404
101.00
2019
200
0.361
72.20
2020
150
0.322
48.30
Total PV = $1,214.90
Each investment is acceptable because its present value is greater than its initial cost of $1,050.
(b) For projects of unequal risk, we must evaluate each at its required rate of return (adjusted for its level
of risk). Using a 16% interest factor (from Table A.3, Appendix A), the present value of Investment B is:
(1)
(2)
(3)
(1) (2)
Year
Benefit
16% PVIF
Present Value
2011
$100
0.862
$86.20
2012
150
0.743
111.45
2013
200
0.641
128.20
2014
250
0.552
138.00
2015
300
0.476
142.80
2016
350
0.410
143.50
2017
300
0.354
106.20
2018
250
0.305
76.25