
Chapter 13
Managing Your Own Portfolio
◼ Outline
Learning Goals
I. Constructing a Portfolio Using an Asset Allocation Scheme
A. Investor Characteristics and Objectives
B. Portfolio Objectives and Policies
C. Developing an Asset Allocation Scheme
1. Approaches to Asset Allocation
a. Fixed Weightings
b. Flexible Weightings
c. Tactical Asset Allocation
2. Asset Allocation Alternatives
3. Applying Asset Allocation
Concepts in Review
II. Evaluating the Performance of Individual Investments
A. Obtaining Needed Data
1. Return Data
2. Economic and Market Activity
B. Indexes of Investment Performance
C. Measuring the Performance of Investments
1. Stocks and Bonds
a. Stocks
b. Bonds
2. Mutual Funds
3. Options and Futures
D. Comparing Performance to Investment Goals
1. Balancing Risk and Return
2. Isolating Problem Investments
Concepts in Review

250 Gitman/Joehnk/Smart • Fundamentals of Investing, Eleventh Edition
III. Assessing Portfolio Performance
A. Measuring Portfolio Return
1. Measuring the Amount Invested
2. Measuring Income
3. Measuring Capital Gains
4. Measuring the Portfolio’s Holding Period Return
B. Comparison of Return with Overall Market Measures
1. Sharpe’s Measure
2. Treynor’s Measure
3. Jensen’s Measure (Jensen’s Alpha)
C. Portfolio Revision
Concepts in Review
IV. Timing Transactions
A. Formula Plans
1. Dollar Cost Averaging
2. Constant-Dollar Plan
3. Constant-Ratio Plan
4. Variable-Ratio Plan
B. Using Limit and Stop-Loss Orders
1. Limit Orders
2. Stop-Loss Orders
C. Warehousing Liquidity
D. Timing Investment Sales
1. Tax Consequences
2. Achieving Investment Goals
Concepts in Review
Summary
Key Terms
Discussion Questions
Problems
Case Problems
13.1 Assessing the Stalchecks’ Portfolio Performance
13.2 Evaluating Formula Plans: Charles Spurge’s Approach
Excel with Spreadsheets

Chapter 13 Managing Your Own Portfolio 251
◼ Key Concepts
1. The role of investor characteristics and objectives and portfolio objectives in planning and building
a portfolio
2. Procedure for building a portfolio using an asset allocation scheme that considers investor
characteristics and objectives as inputs to the establishment of portfolio objectives and policies
3. Obtaining needed data, indexes of investment performance, and techniques for measuring the
performance of investments
4. The methods used to compare investment performance to investment goals
5. The techniques used to measure the amount invested, current income, capital gains, and total
portfolio return relative to the amount of money actually invested in the portfolio
6. Statistical measures and uses of portfolio return—Sharpe’s, Treynor’s, and Jensen’s measures—and
the importance of portfolio revision
7. The role of common types of formula plans in timing purchase and sale decisions
8. The use of limit and stop-loss orders in investment timing, the warehousing of liquidity, and the key
factors in timing investment sales in order to achieve maximum benefits
◼ Overview
This chapter describes how investment portfolios are constructed and monitored, including procedures for
evaluating investment performance and timing portfolio transactions.
1. The first section of the chapter provides basic guidelines for building a portfolio using an asset
allocation scheme. In addition to portfolio objectives, an individual’s level and stability of income,
family factors, net worth, experience and age, and disposition toward risk are key factors to consider
during portfolio construction. The instructor should mention that tax and liquidity considerations
should also be taken into account when constructing a portfolio. The logic as well as general
procedures involved in developing an asset allocation scheme consistent with the investor’s needs are
demonstrated. All these discussions focus on the chapter’s key idea: the individual investor should
assemble a portfolio that will yield maximum expected returns commensurate with the level of risk
he or she is willing to assume.
2. The evaluation of an individual investment’s performance is discussed. Such performance may be
measured by comparing an investment’s return against a standard. Two such standards might involve
comparing actual with anticipated returns or comparing an actual return against the return of another
vehicle of a similar type. The text stresses the need for a broad range of data to assess performance
accurately.
3. Investment performance also may be measured by computing and comparing holding period returns
(HPR) before and after tax. The instructor might work out HPRs for different investments such as
stocks, bonds, mutual funds, or real estate. It should be emphasized that the comparison of HPRs
must be accompanied by the consideration of the associated risk. Riskier investments should provide
higher returns than low-risk investments to compensate for the greater risk involved.


256 Gitman/Joehnk/Smart • Fundamentals of Investing, Eleventh Edition
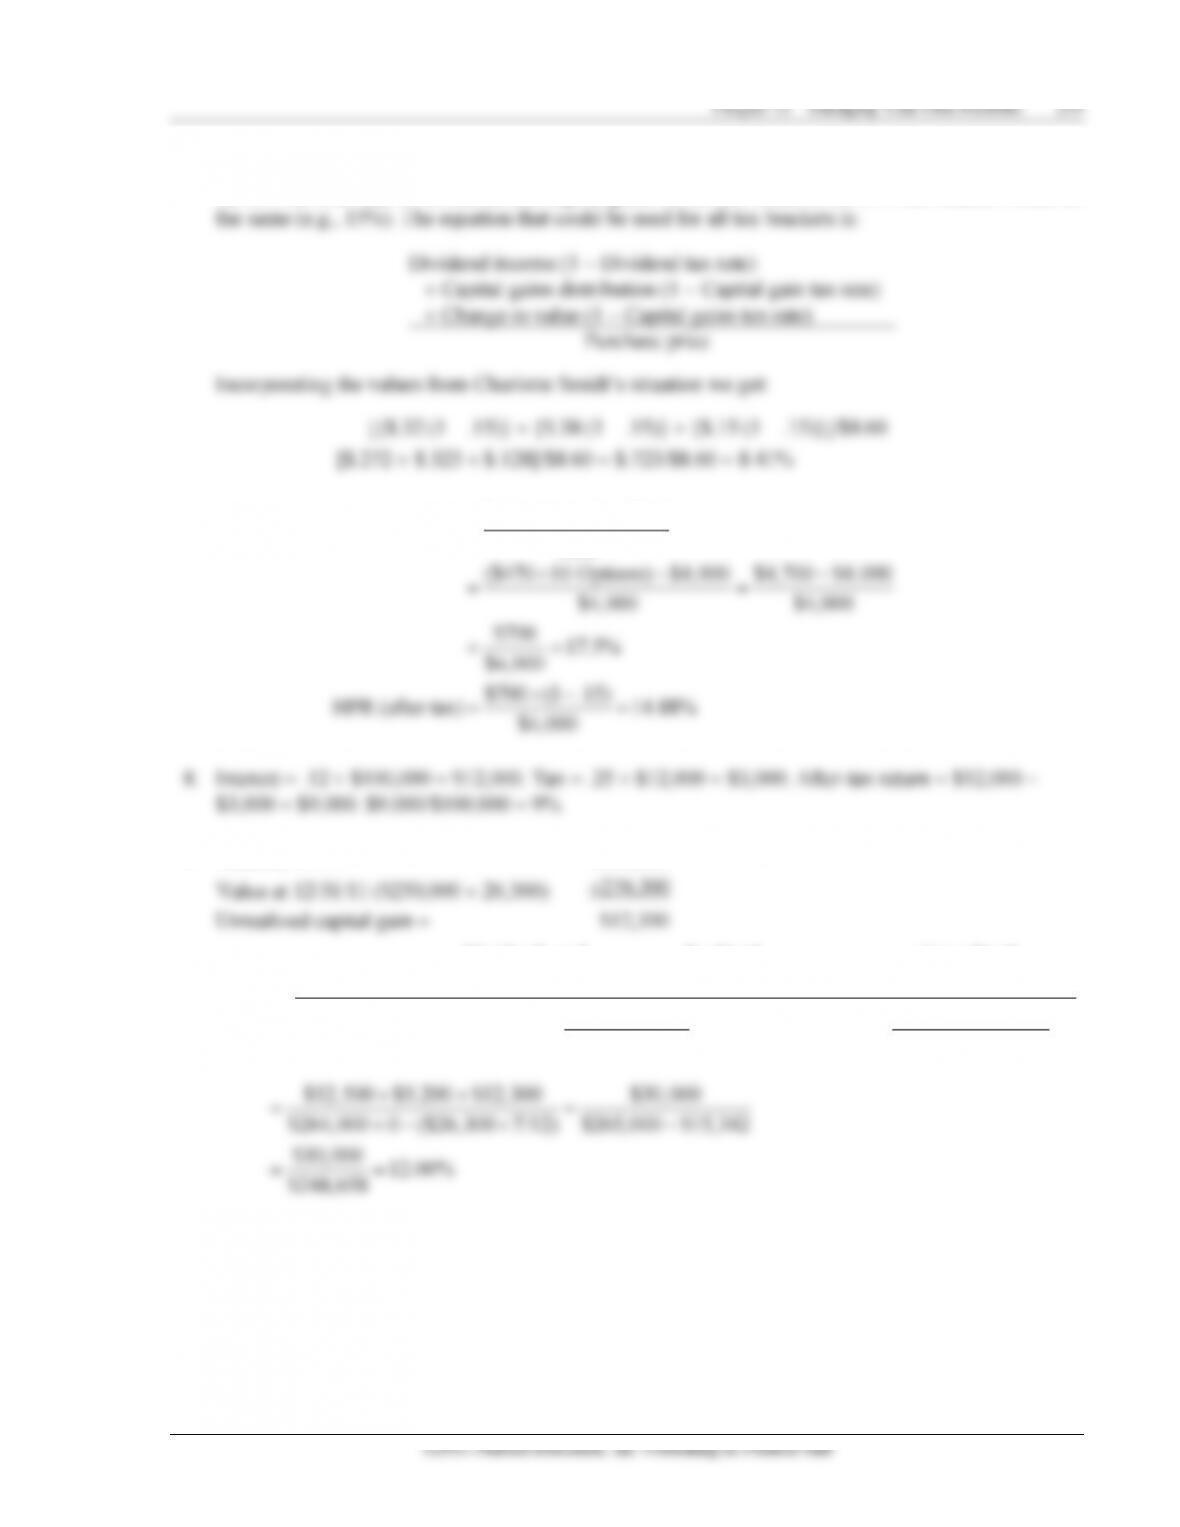
(c) Jensen’s measure, also called alpha, uses portfolio beta and the capital asset pricing model
(CAPM) to calculate the excess return—the difference between the actual return and the required
18. Jensen’s measure is similar to Treynor’s measure; both focus only on nondiversifiable risk by using
19. When an investor decides to change the composition of a portfolio by selling some securities and
replacing them with others, he or she is engaging in portfolio revision. Periodically, the investor must
20. Formula plans are mechanical methods of portfolio management that try to take advantage of price
21. (a) The dollar cost averaging plan involves investing a fixed dollar amount in a security at fixed
(b) A constant-dollar plan uses a two-part portfolio. The speculative portion is invested in securities
having high promise of capital gain. The conservative portion consists of low-risk investments

Chapter 13 Managing Your Own Portfolio 257
(c) The constant-ratio plan establishes a desired fixed ratio of the speculative to the conservative
(d) The variable-ratio plan is a more aggressive strategy. The target ratio between the speculative
portion and the conservative portion of the portfolio is varied by the investor and depends on the
22. A limit order can be used to specify the investor’s minimum sell price or the maximum price the
investor will pay to buy the security. The stop-loss order is a type of suspended order that requests
23. The first reason investors should maintain some funds in a low-risk, highly liquid investment is
simply to protect against the chance of a total loss. Thus, a low-risk investment acts as a buffer
against possible investment adversity.
24. The two considerations in timing investment sales are tax consequences and compatibility with
investment goals. When there is a capital loss, the investor receives the benefit of a tax deduction. In
◼ Suggested Answers to “Ethics in Investing” Questions
Virtues of Ethical Investing: The Remarkable Life of John Templeton
Suggestion:
258 Gitman/Joehnk/Smart • Fundamentals of Investing, Eleventh Edition
◼ Suggested Answers to Discussion Questions
◼ Solutions to Problems
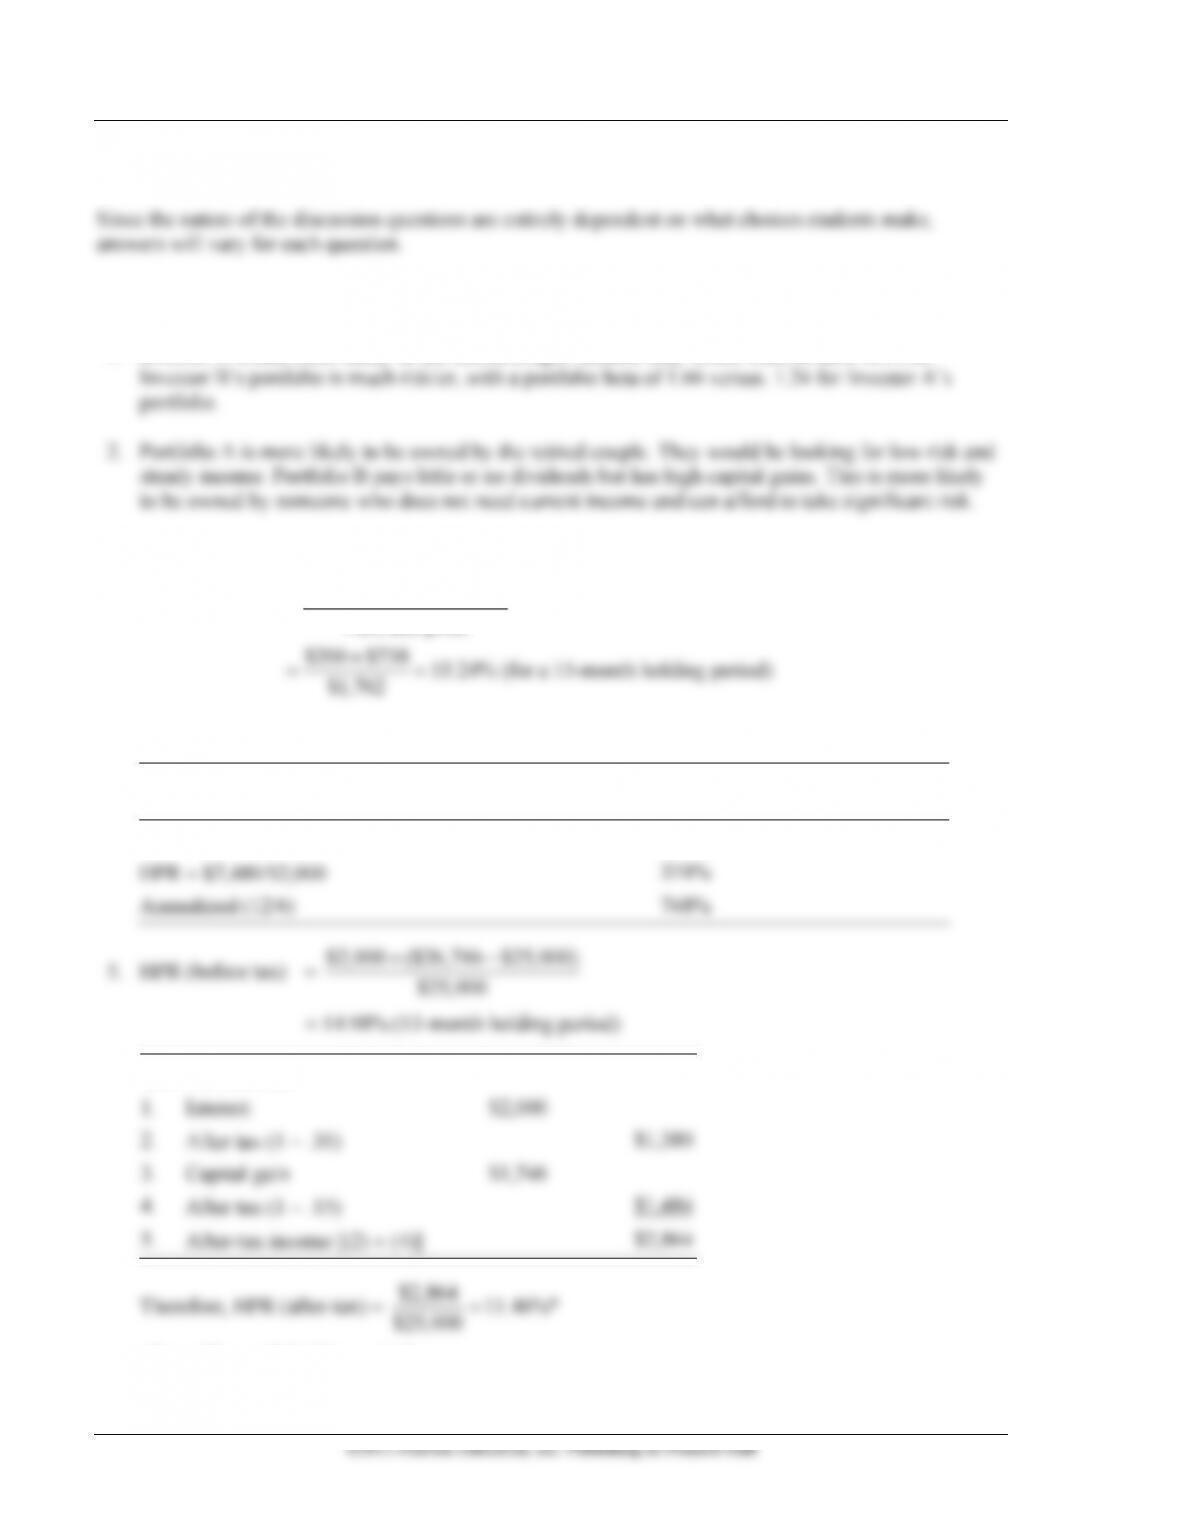
1. Investor A would more likely be the retired couple because they would want to have low risk.
3. Capital gain = $2,500 – $1,762 = $738
Dividend Capital gain
HPR Purchase price
$200 $738 53.24% (for a 15-month holding period)
$1,762
+
=
+
==
4.
A
Cost
B
Proceeds
B–A
Profit
Trading
Cost
Profit
after Costs
$2,000
$9,500
$7,500
$20
$7,480
HPR = $7,480/$2,000
374%
Annualized (12/6)
748%
5. HPR (before tax) =
$2,000 ($26,746 $25,000)
$25,000
+−
= 14.98% (13-month holding period)
Tax Calculations
1.
Interest
$2,000
2.
After tax (1 − .31)
$1,380
3.
Capital gain
$1,746
4.
After tax (1 − .15)
$1,484
5.
After-tax income [(2) + (4)]
$2,864
Therefore, HPR (after-tax) =
$2,864 11.46%*
$25,000 =
For a 13-month holding period

©2011 Pearson Education, Inc. Publishing as Prentice Hall
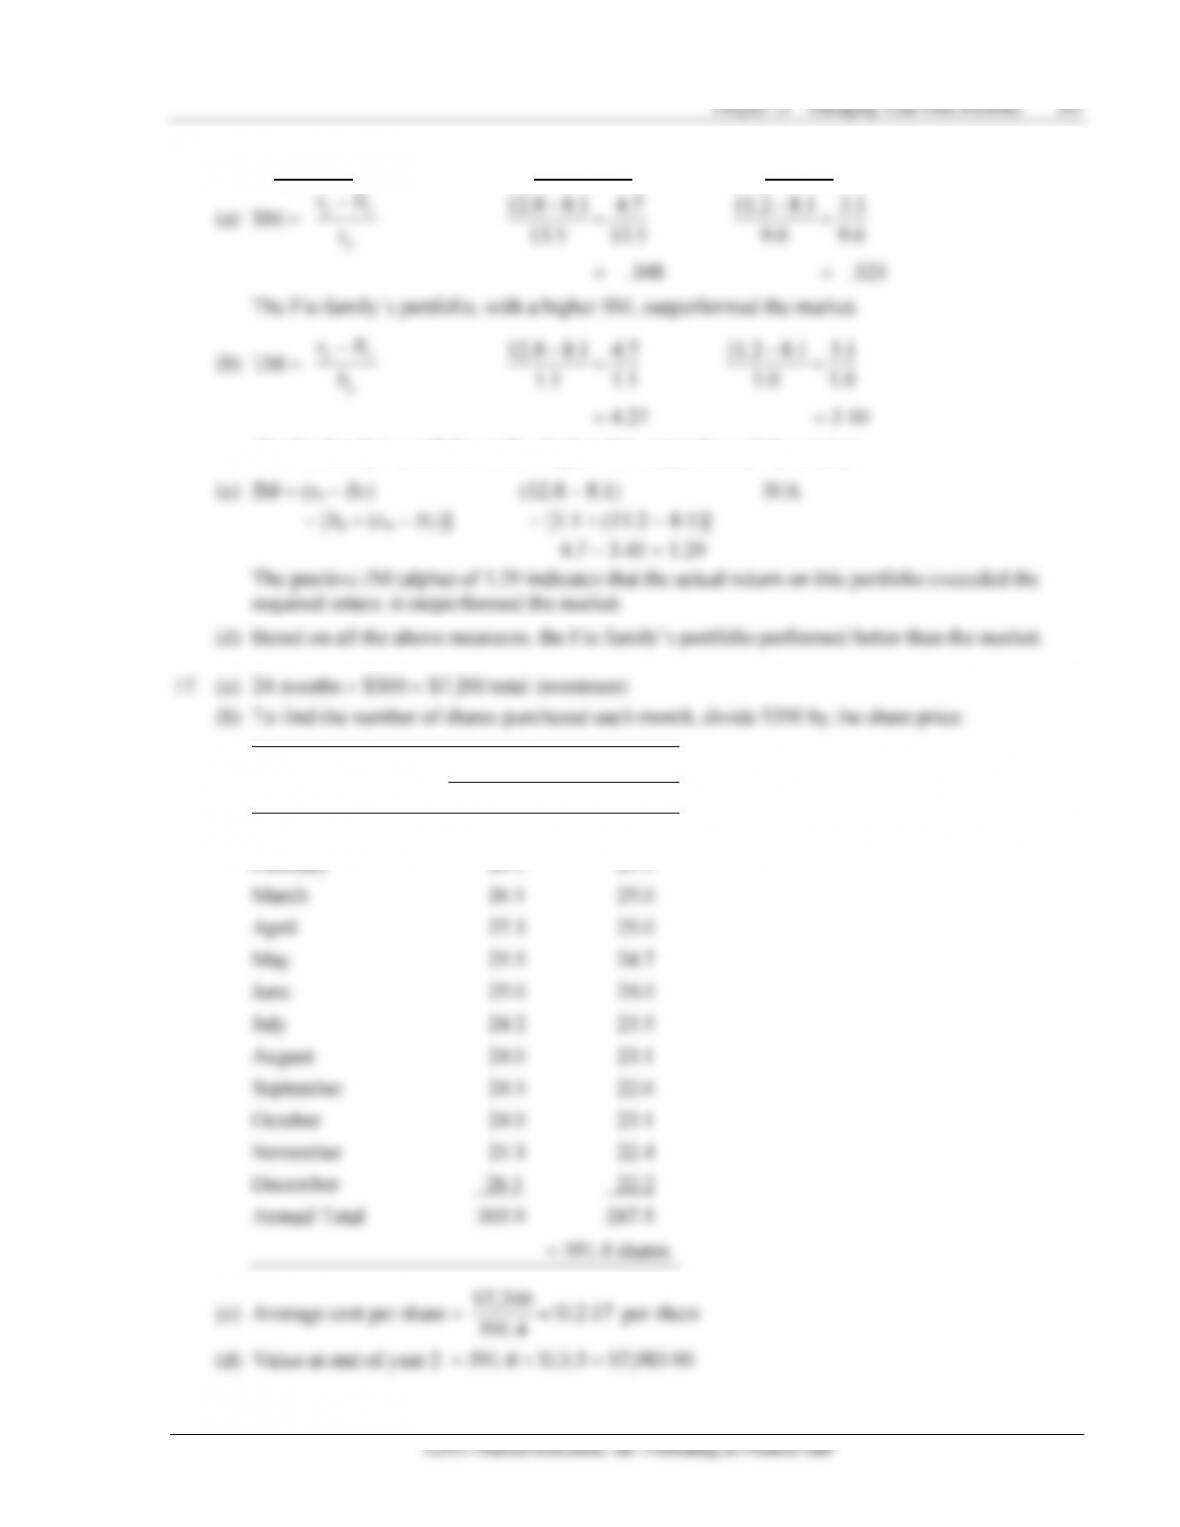
11. (a) Sharpe’s measure
Total portfolio return Risk-free rate
(SM) Portfolio standard deviation
11.8 6.2 .397
14.1
pF
p
rR
s
−
−
==
−
==
12. Treynor’s measure for the portfolio = (12.0 – 6.0)/1.3 = 4.62
13. (a) Treynor’s measure
Total portfolio return Risk-free rate
(TM) Portfolio beta
8.6 7.3 1.44
90
pF
p
rR
b
−
−
==
−
==
15. (a) Jensen’s measure (JM) = [(Total portfolio return − Risk-free rate) −
Portfolio beta (Market return − Risk-free rate)]
(b) Chee’s portfolio, with a JM of + .94, outperformed Carri’s portfolio, with a JM of −0.24. A

Chapter 13 Managing Your Own Portfolio 263
HPR for options:
($29,000 $26,000)
$26,000
−
(b) After-tax HPRs:
Stock (400 shares), reduced rate on dividends:
Industrial bonds (eight bonds):
Mutual fund (500 shares), reduced rate on dividend and capital gain distributions:
Options:
(c) Total investment = ($17.25 400) + ($970 8) + ($19.45 500) + $26,000
Total current income = ($.90 400) + ($92.50 8) + ($1.10 500) + $0
Total capital gain = ($1.50 400) + (−$6.25 8) + ($.57 500) + $3,000
$50,385
(d) JM = (rp – RF) – [bp (rm – RF)]
Using Jensen’s measure, the actual portfolio return is better than the required return because it is
(e) This question should lead to discussion—it has no pat answer. In general, the portfolio is balanced
between current income and growth. The ratio of current income to capital gain is 43 ($1,650/$3,835);
Chapter 13 Managing Your Own Portfolio 265
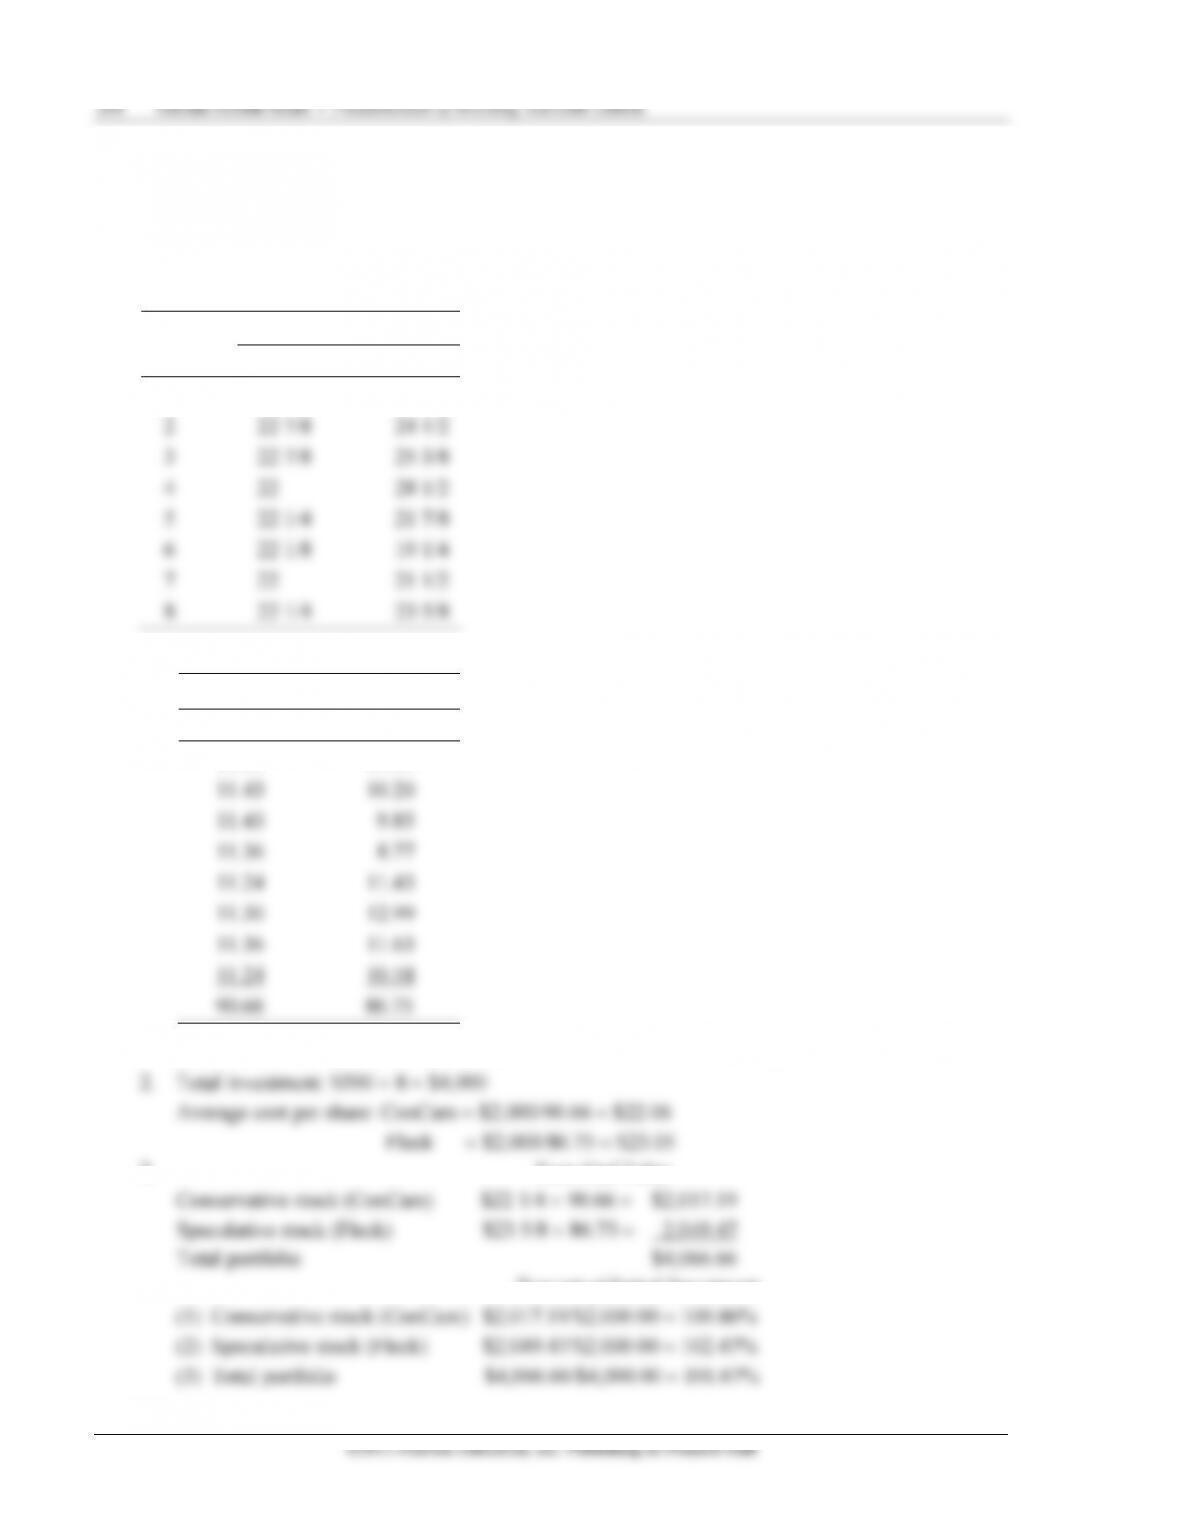
(b) Constant-dollar plan: return speculative value (Fleck) to $2,000 when trigger points are reached.
Price of
Speculative
Stock
Price of
Conservative
Stock
Value of
Speculative
Stock
Value of
Conservative
Stock
Total
Value
Transactions
Shares in
Speculative
Shares in
Conservative
Fleck
ConCam
Fleck
ConCam
1. 22.125
22.125
$2,000.00
$2,000.00
$4,000.00
90.40
90.40
2. 24.500
21.875
2,214.80
1,977.50
4,192.30
{Sold 11.58
90.40
90.40
3. 25.375
21.875
2,293.90*
1,977.50
4,271.40
speculative
90.40
90.40
3a. 25.375
21.875
2,000.00
2,271.40
4,271.40
shares}
78.82
103.84
4. 28.500
22.000
2,246.09
2,284.48
4,530.57
78.82
103.84
5. 21.875
22.250
1,723.97*
2,310.44
4,034.41
{Bought 12.82
78.82
103.84
5a. 21.875
22.250
2,000.00
2,034.32
4,034.32
speculative
91.43
91.43
6. 19.250
22.125
1,760.03
12,022.89
3,782.92
shares}
91.43
91.43
7. 21.500
22.000
1,965.75
2,011.46
3,977.21
91.43
91.43
8. 23.625
22.250
2,160.03
2,034.32
4,194.35
91.43
91.43
*Trigger points (when value of speculative portion falls below $1,740 or goes above $2,260)
Year-End Value
Percent of Initial Investment
Conservative stock (ConCam)
$ 22.25 91.43 = $2,034.32
$2,034.32 $2,000.00 = 101.72%
Speculative stock (Fleck)
$23.625 91.43 = $2,160.03
$2,034.32 $2,000.00 = 108.00%
Total portfolio
$4,194.35
$4,194.35 $4,000.00 = 104.86%
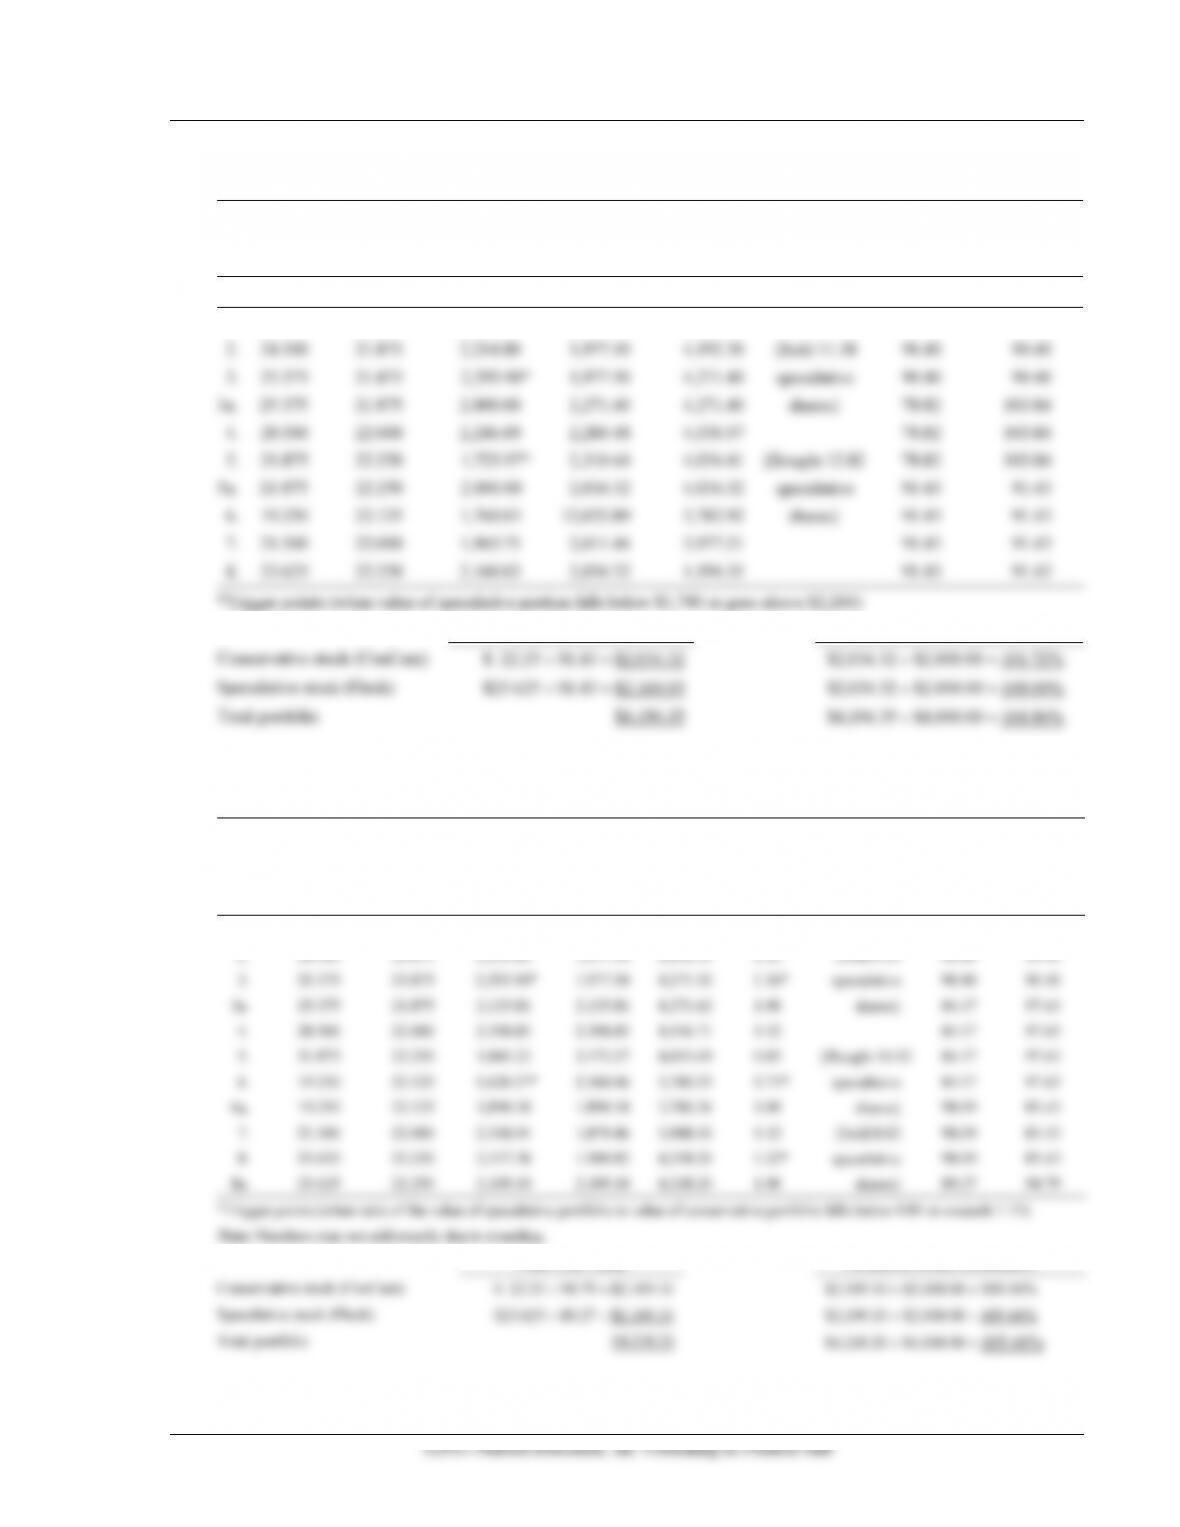
(c) Constant ratio plan: rebalance to value of speculative portion equal to value of conservative portion
when ratio hits trigger point.
Period
Price of
Speculative
Stock
Price of
Conservative
Stock
Value of
Speculative
Stock
Value of
Conservative
Stock
Total
Value
Ratio of
Speculative
Stock to
Conservative
Stock
Transactions
Shares in
Speculative
Shares in
Conservative
1.
22.125
22.125
$2,000.00
$2,000.00
$4,000.00
1.00
90.40
90.40
2.
24.500
21.875
2,214.80
1,977.50
4,192.30
1.12
{Sold 6.23
90.40
90.40
3.
25.375
21.875
2,293.90*
1,977.50
4,271.40
1.16*
speculative
90.40
90.40
3a.
25.375
21.875
2,135.81
2,135.81
4,271.62
1.00
shares}
84.17
97.63
4.
28.500
22.000
2,398.85
2,398.85
4,546.71
1.12
84.17
97.63
5.
21.875
22.250
1,841.22
2,172.27
4,013.49
0.85
{Bought 14.02
84.17
97.63
6.
19.250
22.125
1,620.27*
2,160.06
3,780.33
0.75*
speculative
84.17
97.63
6a.
19.250
22.125
1,890.18
1,890.18
3,780.36
1.00
shares}
98.09
85.43
7.
21.500
22.000
2,108.94
1,879.46
3,988.40
1.12
{Sold 8.82
98.09
85.43
8.
23.625
22.250
2,317.38
1,900.82
4,218.20
1.22*
speculative
98.09
85.43
8a.
23.625
22.250
2,109.10
2,109.10
4,218.20
1.00
shares}
89.27
94.79
*Trigger points (when ratio of the value of speculative portfolio to value of conservative portfolio falls below 0.84 or exceeds 1.15)
Note: Numbers may not add exactly due to rounding.
Year-End Value
Percent of Initial Investment
Conservative stock (ConCam)
$ 22.25 94.79 = $2,109.10
$2,109.10 $2,000.00 = 105.46%
Speculative stock (Fleck)
$23.625 89.27 = $2,109.10
$2,109.10 $2,000.00 = 105.46%
Total portfolio
$4,218.20
$4,218.20 $4,000.00 = 105.46%
266 Gitman/Joehnk/Smart • Fundamentals of Investing, Eleventh Edition
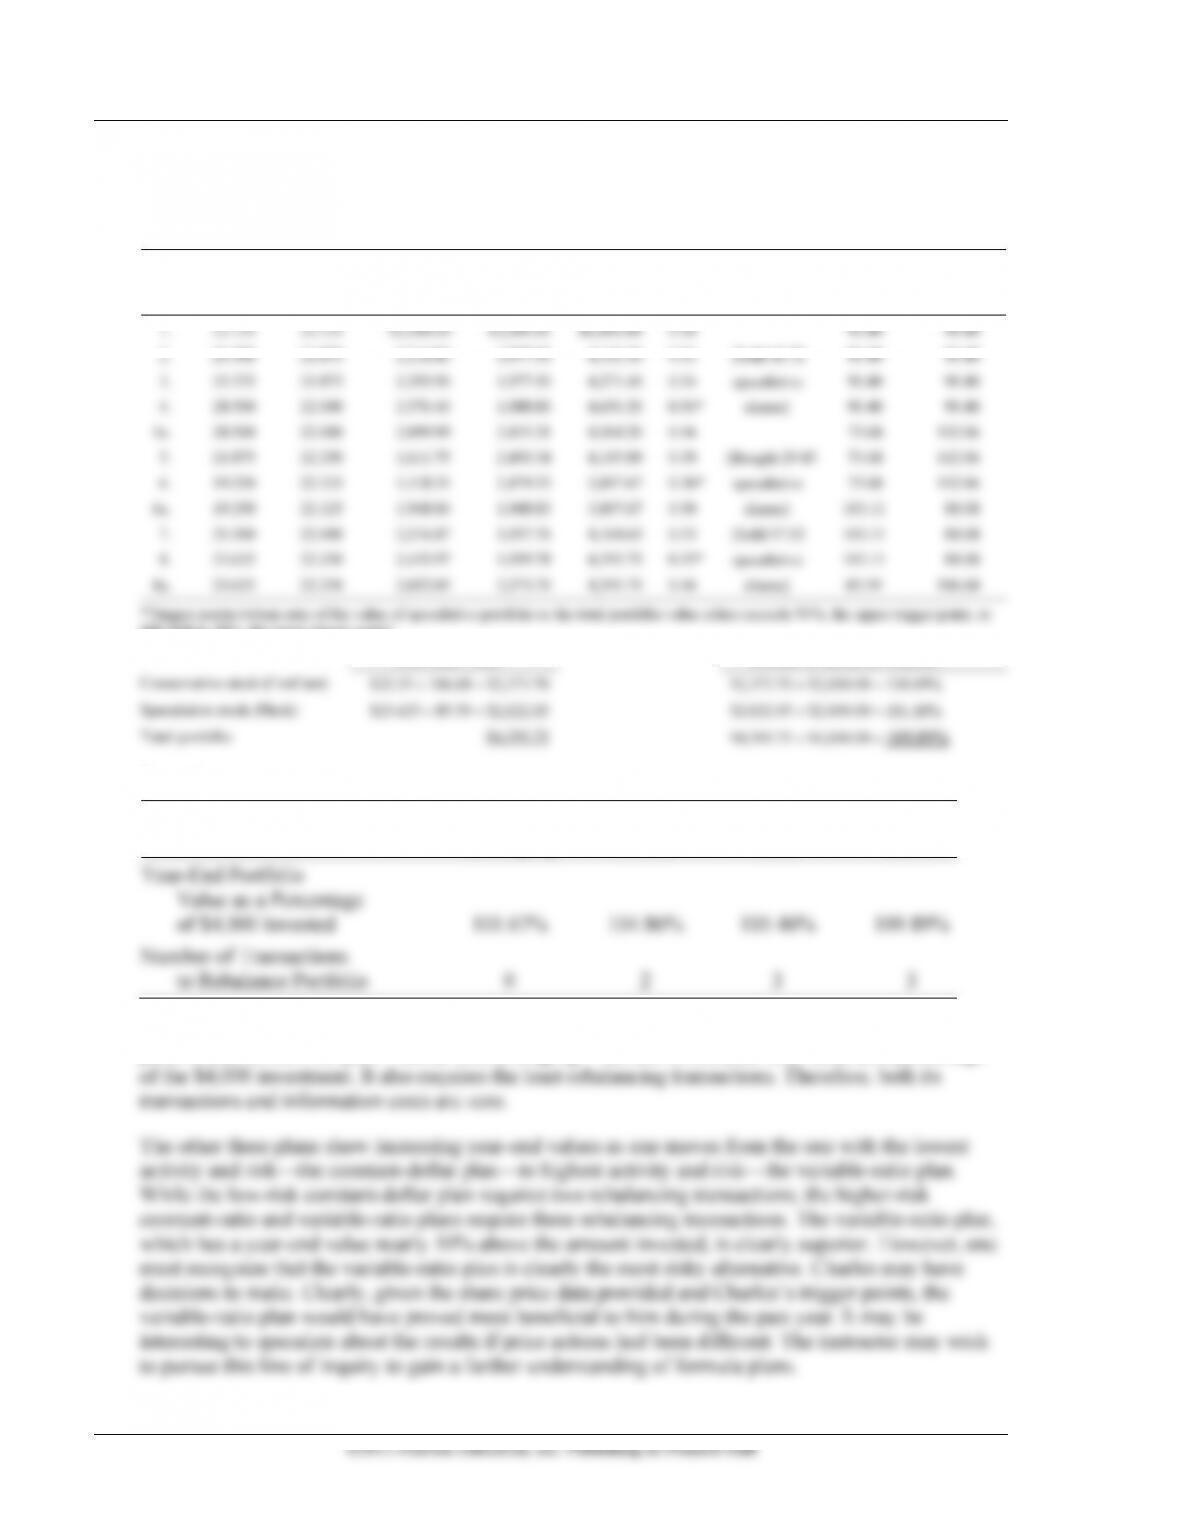
(d) Variable-ratio plan: rebalance speculative portion to 46% of the total portfolio value each time the
upper trigger point is reached; rebalance speculative portion to 50% each time the lower trigger point
is reached.
Period
Price of
Speculative
Stock
Price of
Conservative
Stock
Value of
Speculative
Stock
Value of
Conservative
Stock
Total
Portfolio
Value
Ratio
Transactions
Shares in
Speculative
Shares in
Conservative
1.
22.125
22.125
$2,000.00
$2,000.00
$4,000.00
0.50
90.40
90.40
2.
24.500
21.875
2,214.80
1,977.50
4,192.30
0.53
{Sold 16.72
90.40
90.40
3.
25.375
21.875
2,293.90
1,977.50
4,271.40
0.54
speculative
90.40
90.40
4.
28.500
22.000
2,576.40
1,988.80
4,656.20
0.56*
shares}
90.40
90.40
4a.
28.500
22.000
2,099.99
2,415.21
4,564.20
0.46
73.68
112.06
5.
21.875
22.250
1,611.75
2,493.34
4,105.09
0.39
{Bought 29.43
73.68
112.06
6.
19.250
22.125
1,418.34
2,479.33
3,897.67
0.36*
speculative
73.68
112.06
6a.
19.250
22.125
1,948.84
1,948.83
3,897.67
0.50
shares}
103.11
88.08
7.
21.500
22.000
2,216.87
1,937.76
4,164.63
0.53
{Sold 17.52
103.11
88.08
8.
23.625
22.250
2,435.97
1,959.78
4,395.75
0.55*
speculative
103.11
88.08
8a.
23.625
22.250
2,022.05
2,373.70
4,395.75
0.46
shares}
85.59
106.68
*Trigger points (when ratio of the value of speculative portfolio to the total portfolio value either exceeds 54%, the upper trigger point, or
falls below 38%, the lower trigger point).
Year-End Value
Percent of Initial Investment
Conservative stock (ConCam)
$22.25 106.68 = $2,373.70
$2,373.70 $2,000.00 = 118.69%
Speculative stock (Fleck)
$23.625 85.59 = $2,022.05
$2,022.05 $2,000.00 = 101.10%
Total portfolio
$4,395.75
$4,395.75 $4,000.00 = 109.89%
(e) Formula plan:
Dollar Cost
Averaging
Constant
Dollar
Constant
Ratio
Variable
Ratio
Year-End Portfolio
Value as a Percentage
of $4,000 Invested
101.67%
104.86%
105.46%
109.89%
Number of Transactions
to Rebalance Portfolio
0
2
3
3
In this illustration, the formula plans have performed much the way one would expect. The most
passive and lowest-risk plan—dollar cost averaging—has the lowest year-end value as a percentage

Chapter 13 Managing Your Own Portfolio 267
◼ Answers to CFA Questions (Part V)
1. a
◼ Outside Project
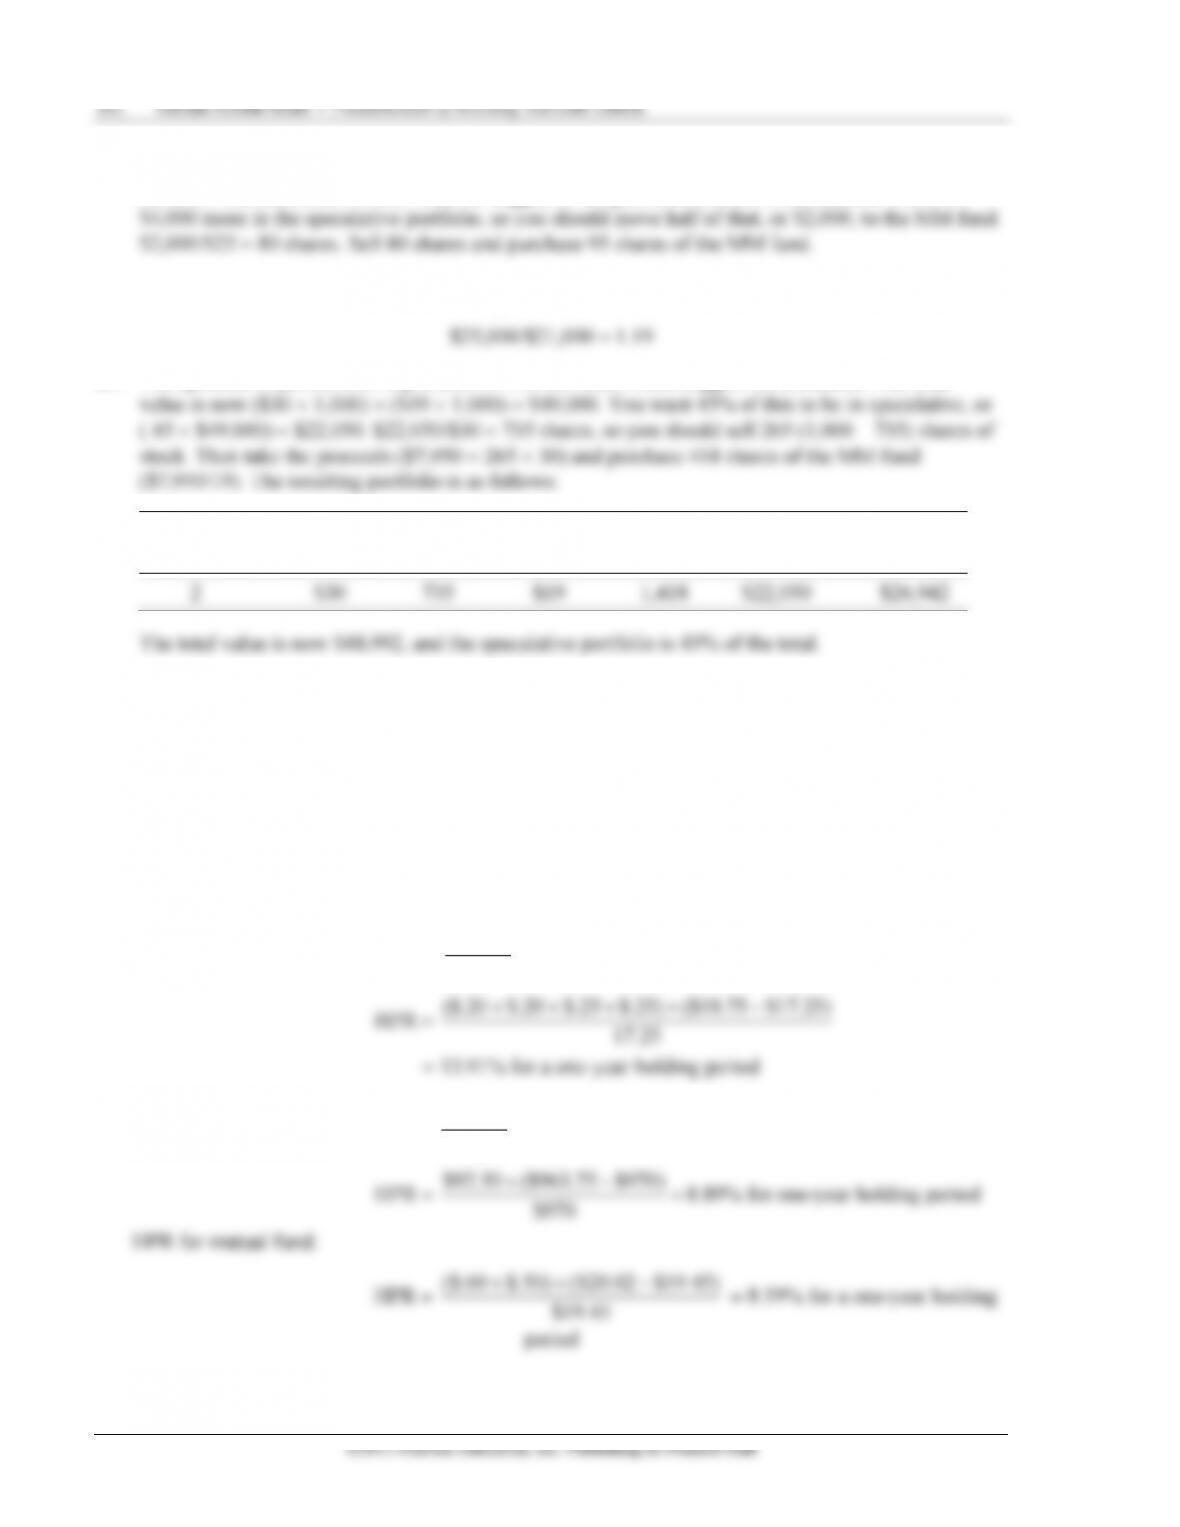
Chapter 13 Assessing Mutual Fund Performance
When risk-adjusted, market-adjusted rate of returns such as Jensen’s measure are not easy to calculate,
other comparisons need to be made. For instance, it is generally difficult to find the beta values of various
mutual funds; therefore, Jensen’s measure is not a useful measure. Instead, performance can be evaluated
by comparing the HPRs of similar funds that are assumed to have similar risk characteristics. This project
asks you to do just that.
Use The Wall Street Journal, Barron’s, or some other source to obtain thorough, readable information on
mutual funds. Obtain this information dated one year earlier, and select five similar funds managed by
different fund management companies. Calculate the holding period return (HPR) for each fund over the
period from a year ago to the present. Barron’s and other sources provide the dividend and capital gains
distributions for the period. If investment performance is considerably different among the funds, you may
want to further investigate their managements through such sources as Weisenberger Investment
Companies, which should be available in your public or university library. Try to assess the risk and return
behaviors of these funds, and use these comparisons to explain any differences you found in their HPRs.