Chapter 12 Mutual Funds: Professionally Managed Portfolios 239
Advantages of buying CEFs include the enhanced dividend yield arising from investing less than full
6. Answers will vary with each student.
◼ Solutions to Problems
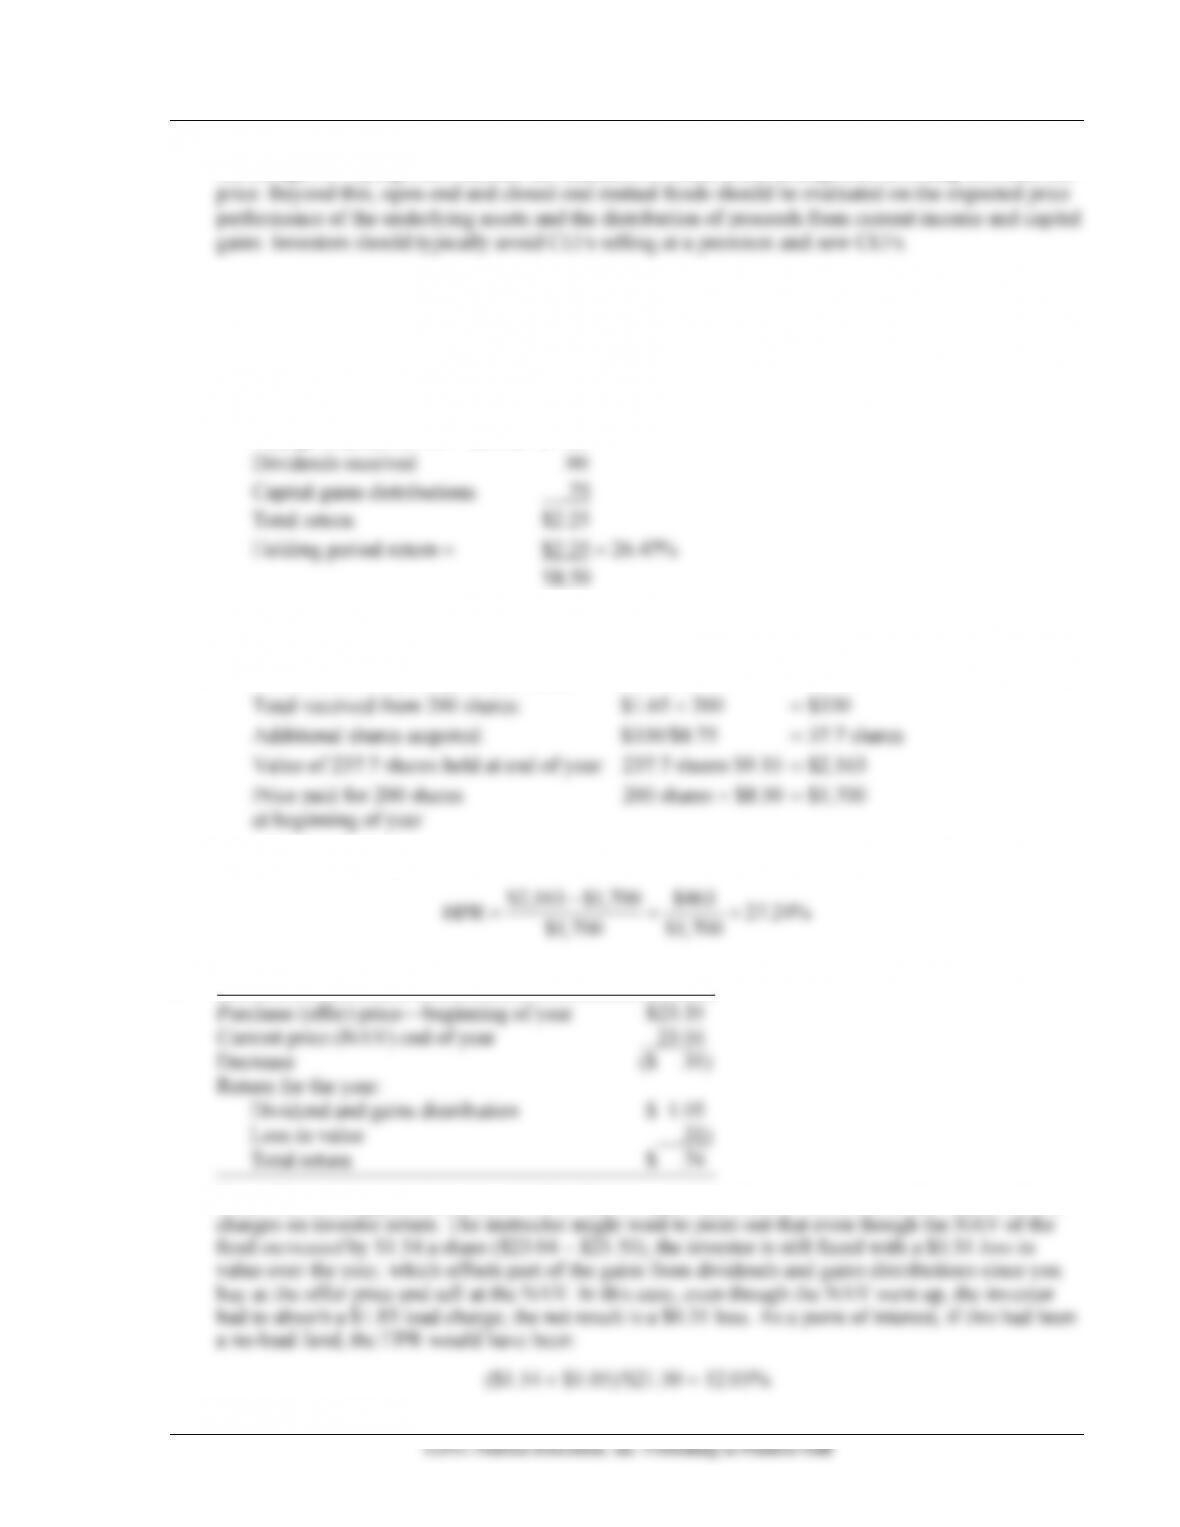
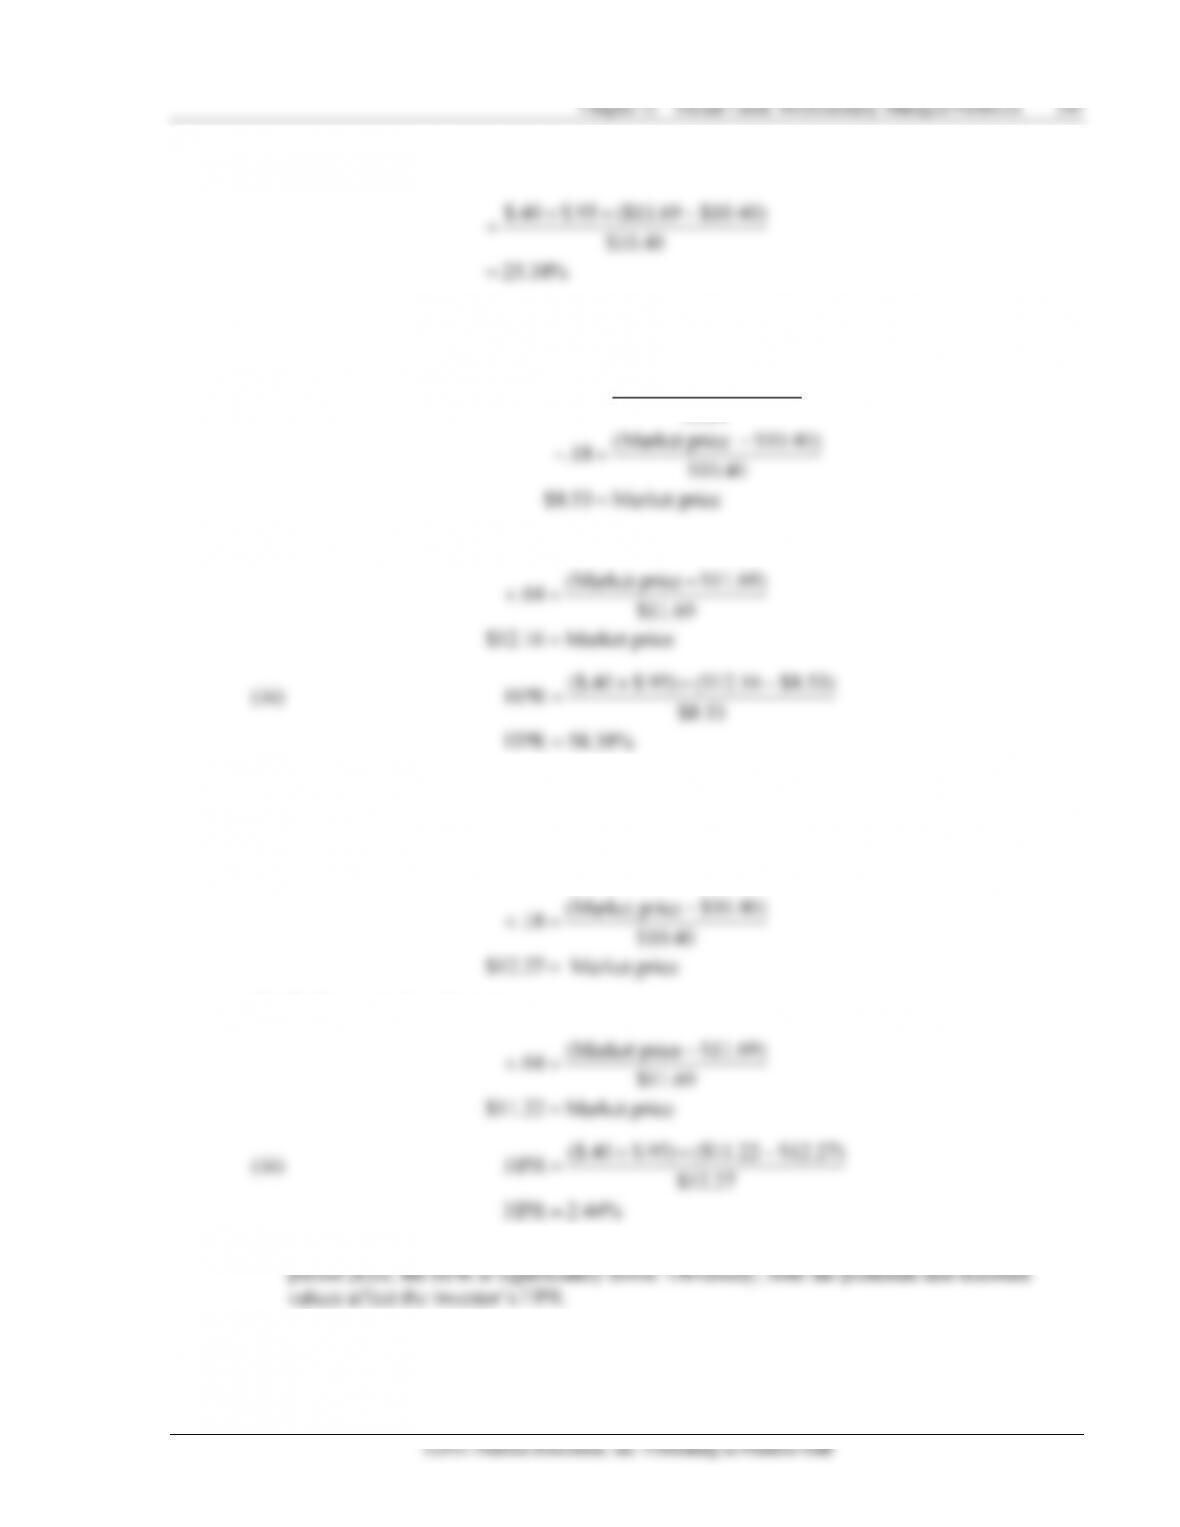
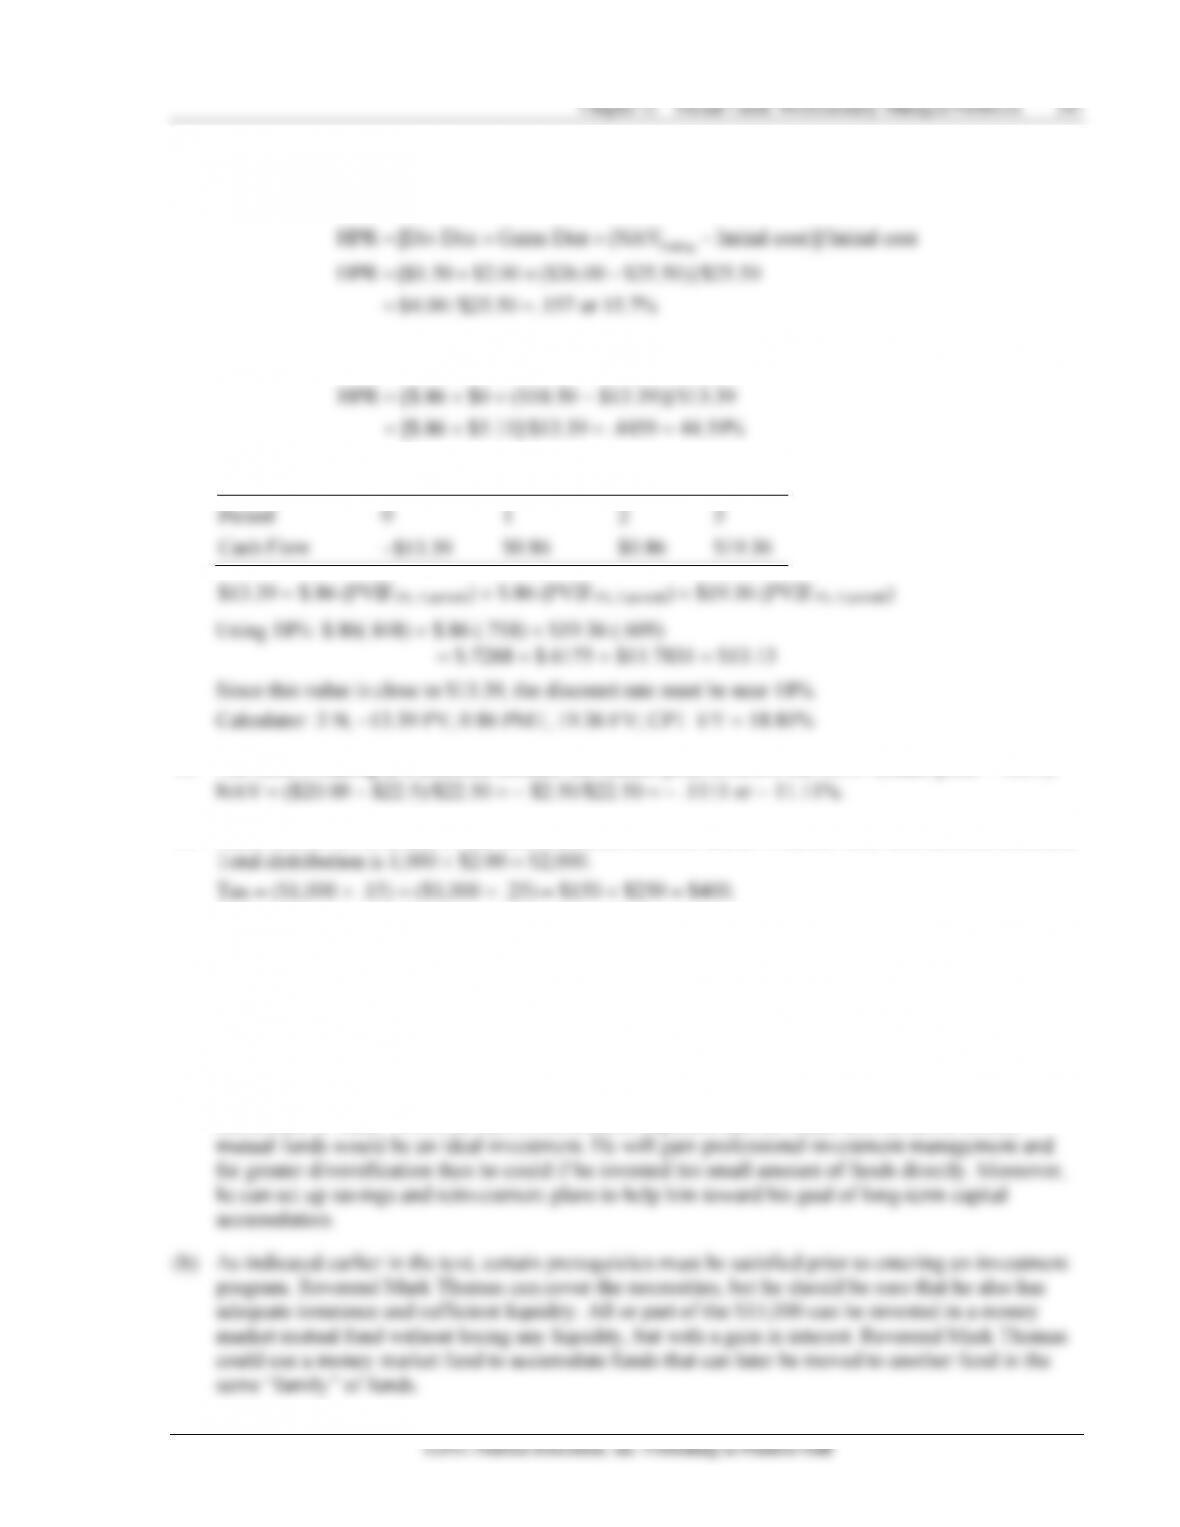
1. (a) Return for the year (all changes on a per share basis):
Change in price ($9.10 − $8.50) $ .60
(b) When all dividends and capital gains distributions are reinvested into additional shares of the
fund ($8.75/share):
Dividends and capital gains per share: $.90 + $.75 = $1.65
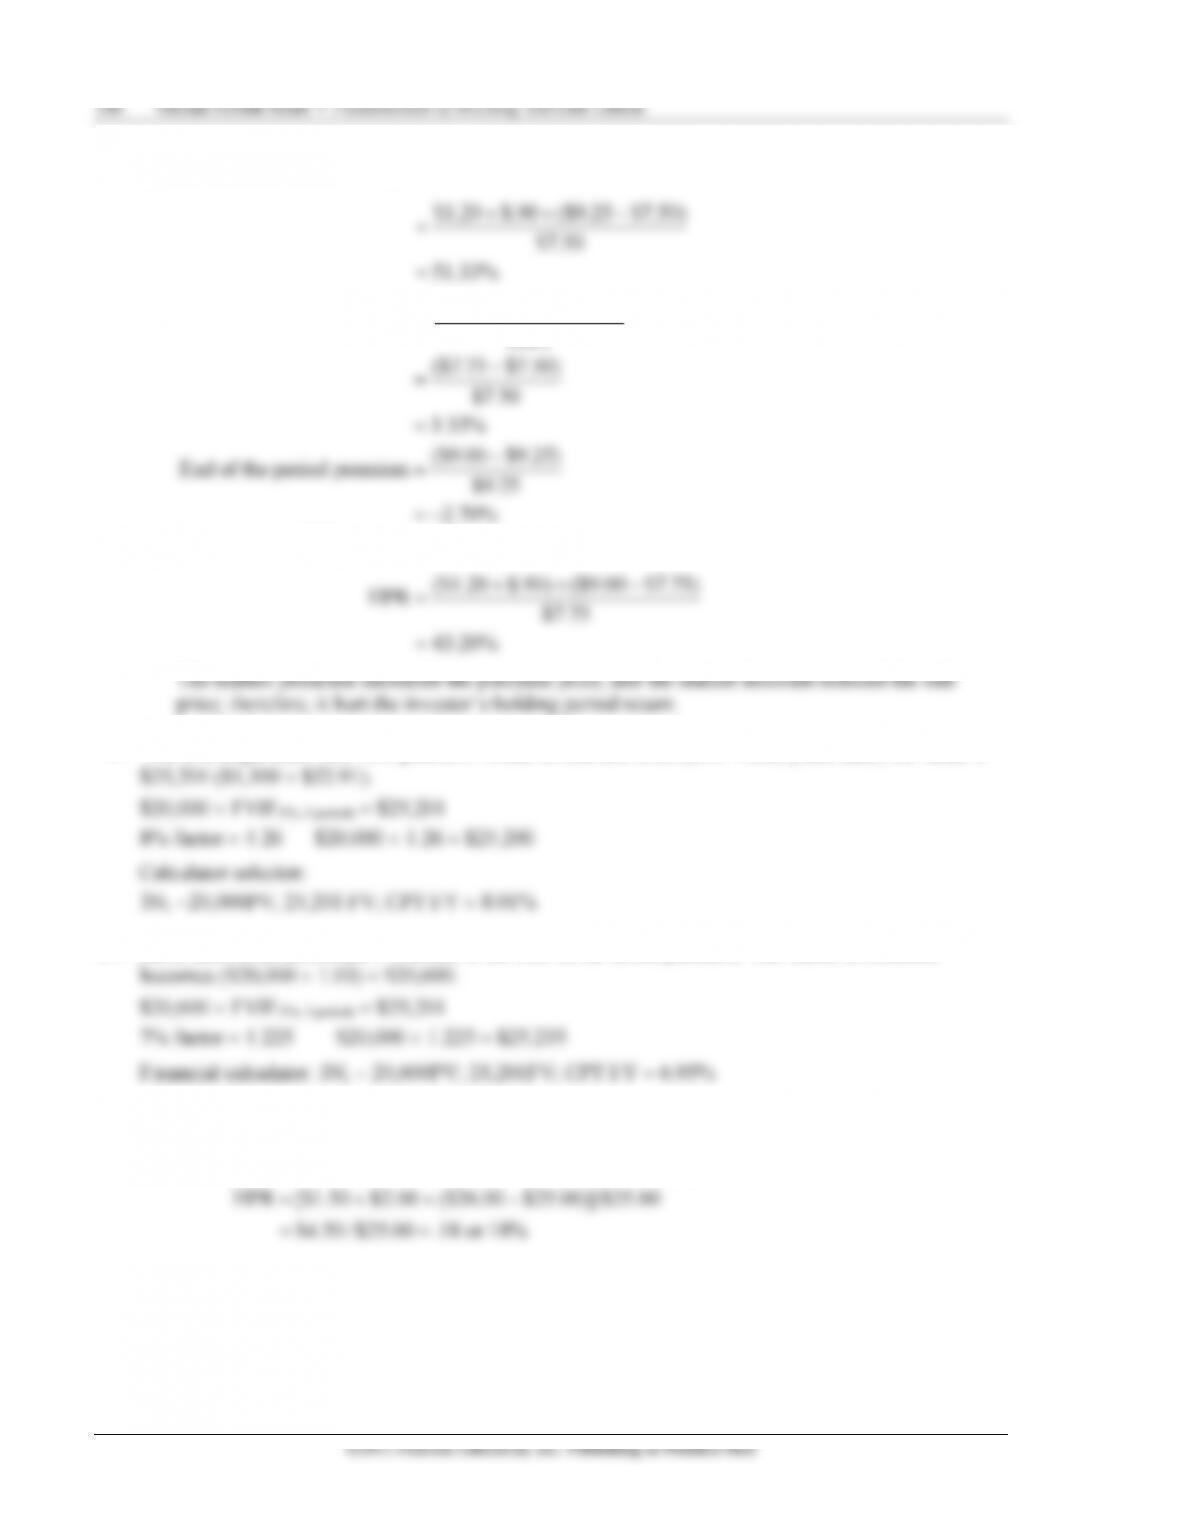
Thus, the holding period return would be:
$2,163 $1,700 $463
HPR 27.24%
$1,700 $1,700
−
= = =
2.
Purchase (offer) price—beginning of year
$23.35
Current price (NAV) end of year
23.04
Decrease
($ .31)
Return for the year:
Dividend and gains distribution
$ 1.05
Loss in value
.31)
Total return
$ .74
Note: The holding period return is 3.12%. This is a good problem to demonstrate the impact of load
242 Gitman/Joehnk/Smart • Fundamentals of Investing, Eleventh Edition
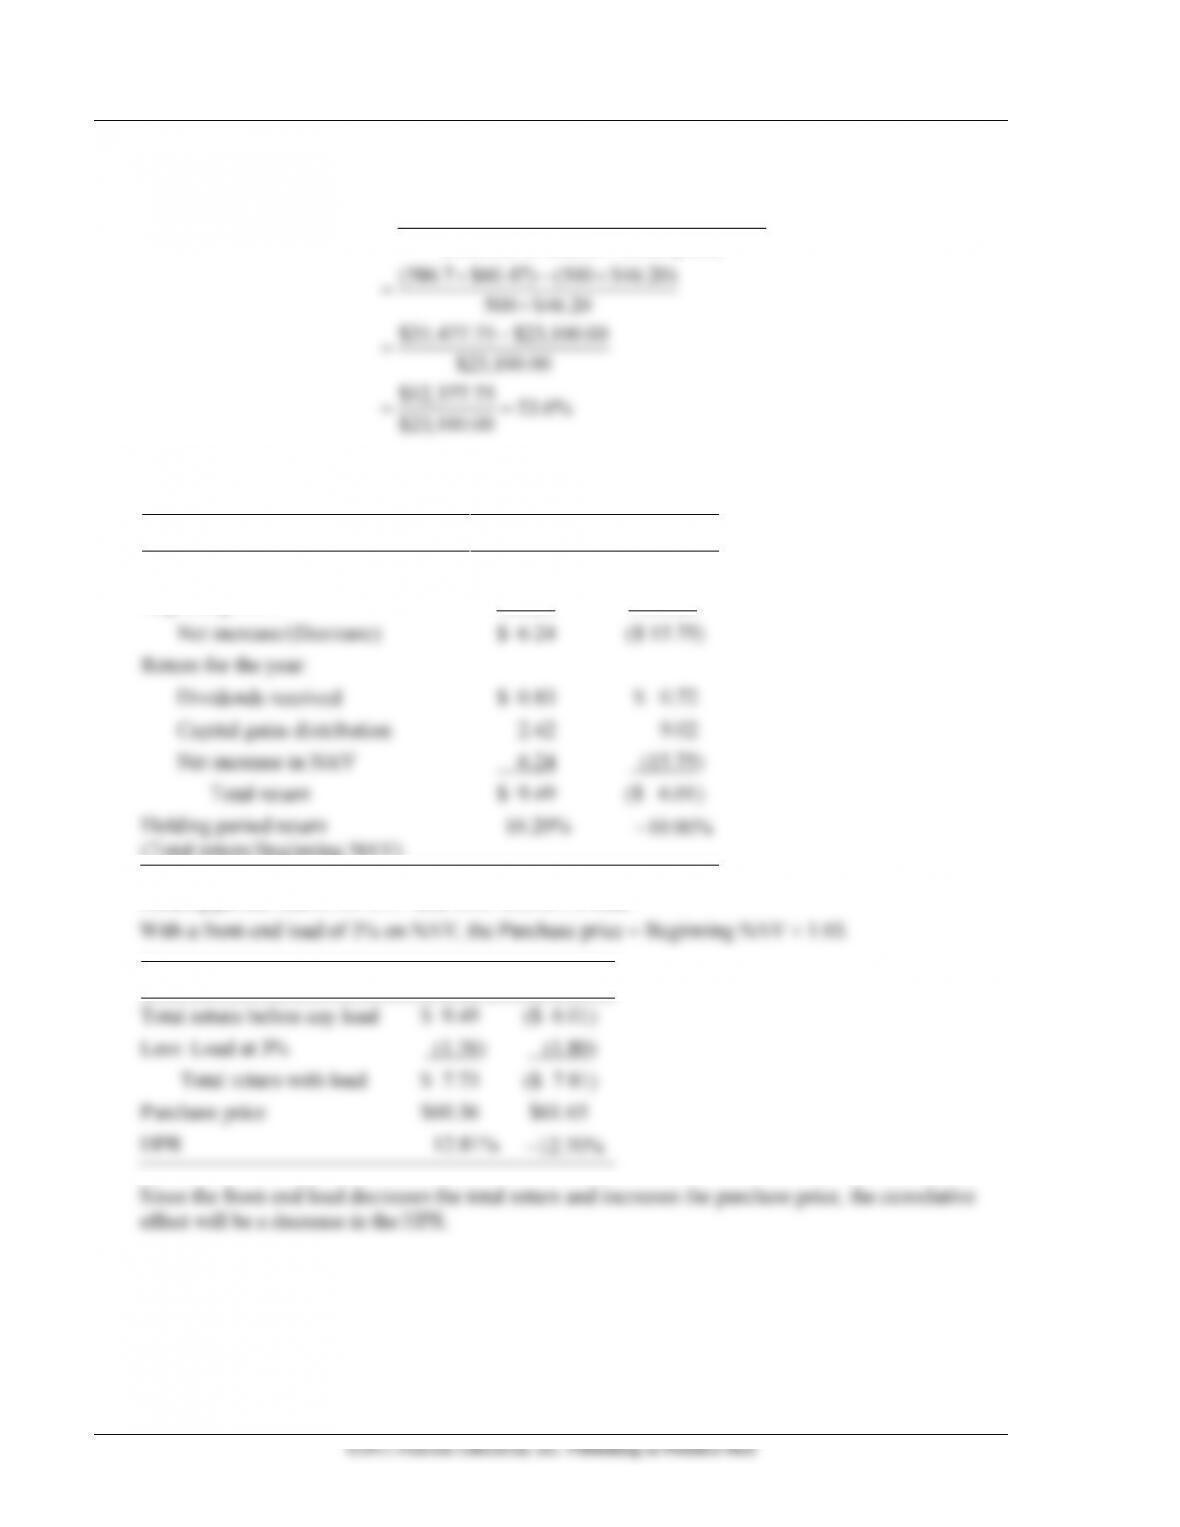
(Number of shares (Number of shares
Ending price) Beginning price)
HPR (Number of shares Initial price)
(586.7 $60.47) (500 $46.20)
500 $46.20
$35,477.75 $23,100.00
$23,100.00
$12,377.75 53.6
$23,100.00
−
=
−
=
−
=
==%
5. Holding period returns for 2011 and 2008:
2011
2008
Ending NAV
$64.84
$ 44.10
Beginning NAV
58.60
59.85
Net increase/(Decrease)
$ 6.24
($ 15.75)
Return for the year:
Dividends received
$ 0.83
$ 0.72
Capital gains distribution
2.42
9.02
Net increase in NAV
6.24
(15.75)
Total return
$ 9.49
($ 6.01)
Holding period return
(Total return/Beginning NAV)
16.20%
−10.00%
Holding period returns for 2011 and 2008 with a 3% load:
2011
2008
Total return before any load
$ 9.49
($ 6.01)
Less: Load at 3%
(1.76)
(1.80)
Total return with load
$ 7.73
($ 7.81)
Purchase price
$60.36
$61.65
HPR
12.81%
−12.70%
Since the front-end load decreases the total return and increases the purchase price, the cumulative
effect will be a decrease in the HPR.
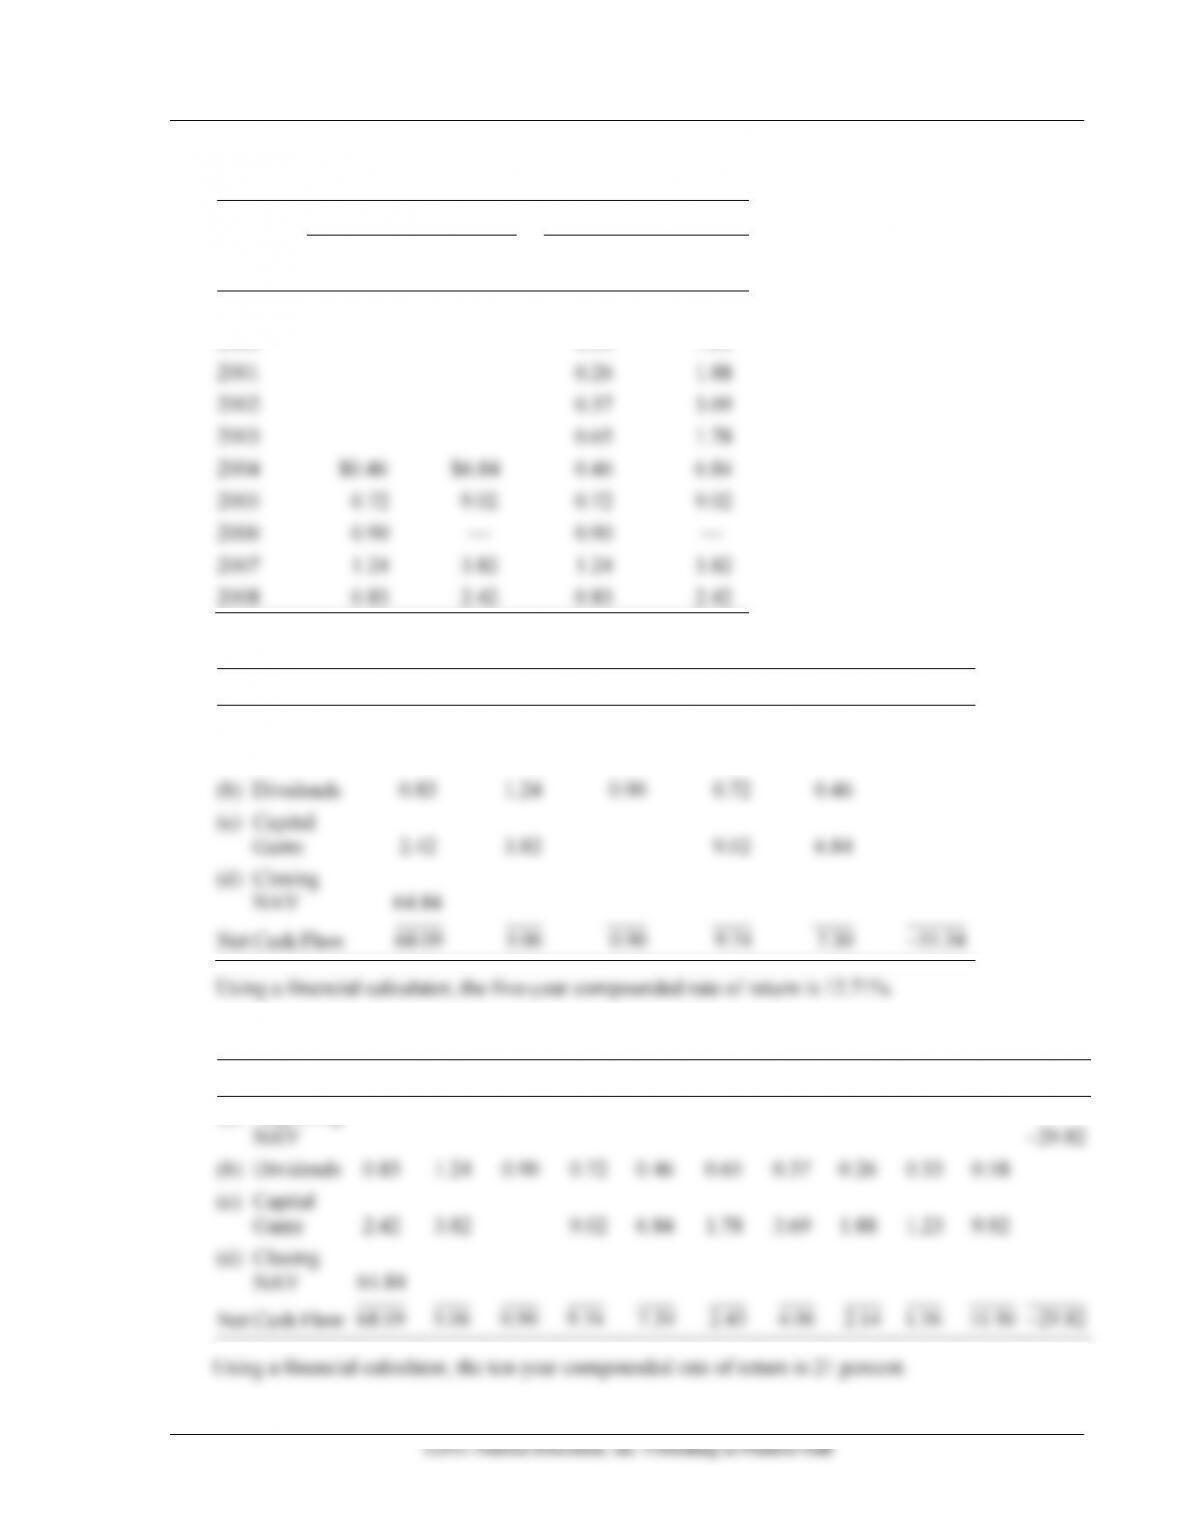
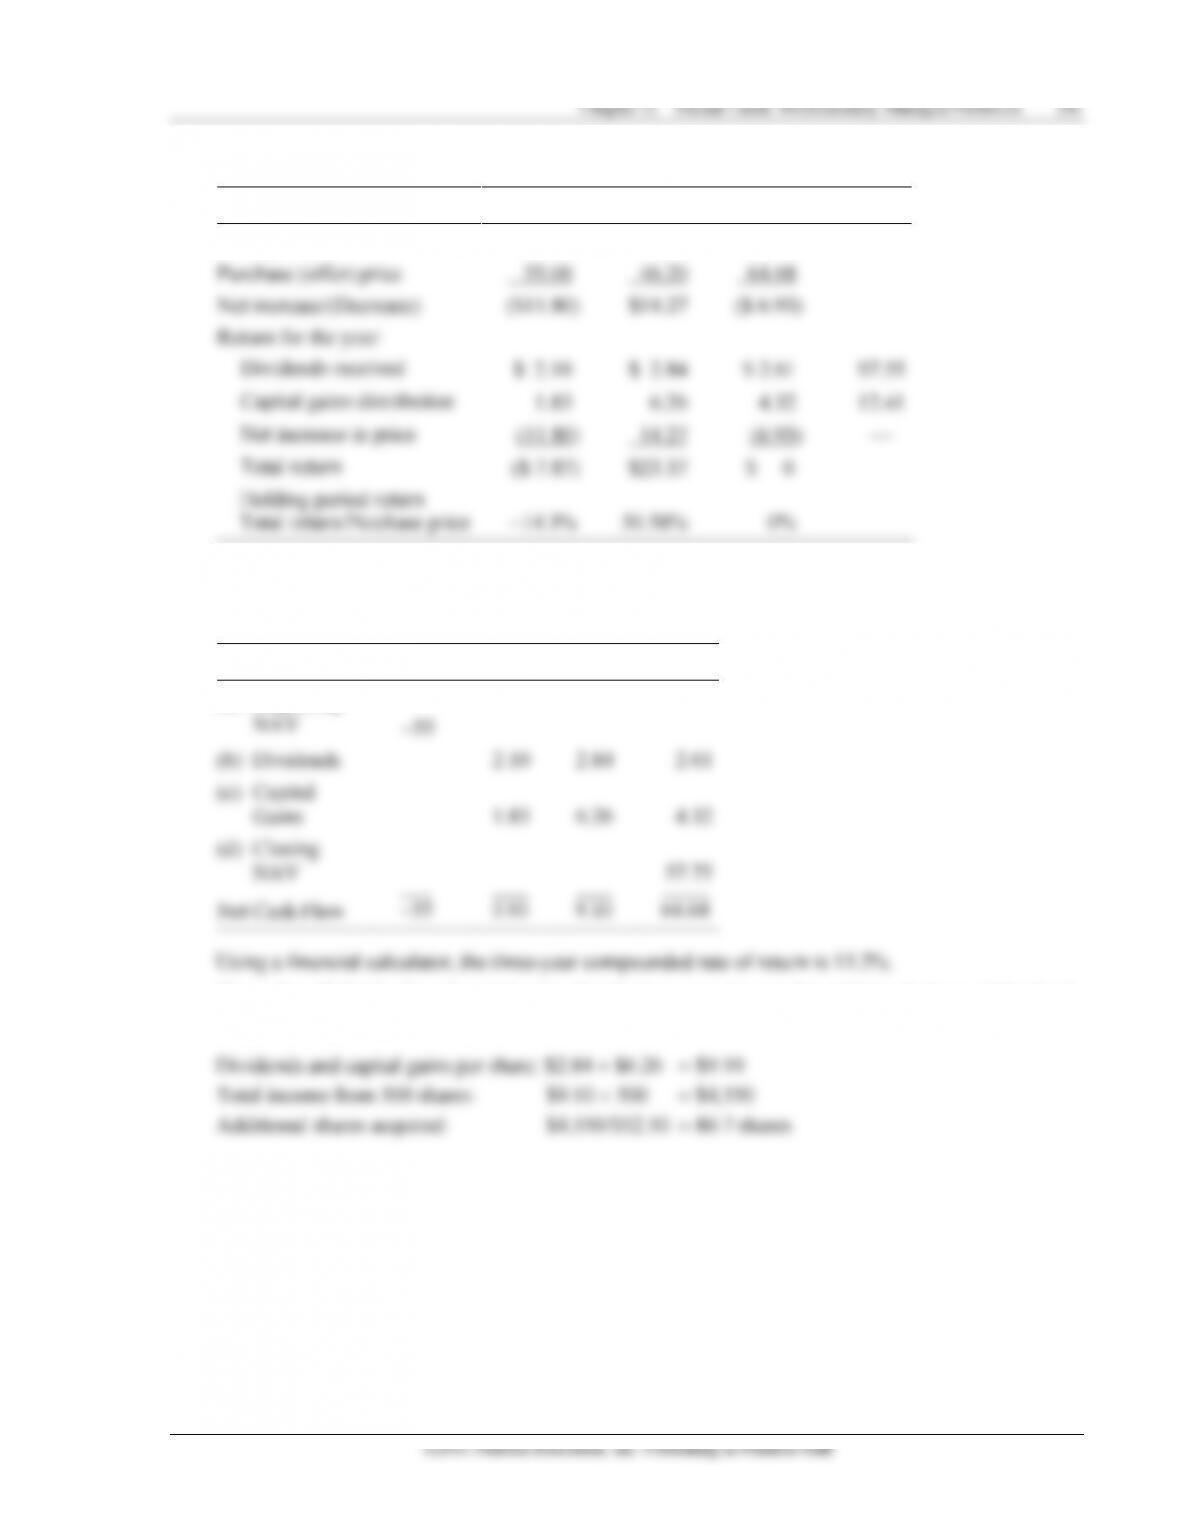
Chapter 12 Mutual Funds: Professionally Managed Portfolios 243
Average annual rate of return over the two periods:
2007–2011
2002–2011
Dividends
Capital
Gains
Dividends
Capital
Gains
1999
$0.58
$9.92
2000
0.33
1.23
2001
0.26
1.88
2002
0.37
3.69
2003
0.65
1.78
2004
$0.46
$6.84
0.46
6.84
2005
0.72
9.02
0.72
9.02
2006
0.90
—
0.90
—
2007
1.24
3.82
1.24
3.82
2008
0.83
2.42
0.83
2.42
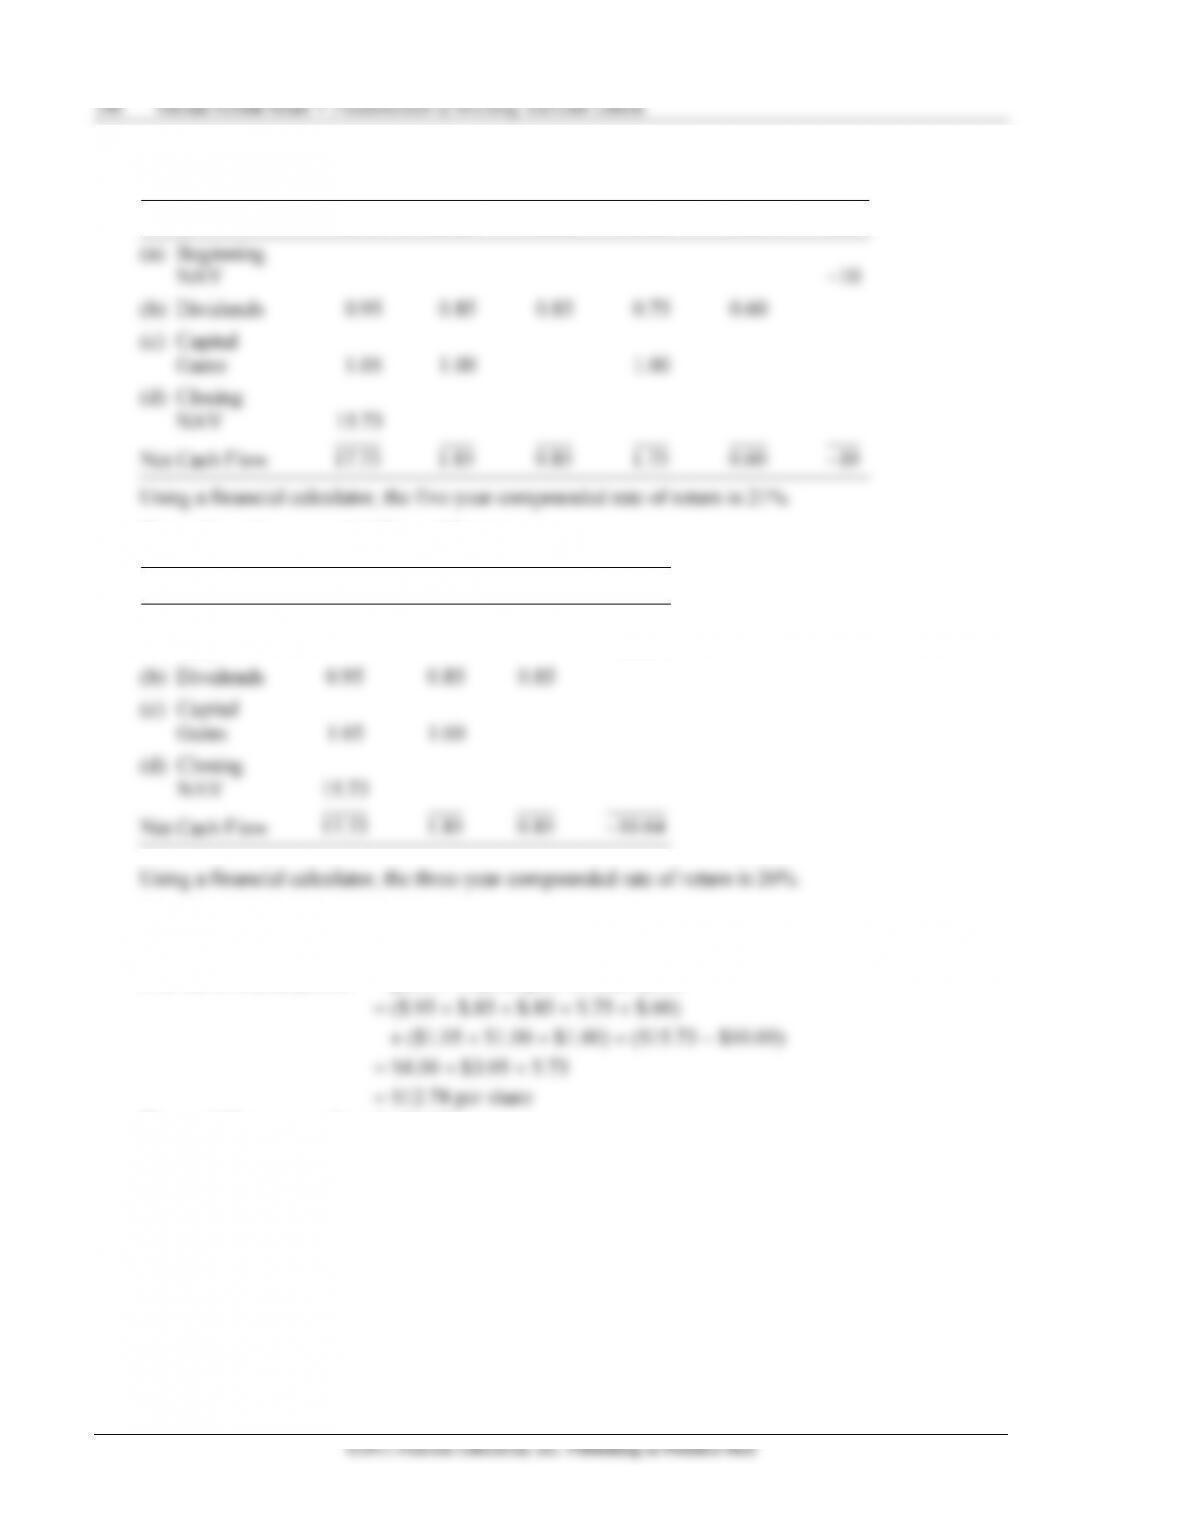
Compounded Return for the Five-Year Period with Loading
2011
2010
2009
2008
2007
2006
(a) Beginning
NAV
−55.34
(b) Dividends
0.83
1.24
0.90
0.72
0.46
(c) Capital
Gains
2.42
3.82
9.02
6.84
(d) Closing
NAV
64.84
Net Cash Flow
68.09
5.06
0.90
9.74
7.30
55.34−
Using a financial calculator, the five-year compounded rate of return is 12.71%.
Compounded Return for the Ten-Year Period with Loading
2011
2010
2009
2008
2007
2006
2005
2004
2003
2002
2001
(a) Beginning
NAV
−29.82
(b) Dividends
0.83
1.24
0.90
0.72
0.46
0.65
0.37
0.26
0.33
0.58
(c) Capital
Gains
2.42
3.82
9.02
6.84
1.78
3.69
1.88
1.23
9.92
(d) Closing
NAV
64.84
Net Cash Flow
68.09
5.06
0.90
9.74
7.30
2.43
4.06
2.14
1.56
10.50
29.82−
Using a financial calculator, the ten-year compounded rate of return is 21 percent.
244 Gitman/Joehnk/Smart • Fundamentals of Investing, Eleventh Edition
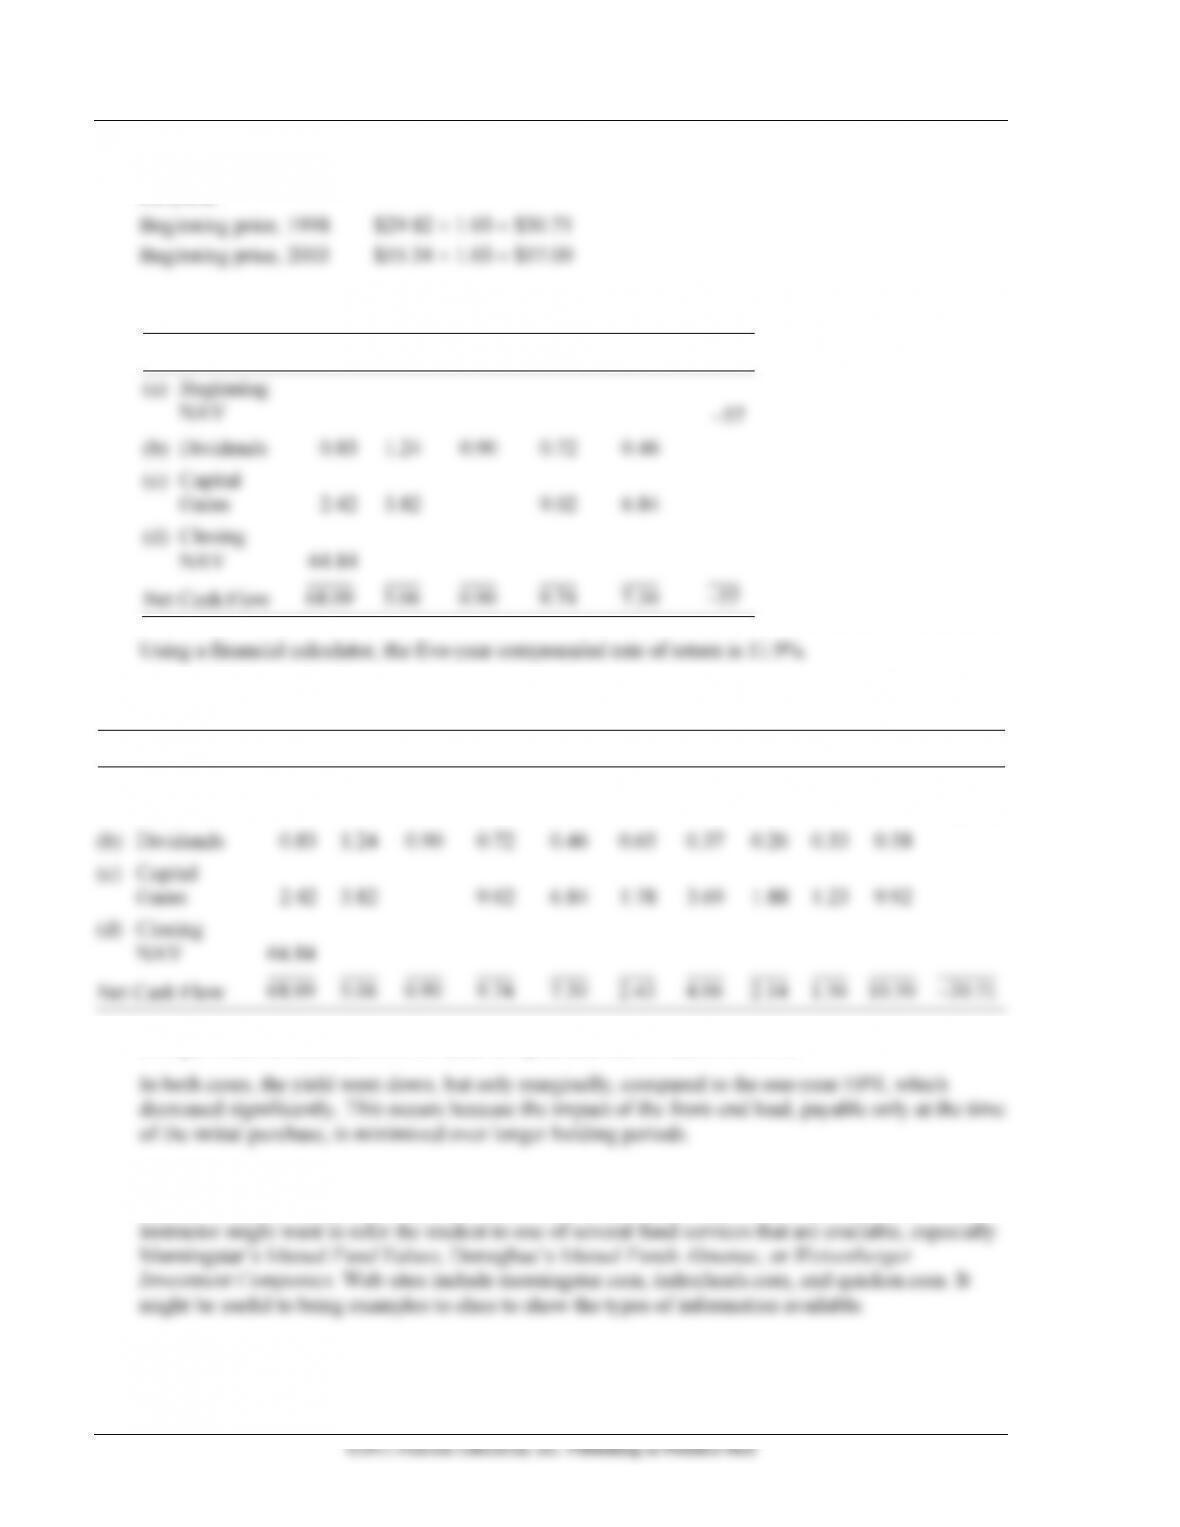
If the fund charges a 3% load on NAV, the beginning price would be different and that would change
the yield:
Compounded Return for the Five-Year Period with Loading
2011
2010
2009
2008
2007
2006
(a) Beginning
NAV
−57
(b) Dividends
0.83
1.24
0.90
0.72
0.46
(c) Capital
Gains
2.42
3.82
9.02
6.84
(d) Closing
NAV
64.84
Net Cash Flow
68.09
5.06
0.90
9.74
7.30
57−
Using a financial calculator, the five-year compounded rate of return is 11.9%.
Compounded Return for the Ten-Year Period with Loading
2011
2010
2009
2008
2007
2006
2005
2004
2003
2002
2001
(a) Beginning
NAV
−30.71
(b) Dividends
0.83
1.24
0.90
0.72
0.46
0.65
0.37
0.26
0.33
0.58
(c) Capital
Gains
2.42
3.82
9.02
6.84
1.78
3.69
1.88
1.23
9.92
(d) Closing
NAV
64.84
Net Cash Flow
68.09
5.06
0.90
9.74
7.30
2.43
4.06
2.14
1.56
10.50
30.71−
Using a financial calculator, the ten-year compounded rate of return is 20.4%.
6. There is no set solution to this problem since the answers will vary with the funds selected by the
student. There are many funds that the student can choose from to answer this question. The
248 Gitman/Joehnk/Smart • Fundamentals of Investing, Eleventh Edition
(c) Reverend Mark Thomas’s specific investment needs are retirement and college education for his
child. Both objectives favor a conservative growth fund or a growth-and-income fund. A good
Case 12.2 Calvin Jacobs Seeks the Good Life
In contrast to the previous case, in which the investor was interested in long-term wealth accumulation,
this case illustrates a situation in which current income is the primary objective.
(a) Given Calvin’s existing financial condition, he can take on a certain amount of risk. Also, Calvin
wants to consume immediately. In that sense, an income fund seems attractive. He could obviously
(c) Calvin is clearly not in need of any savings plan. He already has a considerable amount of savings
and is able to manage things well on his own. What Calvin needs is a withdrawal plan because he
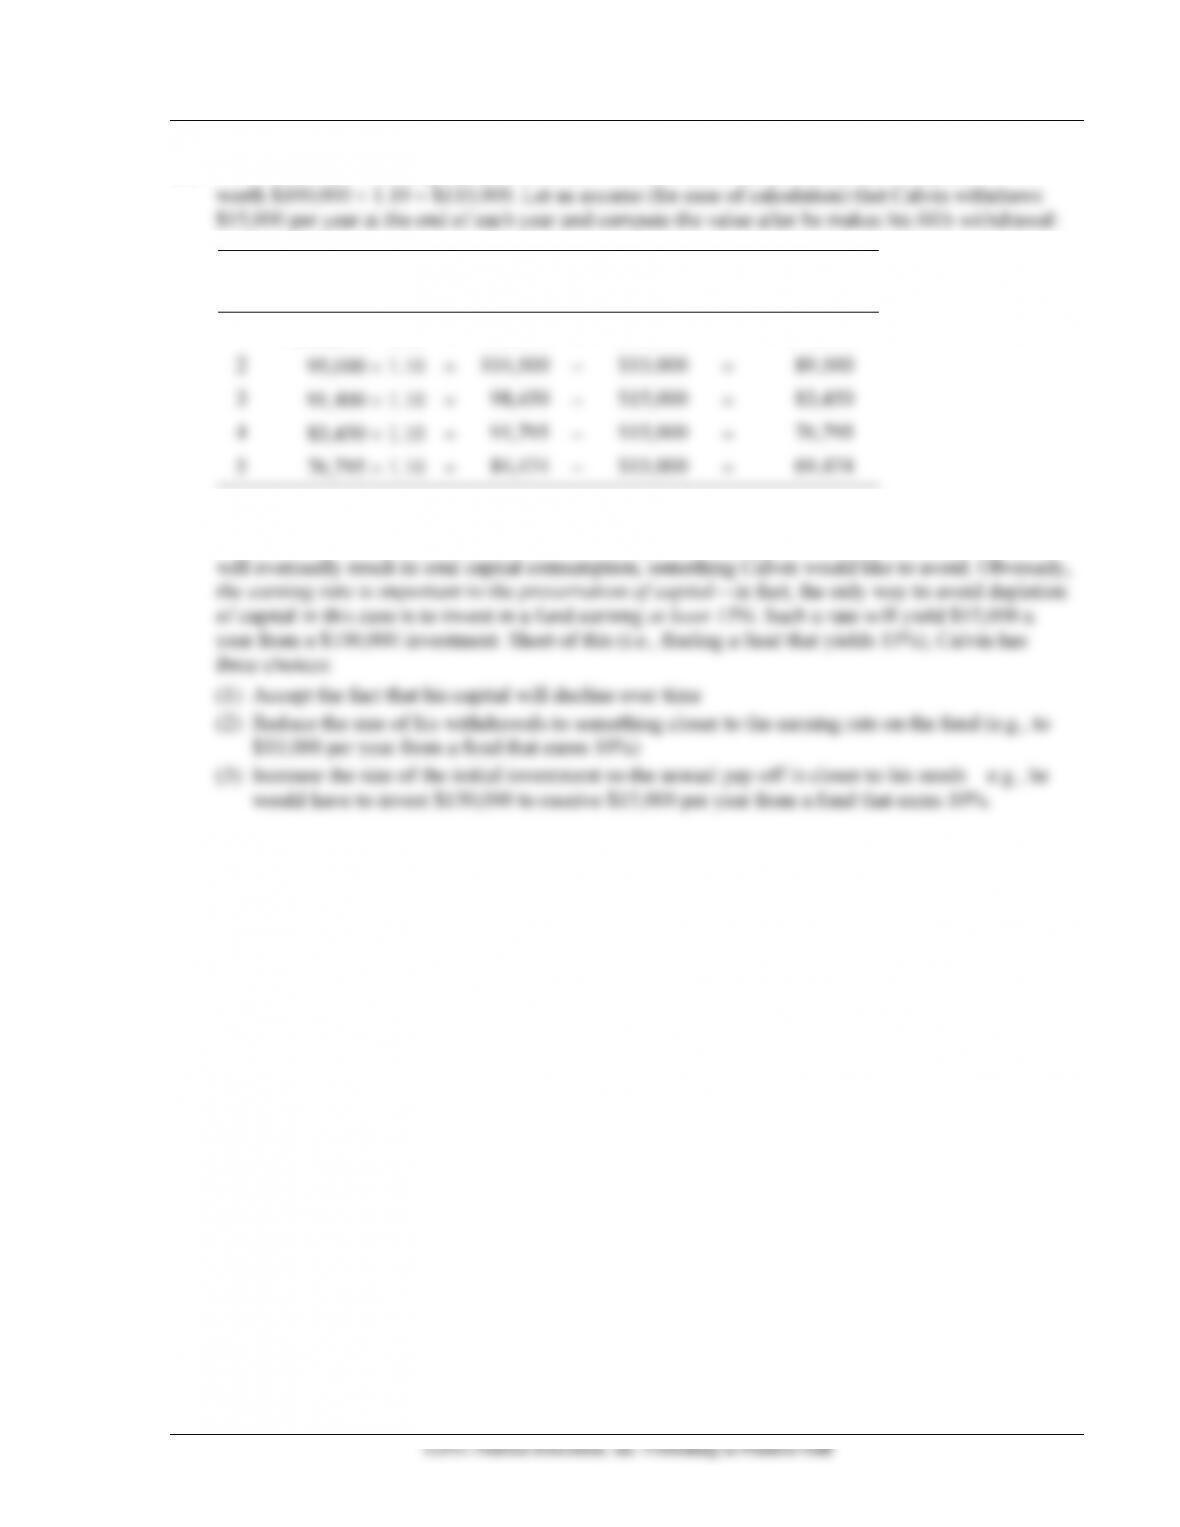
Chapter 12 Mutual Funds: Professionally Managed Portfolios 249
(d) Fund earns 12%. Starting balance is $100,000. At the end of the first year, this would be
Year
Initial
Sum
Ending
Sum
Less Annual
Withdrawal
Balance
End of Year
1
$100,000 1.10
=
110,000
−
$15,000
=
$95,000
2
95,000 1.10
=
104,500
−
$15,000
=
89,500
3
91,400 1.10
=
98,450
−
$15,000
=
83,450
4
83,450 1.10
=
91,795
−
$15,000
=
76,795
5
76,795 1.10
=
84,474
−
$15,000
=
69,474
Thus, at a 10% earning rate, the value of his $100,000 investment will steadily decline to $69,474 by
the end of the fifth year. The reason for this is simple: he’s taking out more than he’s earning. This
◼ Answer to Chapter Opening Problem
Answers will vary depending on when students solve it.
◼ Outside Project
Chapter 12 The Other Kind of Investment Company
The most popular form of investment company is the open-end mutual fund. But the closed-end company
also holds a place in the market for professionally managed investment companies. This project will help
you understand the difference between open-end mutual funds and closed-end investment companies.
From the list of closed-end companies given in the text, select a diversified stock fund and a bond fund; in
addition, find two open-end mutual funds that have roughly the same investment objectives. You can find
information on fund objectives, etc. in Weisenberger Investment Companies or any other similar
investment company’s services. Now compare the four funds by looking at the following features:
(a) Management fee charged
(b) How long the fund has existed
(c) Size of the fund or amount of dollars under management

250 Gitman/Joehnk/Smart • Fundamentals of Investing, Eleventh Edition
(d) Financing of the fund—does it issue debt to employ leverage?
(e) Dividend and capital gains distributions for the last three to five years
(f) The approximate yield for the last three years
(g) Load charges
Comment on your findings. Do you think open- and closed-end companies really behave all that
differently? In the final analysis, what’s the most important thing in determining the amount of
investment success (or failure) achieved by open- and closed-end funds?