Unlock document.
This document is partially blurred.
Unlock all pages and 1 million more documents.
Get Access
ANSWERS TO APPLICATION QUESTIONS
22. Here are four populations and a potential sample frame for each one. With each pair,
identify (1) members of the population who are not in the sample frame, and (2)
sample frame items that are not part of the population. Also, for each one, would you
judge the amount of sample frame error to be acceptable or unacceptable?
Population Sample Frame
a. Buyers of Scope mouthwash Mailing list of Consumer Reports
subscribers
Omitted are Scope buyers who do not subscribe to Consumer Reports, a very
considerable number, no doubt. Included are all those who do subscribe but do not
b. Listeners of a particular FM Telephone directory in your city
radio classical music station
Omitted are unlisted and new telephone listings, while included are those with listed
c. Prospective buyers of a new Members of Sales and Marketing Executives
day planner and prospective International (a national organization of
clients tracking kit sales managers)
Omitted are sales persons who do not belong to SMEI, probably a very considerable
proportion of all salespeople in the area. Included are retired salespeople, sales
d. Users of weatherproof decking Individuals’ names registered at a recent
materials (to build outdoor decks) home and garden show
Omitted are all those who did not attend the show plus those who did attend but did
not register. Included are people who have decks, people who do not want a deck, and
23. Here are some numbers that you can use to sharpen your computational skills for
Copyright © 2012 Pearson Education, Inc. publishing as Prentice Hall
1
sample size determination. Crest toothpaste is reviewing plans for its annual survey
of toothpaste purchasers. With each case that follows, calculate the sample size
pertaining to the key variable under consideration. Where information is missing,
provide reasonable assumptions. You can check your computations by using the
sample size calculation feature of the XL Data Analyst.
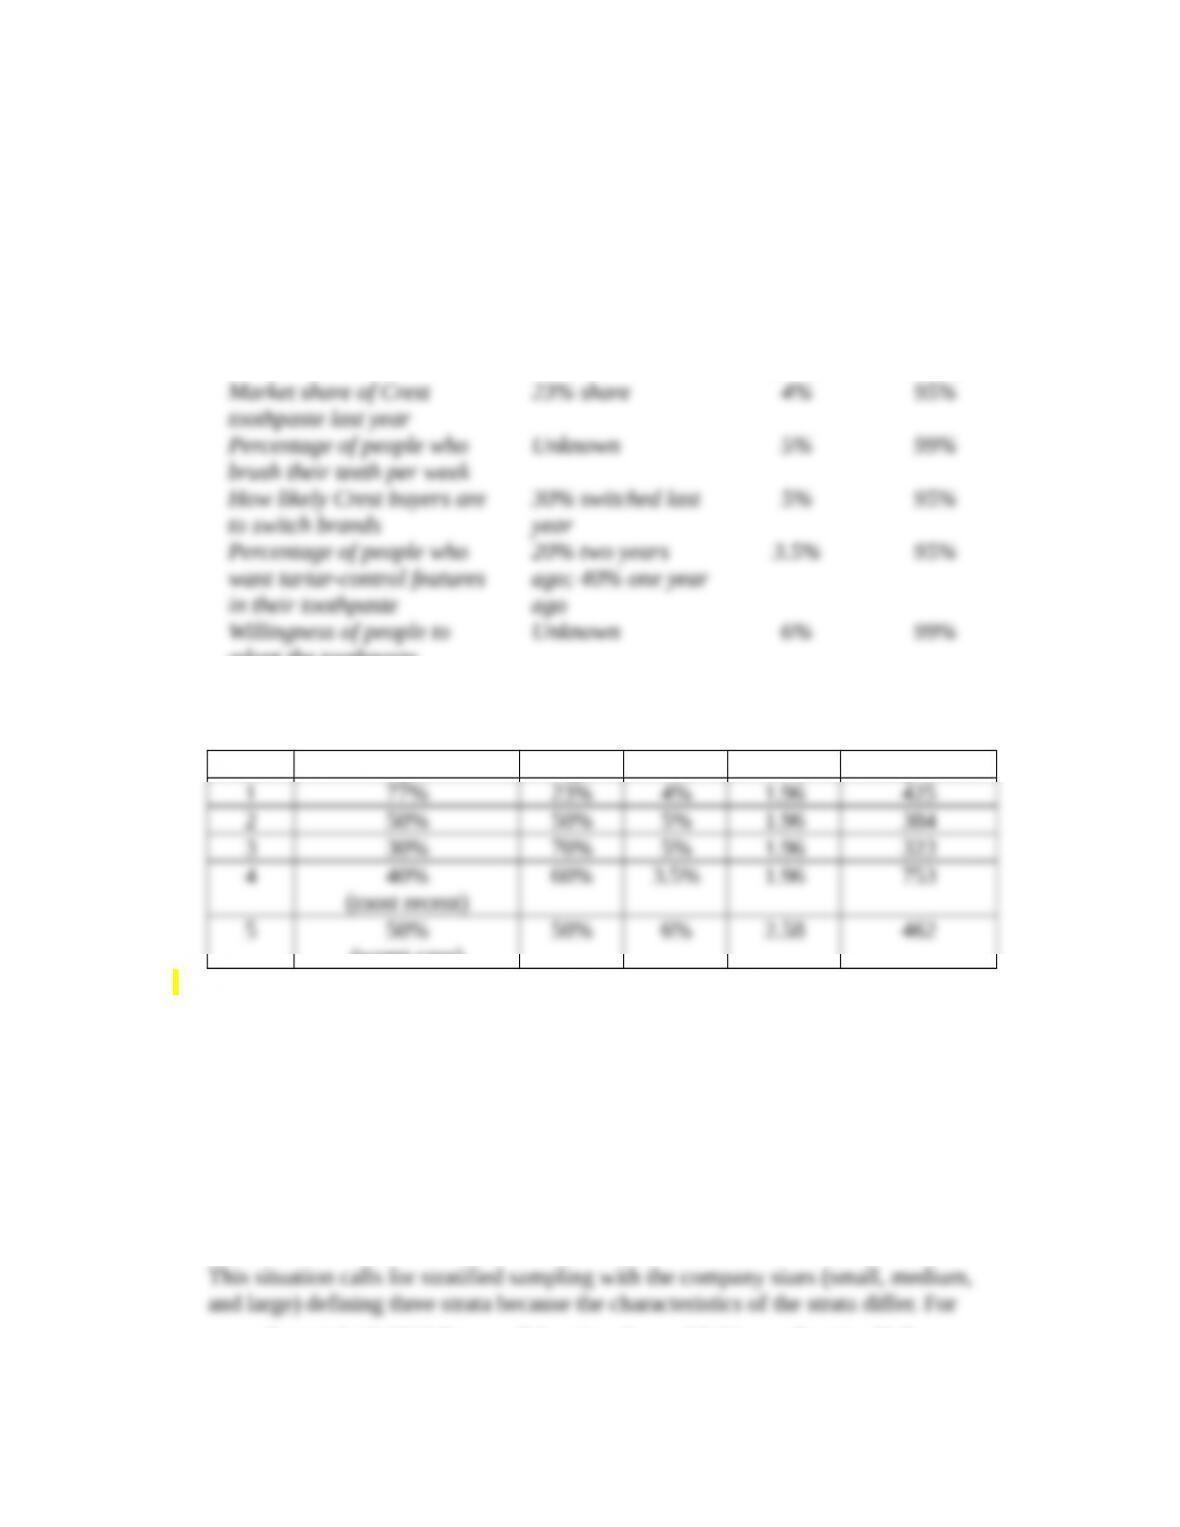
Key Variable Variability Acceptable
Error
Confidence
Level
adopt the toothpaste
The calculations and rationale for each follow:
Case p q e z Sample size
(worst case)
24. A researcher has the task of estimating how many units of a new, revolutionary
photocopy machine (it does not require ink cartridges and it is guaranteed not to
jam) will be purchased among business firms in Cleveland for the coming annual
sales forecast. She is going to ask the likelihood that they will purchase the new
device and for those that are “very likely” to purchase, she wants the respondents at
the companies to estimate how many machines their company will buy. She has data
that will allow her to divide the companies into small, medium, and large firms based
upon number of employees at the Cleveland office.
What sampling plan should be used? Why?
Copyright © 2012 Pearson Education, Inc. publishing as Prentice Hall
2
example, some small firms may not be able to afford a single machine, but many
large companies may purchase multiple units for multiple locations. Similarly, the
25. Honda USA is interested in learning what its 550 U.S. dealers think about a new
service program Honda USA provided the dealers at the beginning of last year.
Honda USA wants to know if the dealers are using the program and, if so, their likes
and dislikes about the program. Honda USA does not want to survey all 550 dealers
but wants to ensure that the results are representative of all the dealers.
What sampling plan should be used? Why?
Honda dealerships are relatively homogeneous or highly similar, so there is no need
to stratify. Large geographic differences (weather, altitude, typology, etc.) exist, so
For SRS, number the dealers 1 through 550 and use a random number generator to
For a systematic sample, arrange the dealerships alphabetically. Draw a random
number between 1 and 550. Then use the skip interval (550/n) to select the dealers.
26. Applebee’s Restaurants has spent several thousand dollars advertising the restaurant
during the last two years. They wish to have some input into what effect the
advertising has made and they decide to measure TOMA (Top of Mind Awareness). A
TOMA “score” for such a restaurant is the ranking a firm has as a result of asking a
representative sample of consumers in the service area to “Name a non-fast-food
restaurant.” The restaurant that is named by the most persons has the #1 TOMA
score, and so on. It is important that Applebee’s management conduct their TOMA
survey on a representative sample in the metropolitan area.
What sampling plan should be used? Why?
Such surveys are commonly administered by telephone. The strong desire for a
representative sample leads to the use of a probability sample method. A Random
27. We have a 7-point scale to measure the construct: likelihood of buying a new car. We
wish to estimate the mean score on the scale and we want to be 95% confident that
Copyright © 2012 Pearson Education, Inc. publishing as Prentice Hall
3
our sample statistic (mean) is within ±0.5 of a scale point from the true population
parameter.
a. Calculate the required sample size.
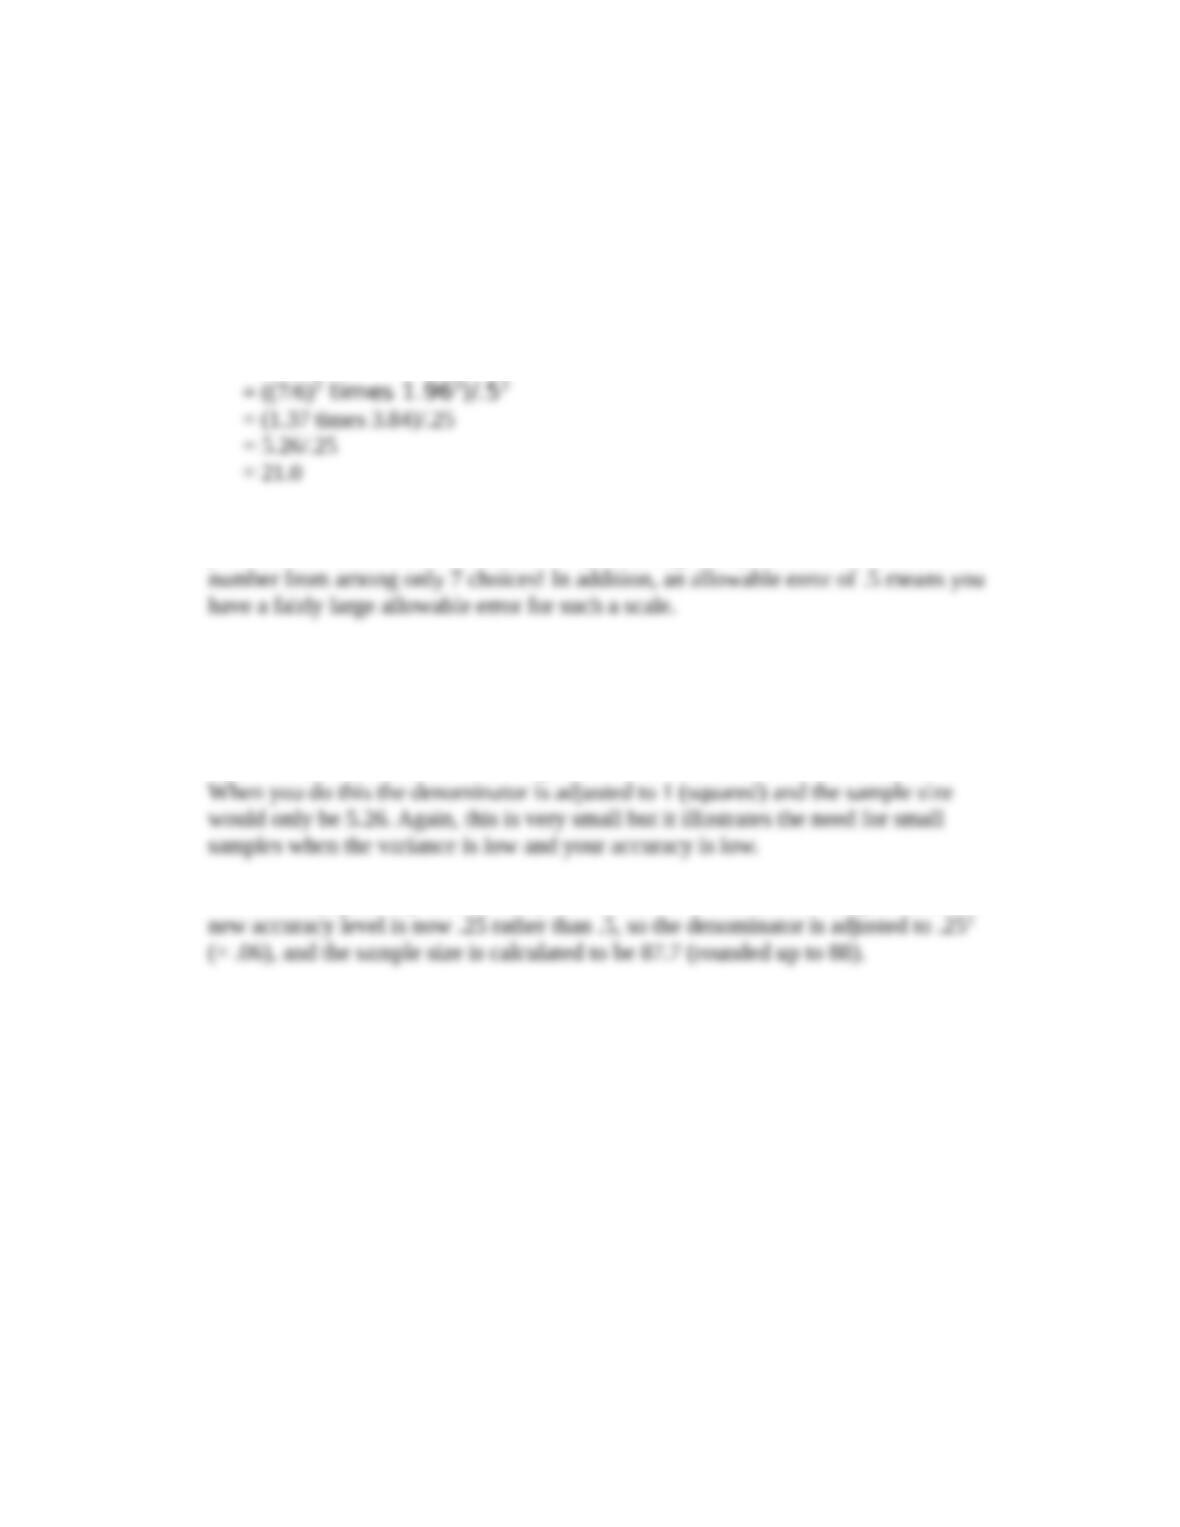
This use of the 7-point metric scale means that sample size formula for a mean should
be used. There is no information on the variability, so to estimate “s,” it is advisable
to use the “range/6” approach. Thus, the sample size (n) would be:
Note: This may seem like a small sample size and it is. Why? With a 7-point scale
you have limited variance. It does not require a large sample size to estimate a
b. After you calculate the sample size in 27a, you decide you want to halve the level
of accuracy. What would the new sample size be?
This requires students to think about the concept of accuracy. HALVING accuracy
means to make it LESS accurate so your new e should be set at 1.0 instead of .5.
Alternatively, you may want to ask your students to DOUBLE accuracy. Then, the
28. A plan is set before all state universities to require classes to meet either three or four
days a week in order to make better use of classroom facilities, because currently
classrooms sit empty Friday afternoons and evenings and on Saturday. However,
some schools that have a large percentage of commuter schools are concerned that
this proposal will put a hardship on their commuter students because it will require
more driving to/from the campus. University officials want to estimate the average
number of miles driven, one way, to campus by its commuter students. It is estimated
that some students drive as little as 0 miles to campus while at least one student
reported driving one way as far as 60 miles. University officials want to be 95%
confident that the sample mean is no more than ±2 miles from the real average
number of miles driven in the population.
Copyright © 2012 Pearson Education, Inc. publishing as Prentice Hall
4
a. What is the required sample size?
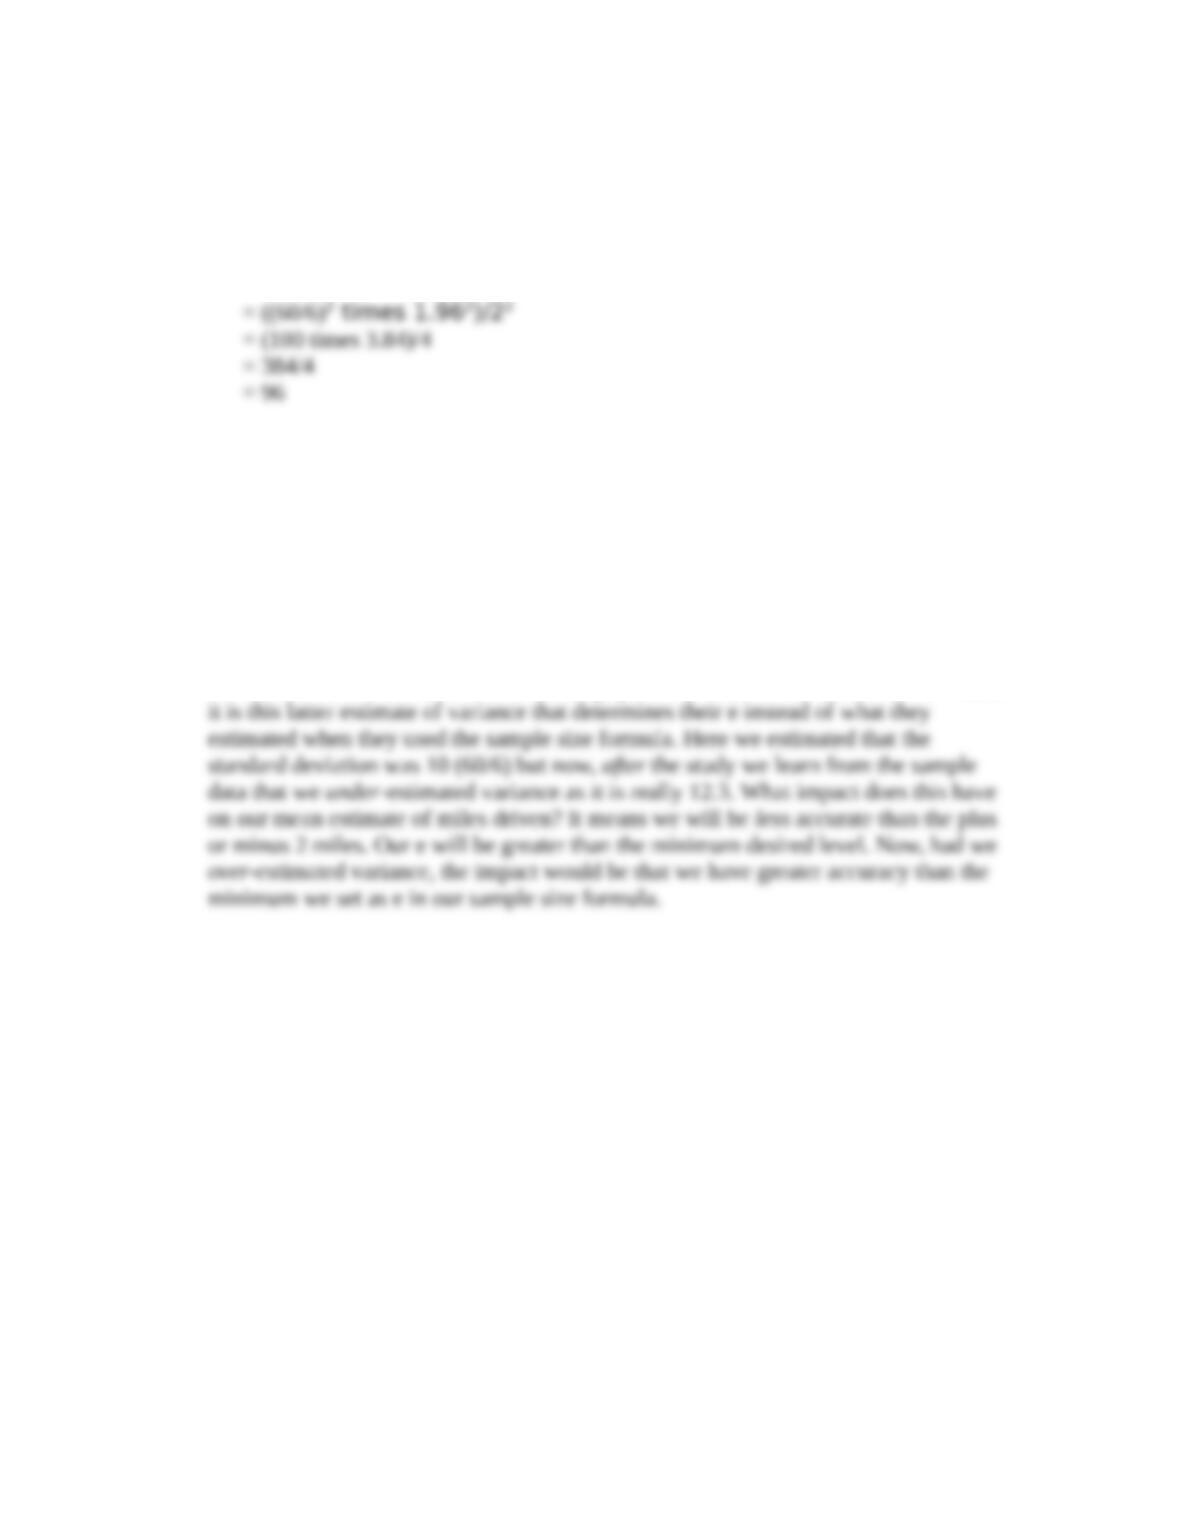
This use of miles commuted means that sample size formula for a mean should be
used. There is no information on the variability, so to estimate “s,” it is advisable to
use the “range/6” approach. Thus, the sample size (n) would be…
b. After the study is conducted we learn that the standard deviation in the sample
data, which is now our best estimate of s, is actually 12.3. What impact does this
new measure of variation have on the mean number of miles driven that we also
derived from our sample?
The key to understanding this question is to make students think about what they
were doing when they calculated the sample size—they were estimating variance.
However, after the study, we have a representative sample from the population and
we can easily calculate variance in this data. Data from the sample should now be our
best estimate of the actual variance in the population. So, now students need to realize
CASE SOLUTIONS
Case 9.1 Target: Deciding on the Number of Telephone Numbers
Case Objective: With this case students must use the formula for the number of
telephone numbers needed in order to obtain a target final sample size.
Answers to Case Questions
1. With a desired final sample size of 250 for each region, what is the
lowest total number of telephone numbers that should be
purchased for each region?
Copyright © 2012 Pearson Education, Inc. publishing as Prentice Hall
5
2. With a desired final sample size of 250 for each region, what is the
highest total number of telephone numbers that should be
purchased for each region?
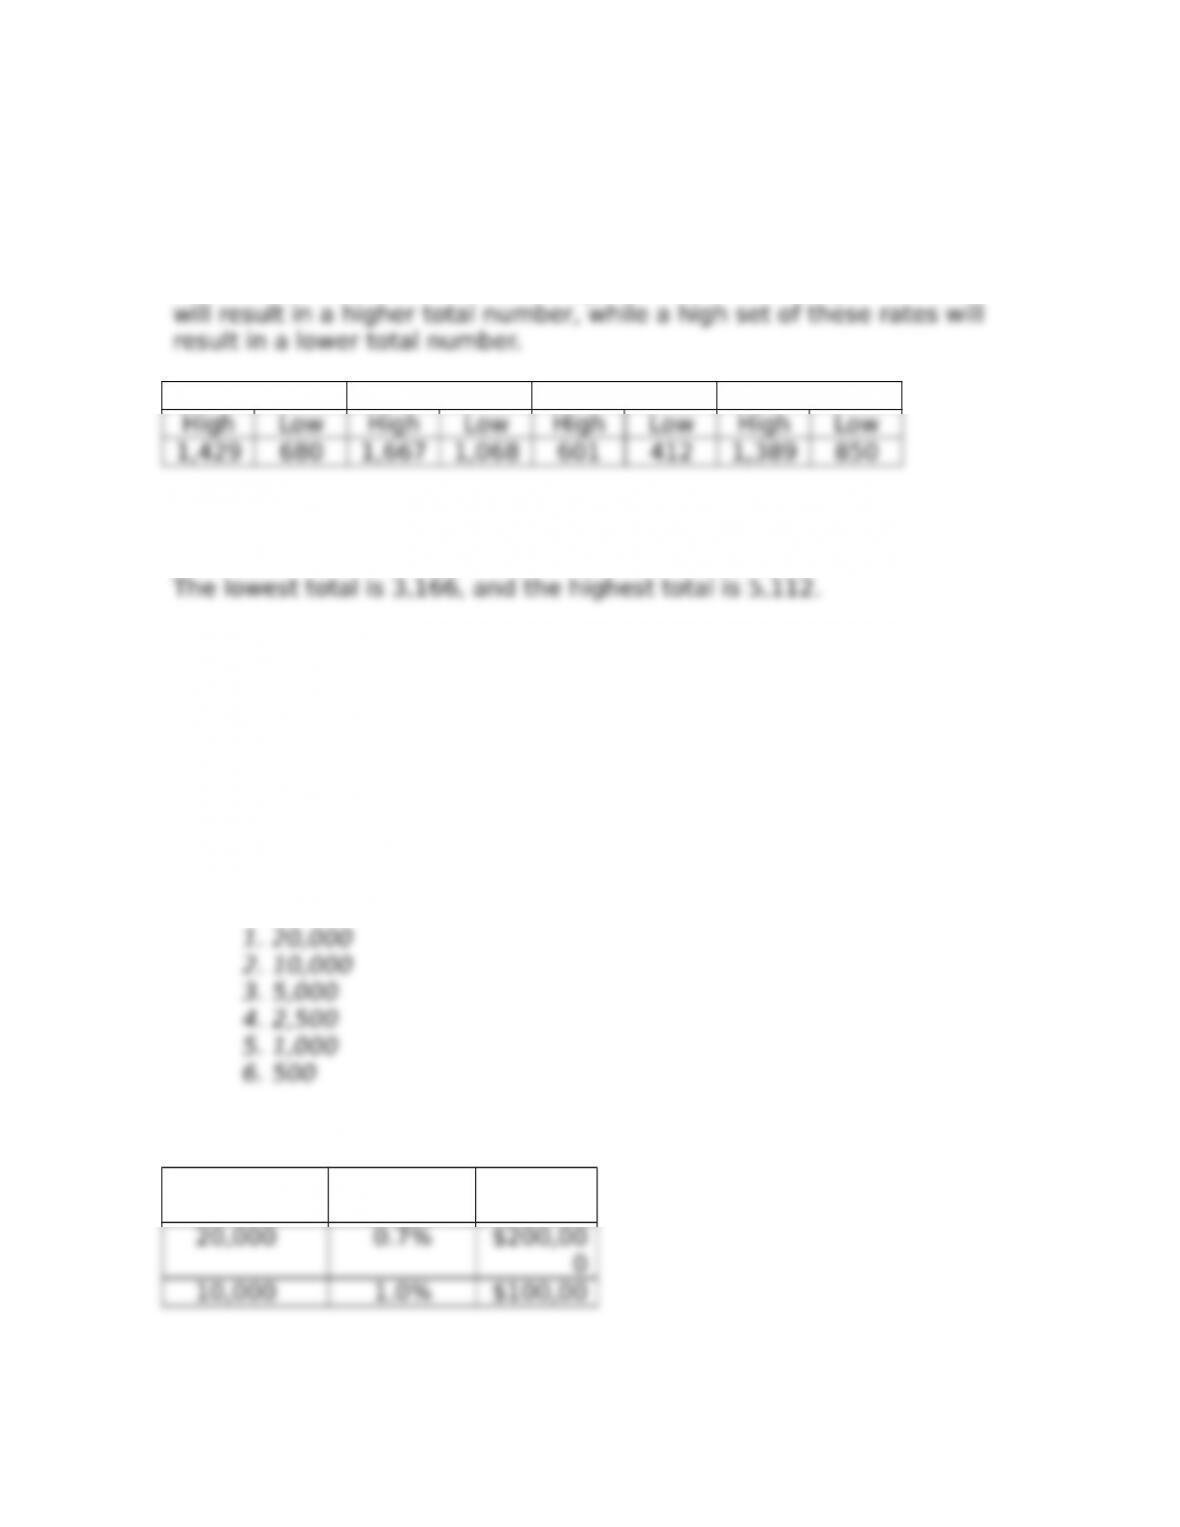
The low and high numbers are in the following table. Students must
realize that a low estimated working, incidence, and completion rate
North South East West
3. What is the lowest and highest total number of telephone numbers
to be purchased for the entire survey?
Case 9.2 Integrated Case: Advanced Automobile Concepts
Case Objective: This case requires students to compute sample size
error and to calculate the associate costs of various
sample sizes computed.
Answers to Case Questions
For each of the following possible sample sizes, calculate the
associated expected cost of the panel sample and the sample error.
Using p = q = 50%, the associated errors and costs are below.
Sample
size
Error
(95%)
Cost
Copyright © 2012 Pearson Education, Inc. publishing as Prentice Hall
6

Copyright © 2012 Pearson Education, Inc. publishing as Prentice Hall
7


