ANSWERS TO REVIEW QUESTIONS
1. Define each of the following:
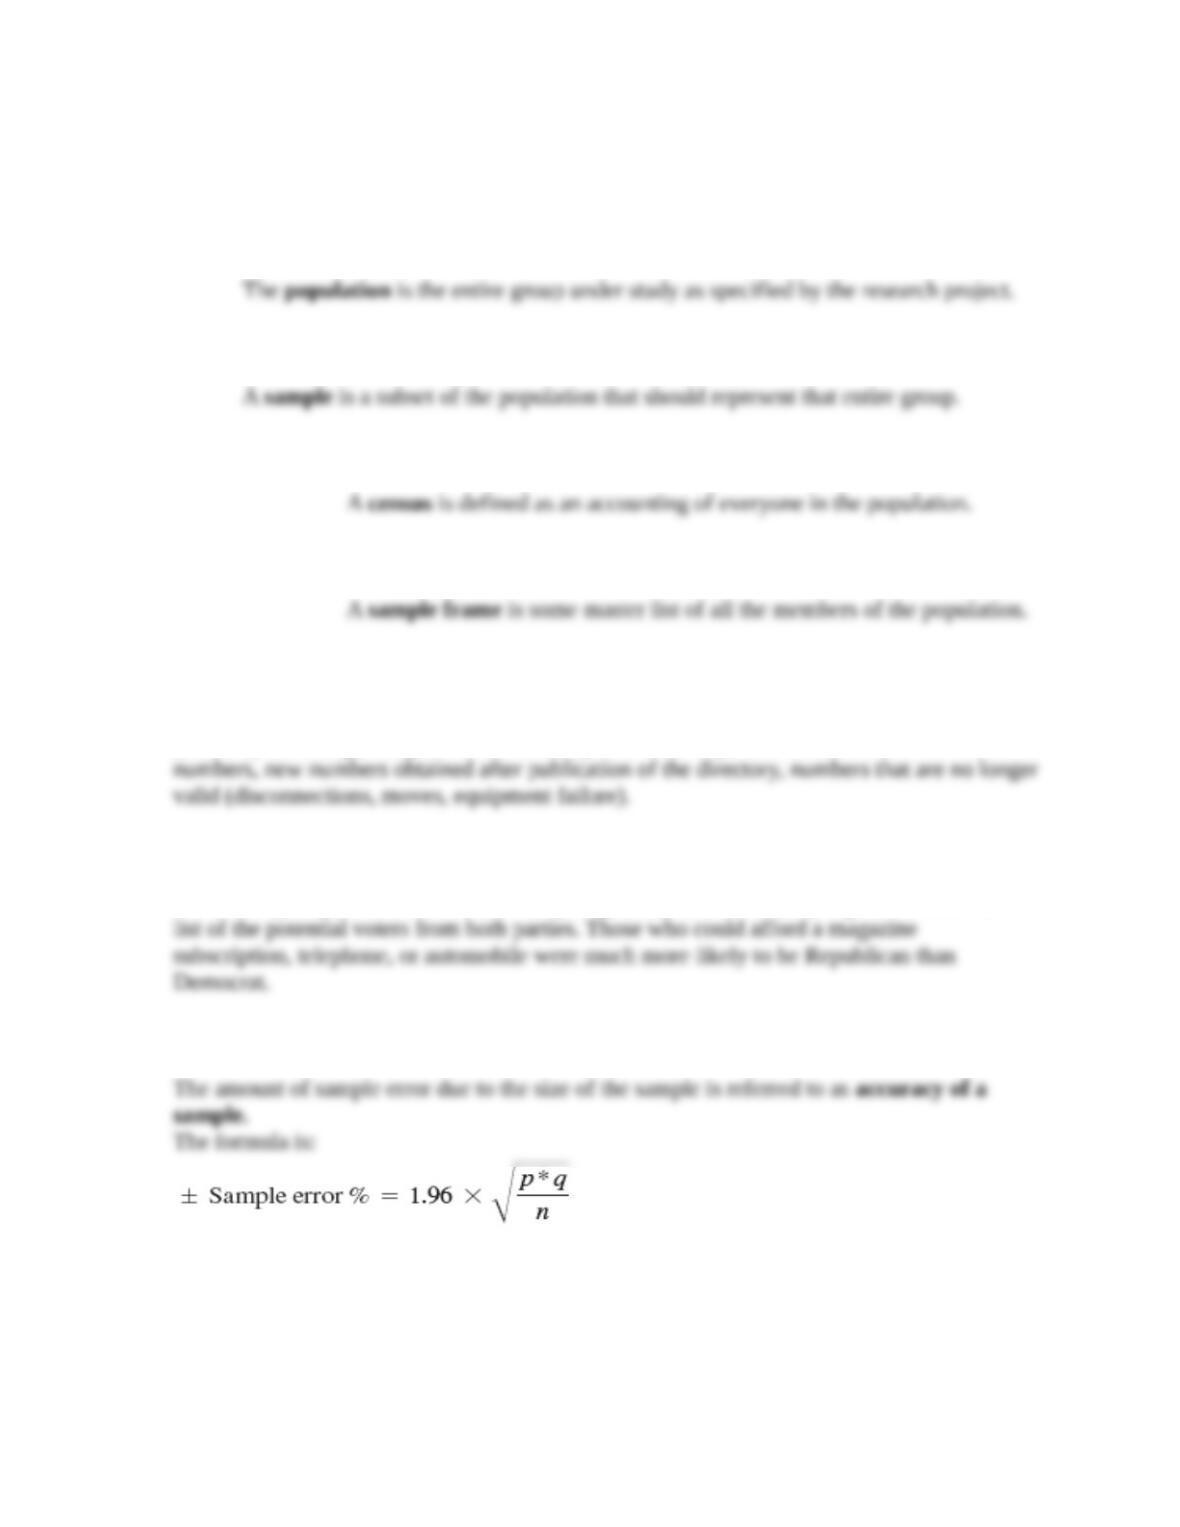
a. Population
b. Sample
c. Census
d. Sample Frame
2. Indicate the sample frame error typically found in the households listing of a telephone book.
Sample frame error is the degree of misrepresentation of the population in the sample frame
(directory or listing) being used. For the telephone directory, error is in the forms of: unlisted
3. Explain why the Literary Digest survey of the Landon/Roosevelt election was so incorrect.
The Literary Digest had used an unusually large sample, but the sampling frame was not a
4. What is meant by accuracy of a sample and what is the formula to measure it?
5. What is the formula for estimating a percentage in the population? Explain what z, p, q, and
e represent.
Copyright © 2012 Pearson Education, Inc. publishing as Prentice Hall
1
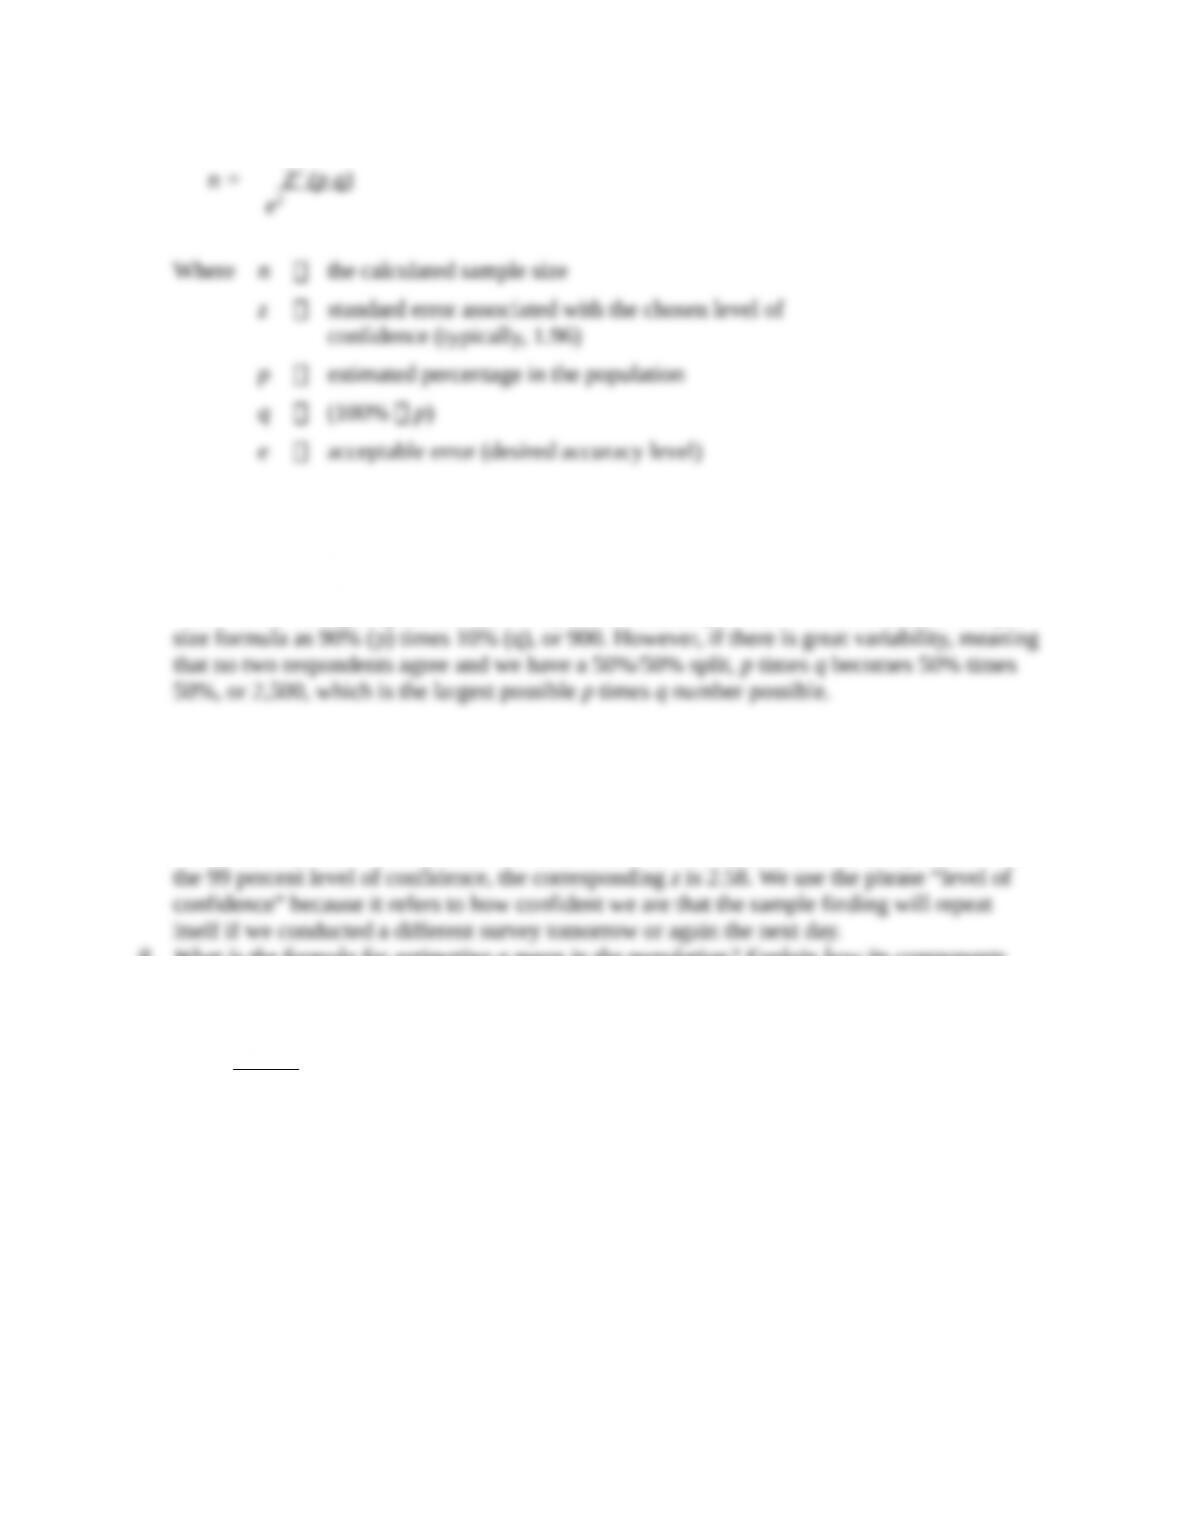
6. What does p, q measure and what relationship does this have to the size of the sample, given
all else is equal?
The percentage, p, will be the sample finding which is an estimate of the true population
value. If our survey respondents have very little variability, it will be reflected in the sample
7. What do we mean by “level of confidence” and how is it expressed in the sample size
formula?
We need to decide on a level of confidence, and it is customary among marketing researchers
to use the 95 percent level of confidence, in which the z is 1.96. If a researcher prefers to use
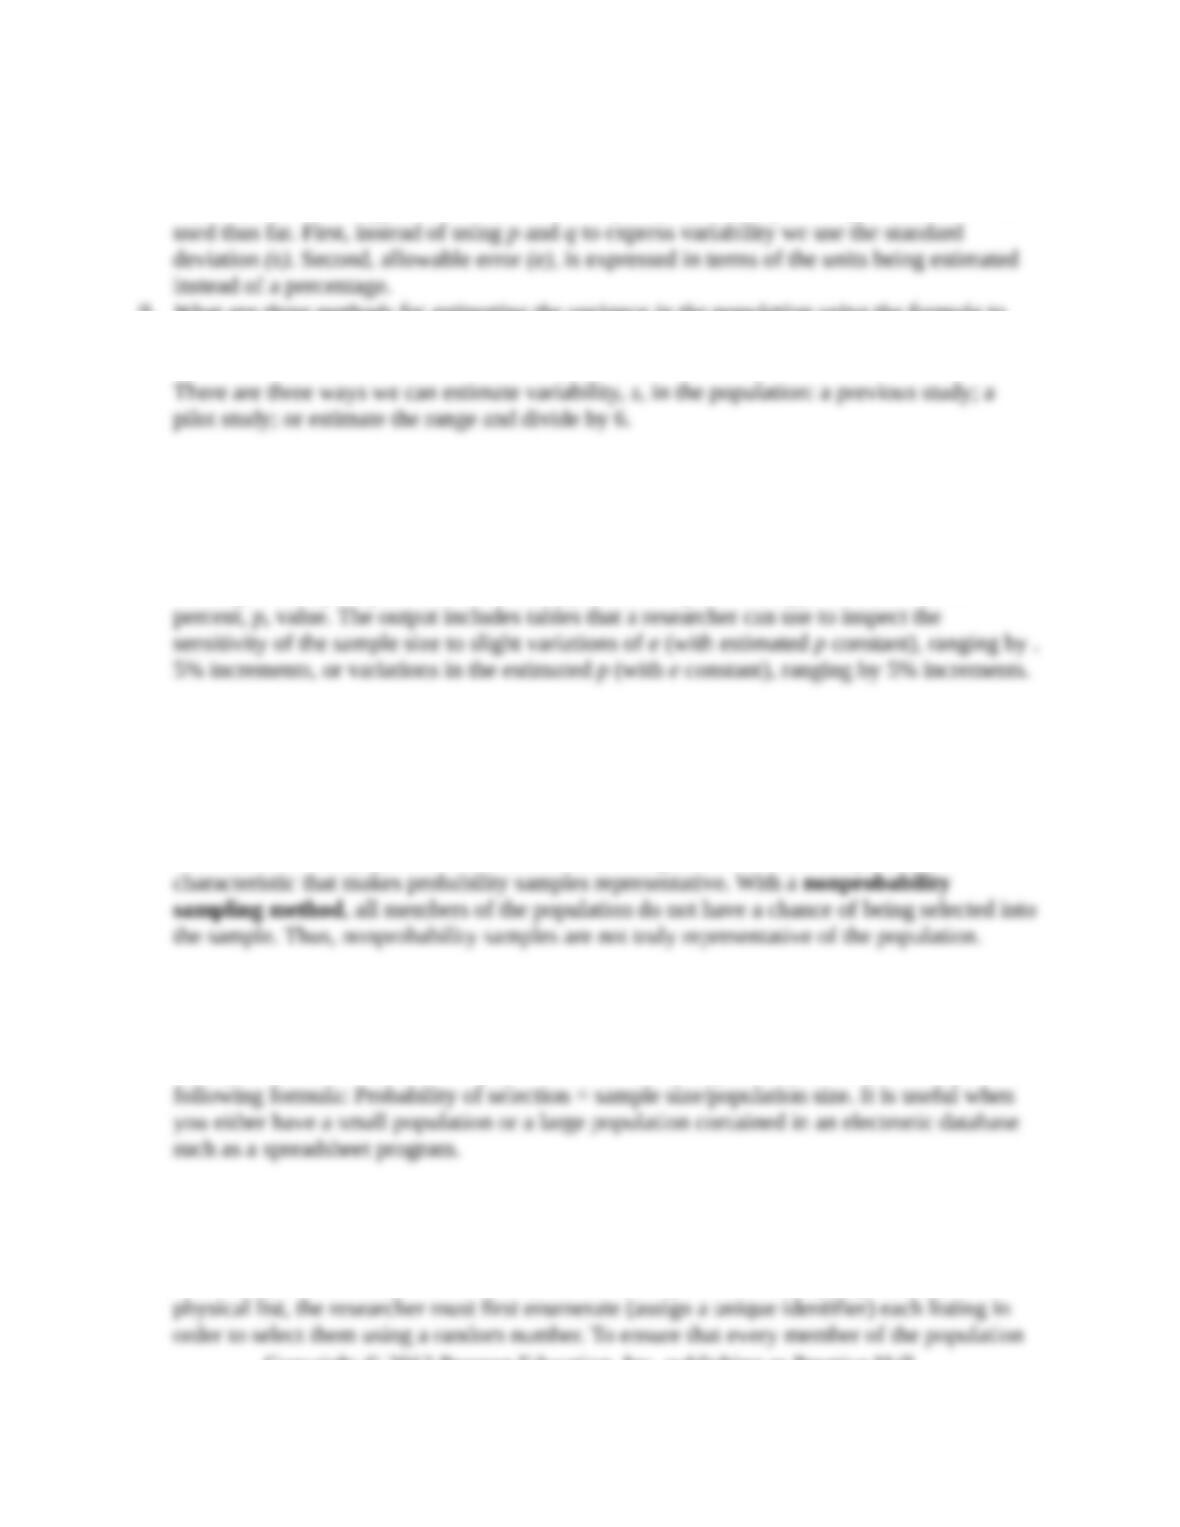
8. What is the formula for estimating a mean in the population? Explain how its components
are different/like the components in the formula for estimating a percentage.
2
22
e
zs
n
Where n = the sample size
z = standard error associated with the chosen level of confidence (typically, 1.96)
s = variability indicated by an estimated standard deviation
e = the amount of precision or allowable error in the sample estimate of the
Copyright © 2012 Pearson Education, Inc. publishing as Prentice Hall
2
population
The formula and its application differ in two key ways from our percentages formula we have
9. What are three methods for estimating the variance in the population using the formula to
calculate the sample size for estimating a mean?
10. Explain how you would use XL Data Analyst to calculate the desired sample size to estimate
a percentage in the population.
Use the menu sequence Calculate—Sample Size, which opens up the selection window
where you can specify the allowable error (desired sample accuracy) and the estimated
11. How do probability samples differ from nonprobability samples and what is the significance
of this difference?
Sample methods that embody random sampling are termed probability sampling methods
because the chance of selection can be expressed as a probability. With probability sampling,
all members of the population have a chance of being included in the sample and it is this
12. What is simple random sampling and when would you use it?
With simple random sampling, the probability of being selected into the sample is “known”
and equal for all members of the population. This sampling technique is expressed by the
13. What is systematic sampling and when would you use it?
Systematic sampling is a way to select a simple random sample from a directory or list that
is much more efficient (uses less effort) than with simple random sampling, because with a
Copyright © 2012 Pearson Education, Inc. publishing as Prentice Hall
3
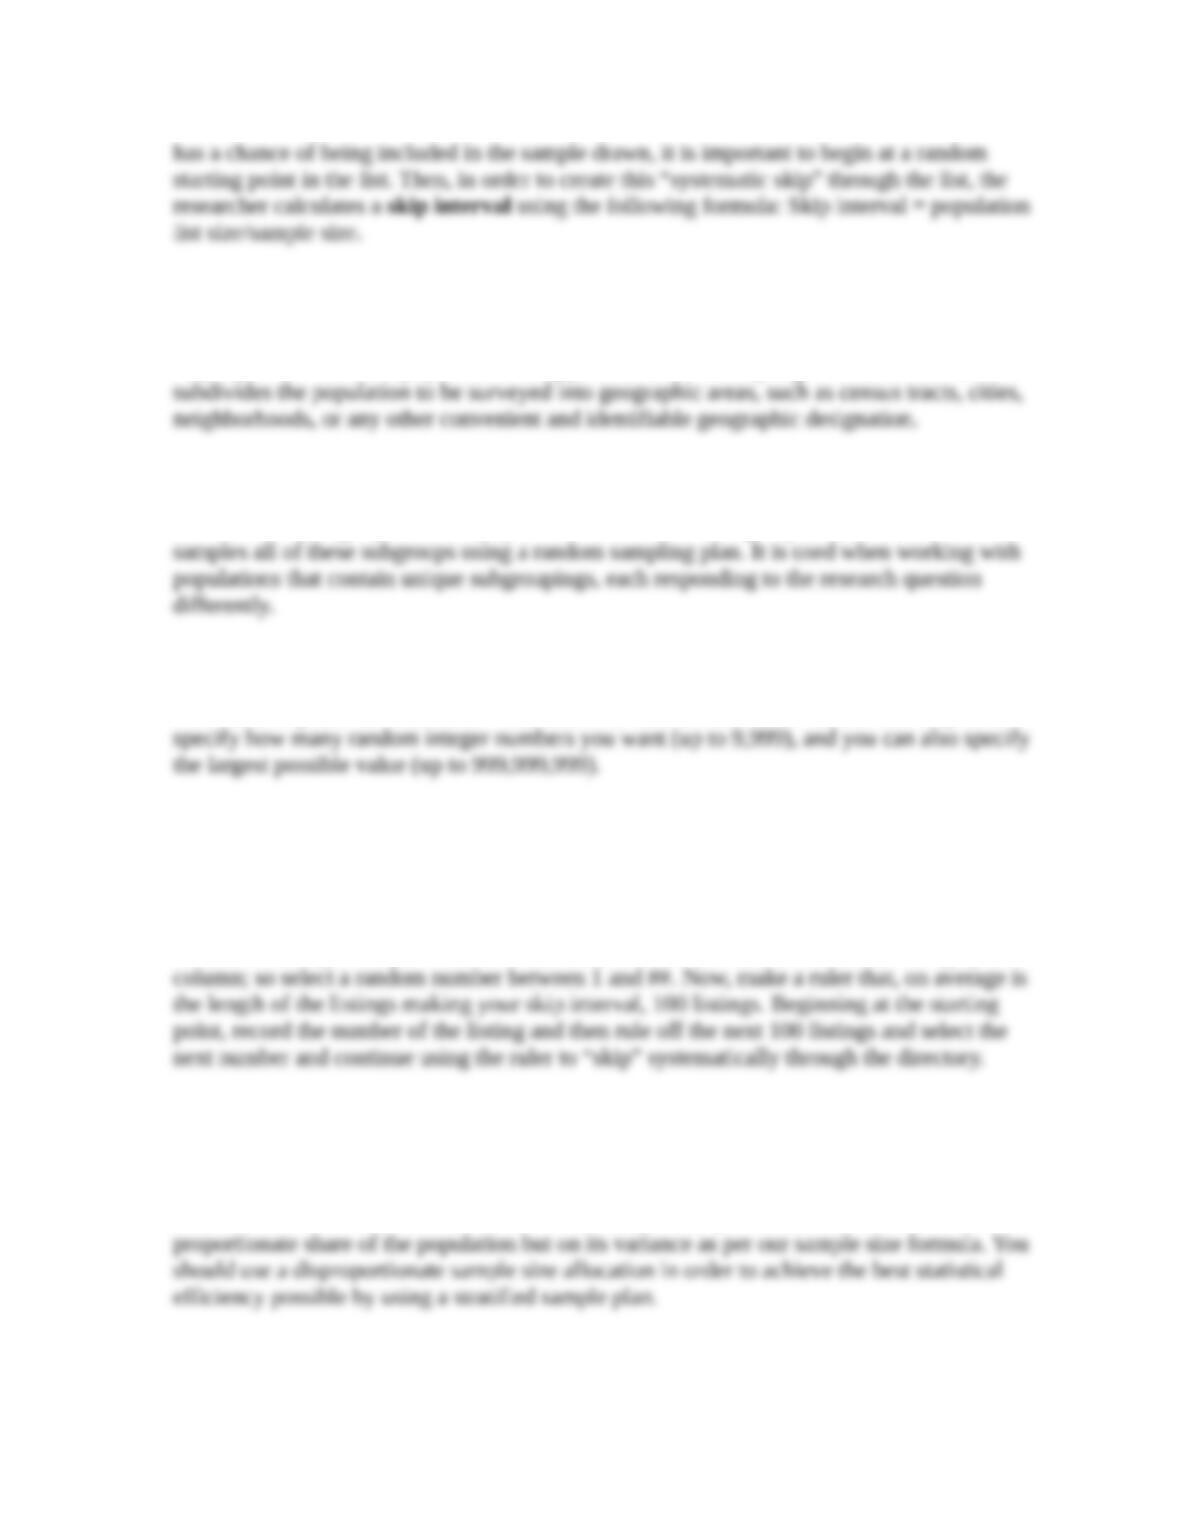
14. What is cluster sampling and when would you use it?
In cluster sampling, the population is divided into subgroups, called “clusters,” each of which
may represent the entire population. An application is area sampling where the researcher
15. What is stratified sampling and when would you use it?
Stratified sampling separates the population into different subgroups, or strata, and then
16. How would you use XL Data Analyst to generate random numbers?
The menu sequence is “Calculate—Random #’s,” and the selection window allows you to
17. Explain how you would use the skip interval in a systematic sample if you had to draw a
sample from your city telephone directory.
First, to begin at a random starting point, select a page of the directory using a table of
random numbers. If there are X columns on each page, select a random number from 1 to X.
And, after taking a sample of a few columns, you conclude there are about ## listings per
18. Would you use a proportionate or disproportionate stratified sample? Why?
A proportionate sample size would occur if we allocated sample size based upon each
stratum’s proportionate share of the total population. A disproportionate sample is any other
allocation which would occur if we based our sample size per stratum not on its
Copyright © 2012 Pearson Education, Inc. publishing as Prentice Hall
4
19. Describe the four types of nonprobability samples.
Refer to Table 9.1.
Convenience Sampling—the researcher selects respondents who are convenient. For
example, the college professor surveys his/her class to learn about the attitudes of college
Judgment Sampling—the researcher uses his or her judgment or that of some other
knowledgeable person to identify who will be in the sample. For example, the professor
selects several different classes in different colleges to interview. The TV reporter interviews
Referral Sampling—respondents are asked for the names, or identities of others like
themselves who might qualify to take part in the survey. Members of the population who are
Quota Sampling—the researcher identifies quota characteristics such as demographic or
product-use factors and uses these to set up quotas for each class of respondent. The sizes of
the quotas are determined by the researcher’s belief about the relative size of each class of
20. What are the drawbacks of using a nonprobability sample and why are they used?
Nonprobability samples result in samples that are not representative of some larger
population and when we use them, we cannot predetermine the accuracy of our findings
because the sample size formulas are only used with representative samples.
However, they are used for the following reasons:
21. Briefly explain the three techniques presented in the chapter for online sampling.
Copyright © 2012 Pearson Education, Inc. publishing as Prentice Hall
5

The three techniques are:
Copyright © 2012 Pearson Education, Inc. publishing as Prentice Hall
6