CHAPTER 7
Measurement Scales
LEARNING OBJECTIVES
To examine question formats commonly used in marketing research
To understand the basic concepts in measurement
To learn about three levels of measurement used by marketing researchers
To appreciate why the type of measurement scale is important
To become familiar with scale types commonly used in marketing research
To illustrate common measures of constructs used in marketing research
CHAPTER OUTLINE
Question-Response Format Options
Open-Ended Response Format Questions
Categorical Response Format Questions
Metric Response Format Questions
Basic Measurement Concepts
Open-Ended Measurement
Categorical Measurement
Metric Measurement
Why the Level of a Scale Is Important
Commonly Used Synthetic Metric Scales
Symmetric Synthetic Scales
Nonsymmetric Synthetic Scales
Whether to Use a Symmetric or a Nonsymmetric Scale
Choosing Which Scale to Use
KEY TERMS
Aided open-ended format
Anchored n-point scale
Categorical measure
Categorical response format
“Check all that apply” question
Dual choice question
Halo effect
Level of measurement
Lifestyle
Likert scale
Measurement
Metric measure
Metric response question
Objective properties
One-way labeled scale
Open-ended response format
Operational definition
Properties
Reliable scale
Response probe
Scale development
Semantic differential scale
Stapel scale
Subjective properties
Synthetic label metric scale
Synthetic metric format
Synthetic number metric scale
Unaided open-ended format
Unanchored n-point scale
Valid scale
Multiple choice category question
Natural metric response format
Neutral point
N-point scale
TEACHING SUGGESTIONS
1. Here are some principles that one of the authors uses to introduce the notion of information
contained in scales in his class.
The Information Principle
The easier and faster you can give an answer,
the less information you will provide
The Simplicity Principle
The more simple the answer,
the less information in the answer (e.g. a check mark versus a number)
The Reporting Principle
The less information in the answers,
the less you (researcher) can tell the client about them
The Four Scale Properties Principle
A scale may have from one to four properties, and these properties are…
Labels—words or symbols that designate scale differences (e.g. male vs. female,
3 gallons, etc.)
Order—relative size differences between the labels
Distance—equal distances between adjacent labels
Origin—a true zero point (vs. a neutral answer)
Scales with fewer properties have less information
One property— LEAST information
While…
Scales with more properties have more information
Four properties—MOST information
2. Measurement of a construct requires an operational definition. Instructors may want to
review this concept, which is taken up in this chapter and elaborate on how an operational
definition indicates how a construct’s subjective and/or objective properties are measured on
a scale. For instance, “purchase intention” may be operationally defined as a respondent’s
indication on a 7-point scale where 1 corresponds to “not at all likely” and 7 pertains to “very
likely” to purchase the brand at his/her next purchase.
3. Scale development in an academic context is much more rigorous than in an applied context.
If an instructor desires to bring this difference to students’ attention, Churchill’s scale
development paradigm (Churchill [1979], “A Paradigm for Developing Better Measures of
Marketing Constructs,” Journal of Marketing Research, 16, 64–73) is a good vehicle. A
slightly different approach would be to relate the scale development steps reported in a recent
scale development article.
4. To help students understand the idea of measurable qualities, have them generate as many
different rating aspects of one or more of the following:
A convenience store
A department store
A new automobile
Use class discussion to point out how customers may harbor positive ratings on some
qualities, but negative ratings on others, and how this information has important marketing
implications.
5. Numerical versus letter grades can be used as an example of how higher-level scaling
assumptions (metric) provide more information than lower-level ones (categories). For
instance, take numerical grades. Suppose one student has an 89 average, and another student
has an 81 average. Assuming that 80to 89 defines the “B” letter grade range, both are B
students, but the 89 student is closer to an A, although the 81 student is closer to a C. This
closeness is not contained in the categorical letter grade system, but it is in the metric grading
system.
Class discussion can focus on whether it is better to have a ratio scale (1–100 scale) or an
ordinal (A–F scale) as a way to measure the goodness of students. How would students feel
about a categorical pass-or-fail system? Hopefully, students will desire a more sensitive scale
rather than a less sensitive one. The point is that with a low level scale, there is little
information about the performance of the individual student.
6. It is useful to remind students of the inability of observation and most other qualitative
methods to look into the minds of those people being studied. The reason for scaling stems
from a need to standardize respondents’ answers into a consistent format that can be used to
summarize and compare their answers.
An in-class exercise can be used to illustrate the need for and benefits of using standardized
scales. Select some subject with some controversial or emotional aspect to it. Possible

college examples include: dropping football from the athletic program to save money,
requiring freshmen and sophomores to live on campus, creating a walking campus with no
student or faculty vehicles allowed, or not awarding a diploma unless the graduating student
signs an agreement to contribute 1 percent of their income to the alumni fund. Have students
write down how they “feel” about the issue. Gather up the written comments and assign the
task of compiling the reactions to a team of three or four students. Once done, have other
students observe how the team goes about the compilation task.
Class discussion should bring out the fact that the qualitative information required judgments
along the way by the compilation team. Next, have students rate their feelings on the
controversial topic using a 7-point negative-to-positive scale. Have a student team compile
these responses with the rest of the class as observers. It should be apparent that the use of a
rating scale greatly simplifies the judgments and compilation activities.
7. Lifestyles and their measurement is a good research topic. Assign the topic to a student or a
student team to perform library research on it and report findings to the class. You may want
to expand the assignment to include VALS. Sending students to the SRI VALS home page at
www.strategicbusinessinsights.com/vals is always a fun experience for students. With a
multimedia teaching room, instructors can visit and demonstrate VALS in class.
8. It is sometimes possible to demonstrate the halo effect to students by having them inspect the
questionnaires from a survey that used a semantic differential or similar scale. Sometimes a
respondent will place check marks all on one side, the other, or down the middle of the scale.
Alternatively, students can see that a respondent has used the scale correctly when the check
marks are consistent with the reverse positions of the scale items.
9. Some sources use a “target shooting” analogy to teach students about
reliability and validity. Picture a bull’s eye target with several bullet
holes clustered very close together, but off the center of the target. This is
reliability: the rifle was pointed at the center, but bullets were
consistently off-center and in one spot. When the rifle sights are aligned
so that the bullet hits dead center when the rifle is aimed there, it is valid.
If the holes are consistently in the center area, the sight is valid and
reliable.
10. If students need help or are confused about measurement of constructs and properties,
consider using a matrix approach with the constructs listed in the first column. Have students
volunteer what they think characterizes each consumer type. The cell descriptions that
eventuate are the properties that distinguish the various types of consumers. (Feel free to use
you own consumer types.)
Construct Consumer Type
BMW Owner Saturn Owner Used Car Buyer
Age
Education level
Income level
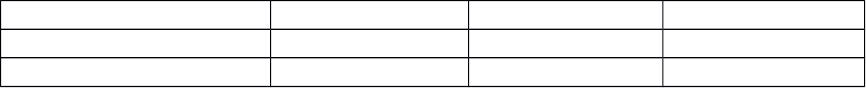
Family life cycle stage
Favorite leisure activity
Price sensitivity
11. If an instructor has foreign students who are willing to participate, it might be enlightening
for other students to hear about difficulties the foreign students have encountered in trying to
understand English idioms or word combinations. Another tact is to have a foreign graduate
student show the difficulties he or she encounters when attempting to translate questions into
his or her language. With the latter suggestion, it is a good idea to “prep” or otherwise clue
the student in on the learning objective of this exercise in order to maximize its chances of
succeeding.