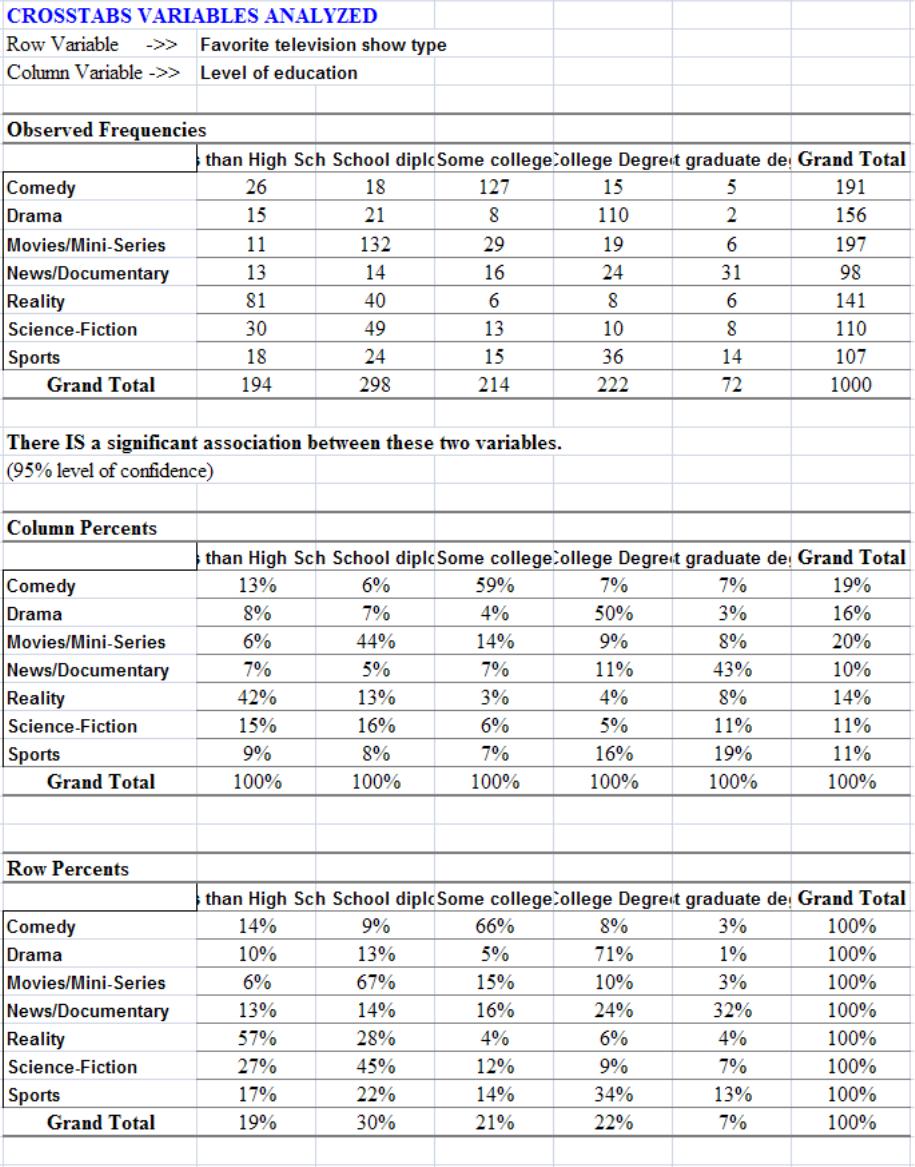
Television—Education
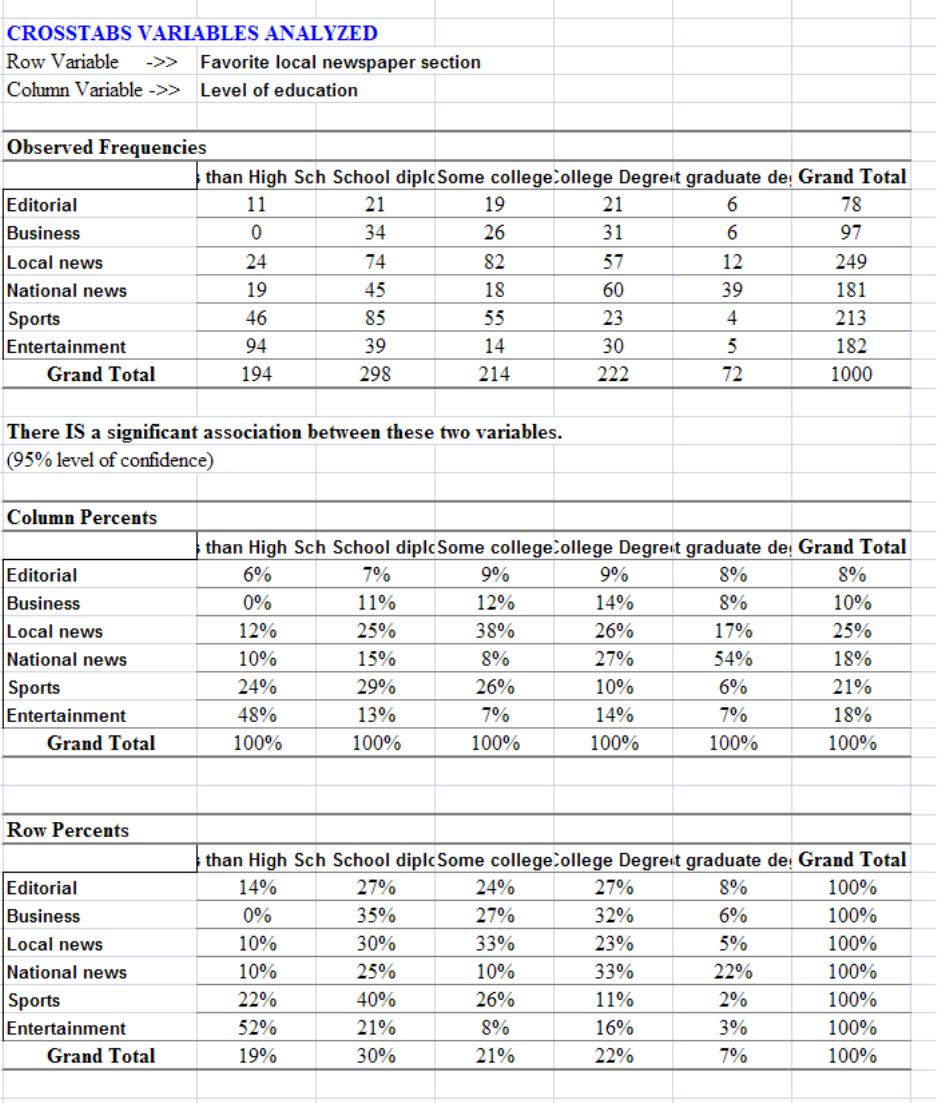
Newspaper— Education
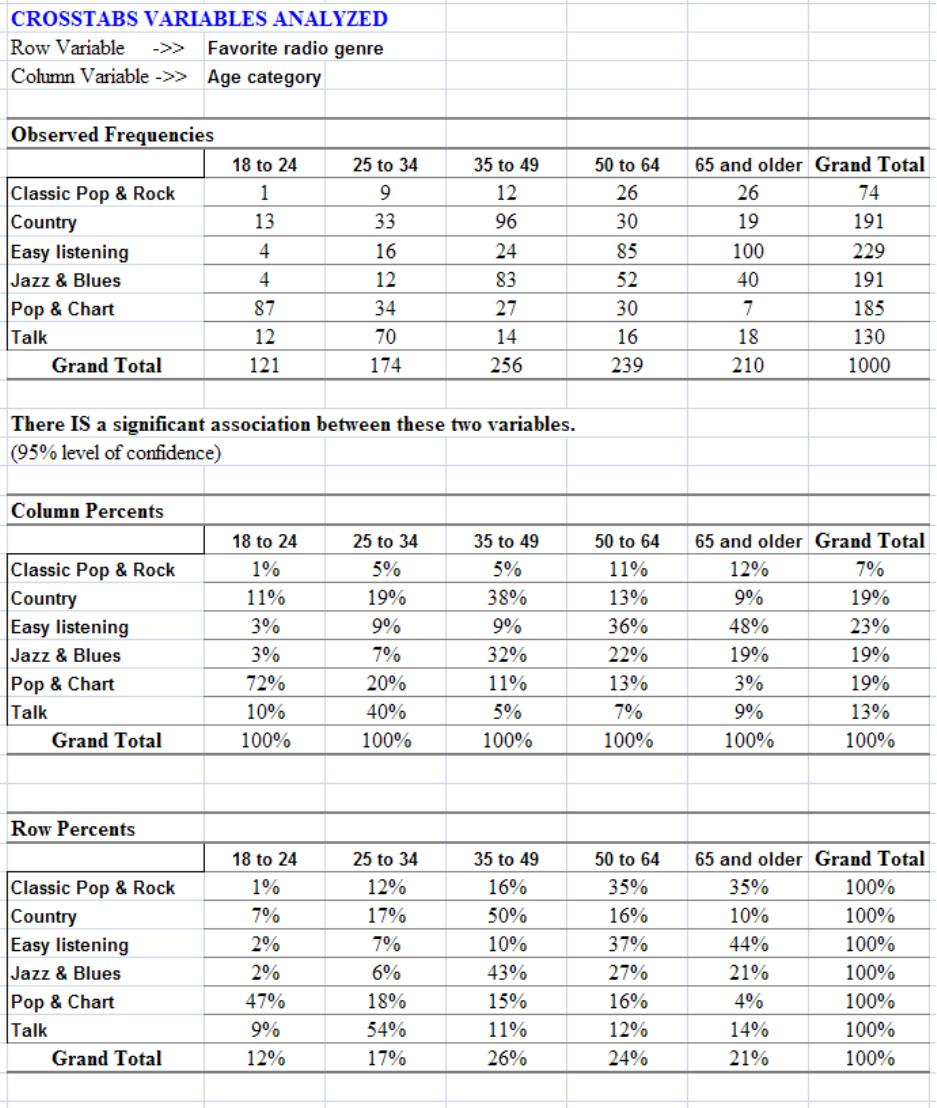
Radio—Age
Magazines—Income
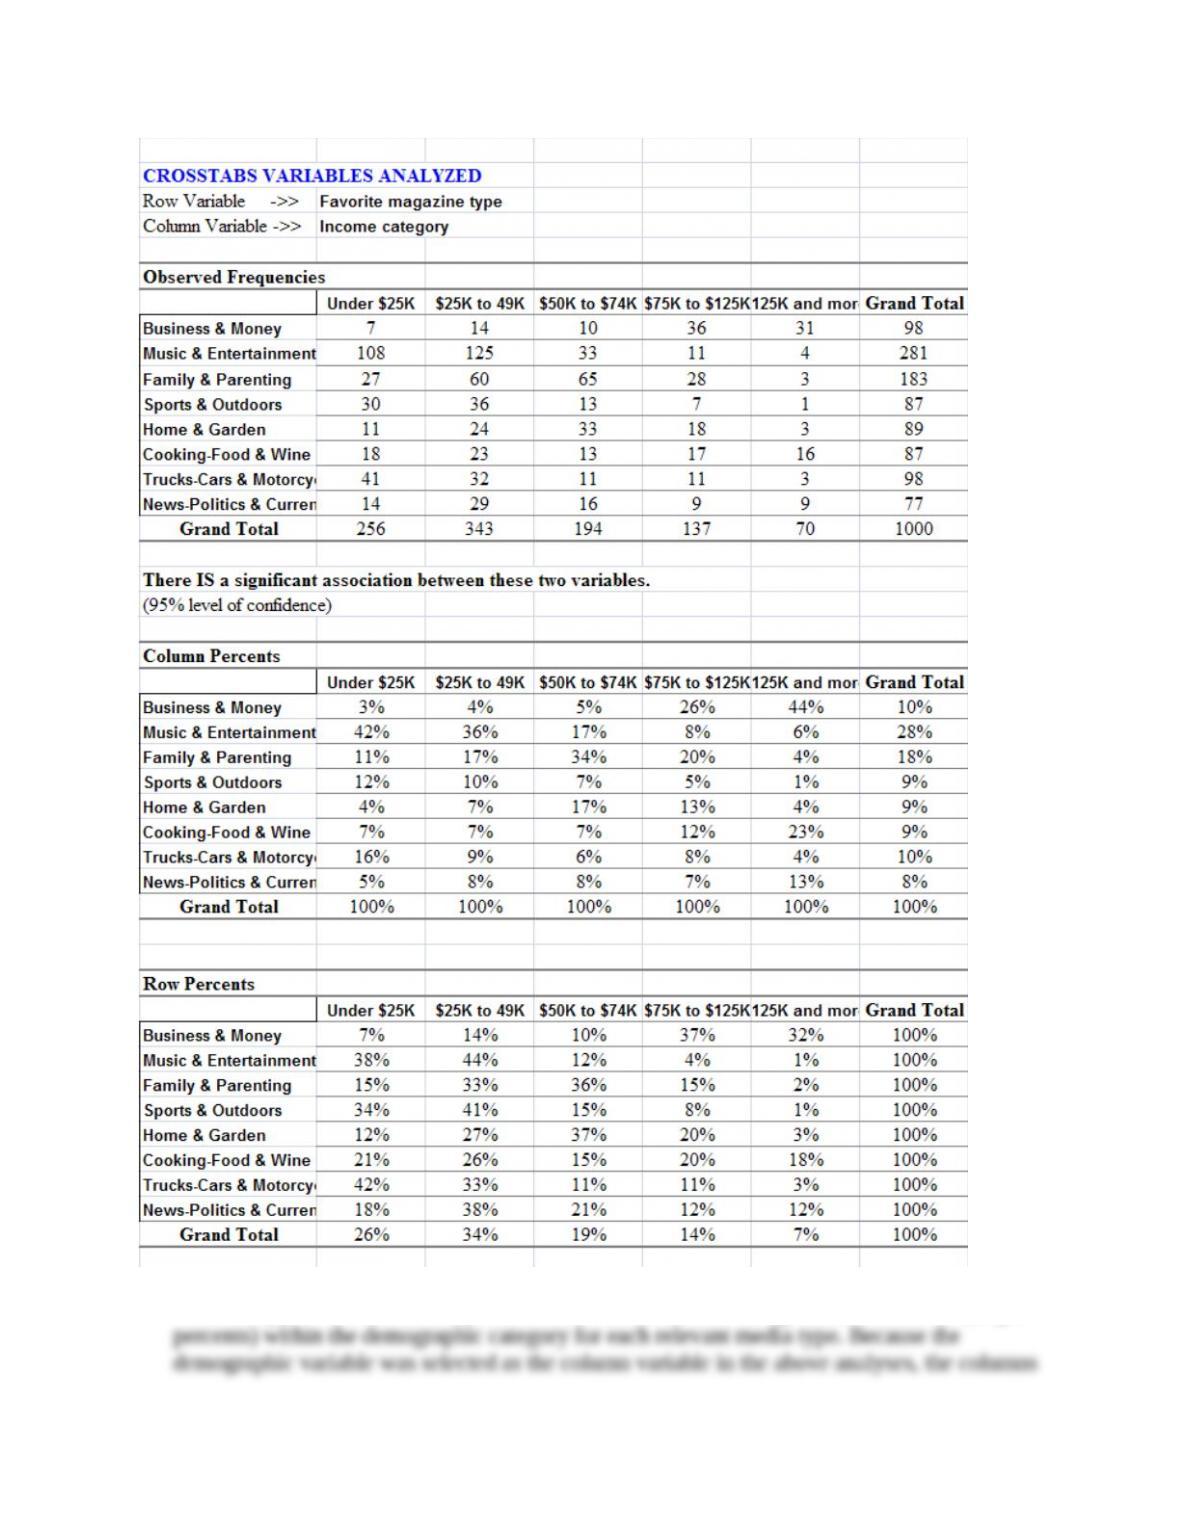
The best approach is to use the percents table that indicates the highest concentration (largest
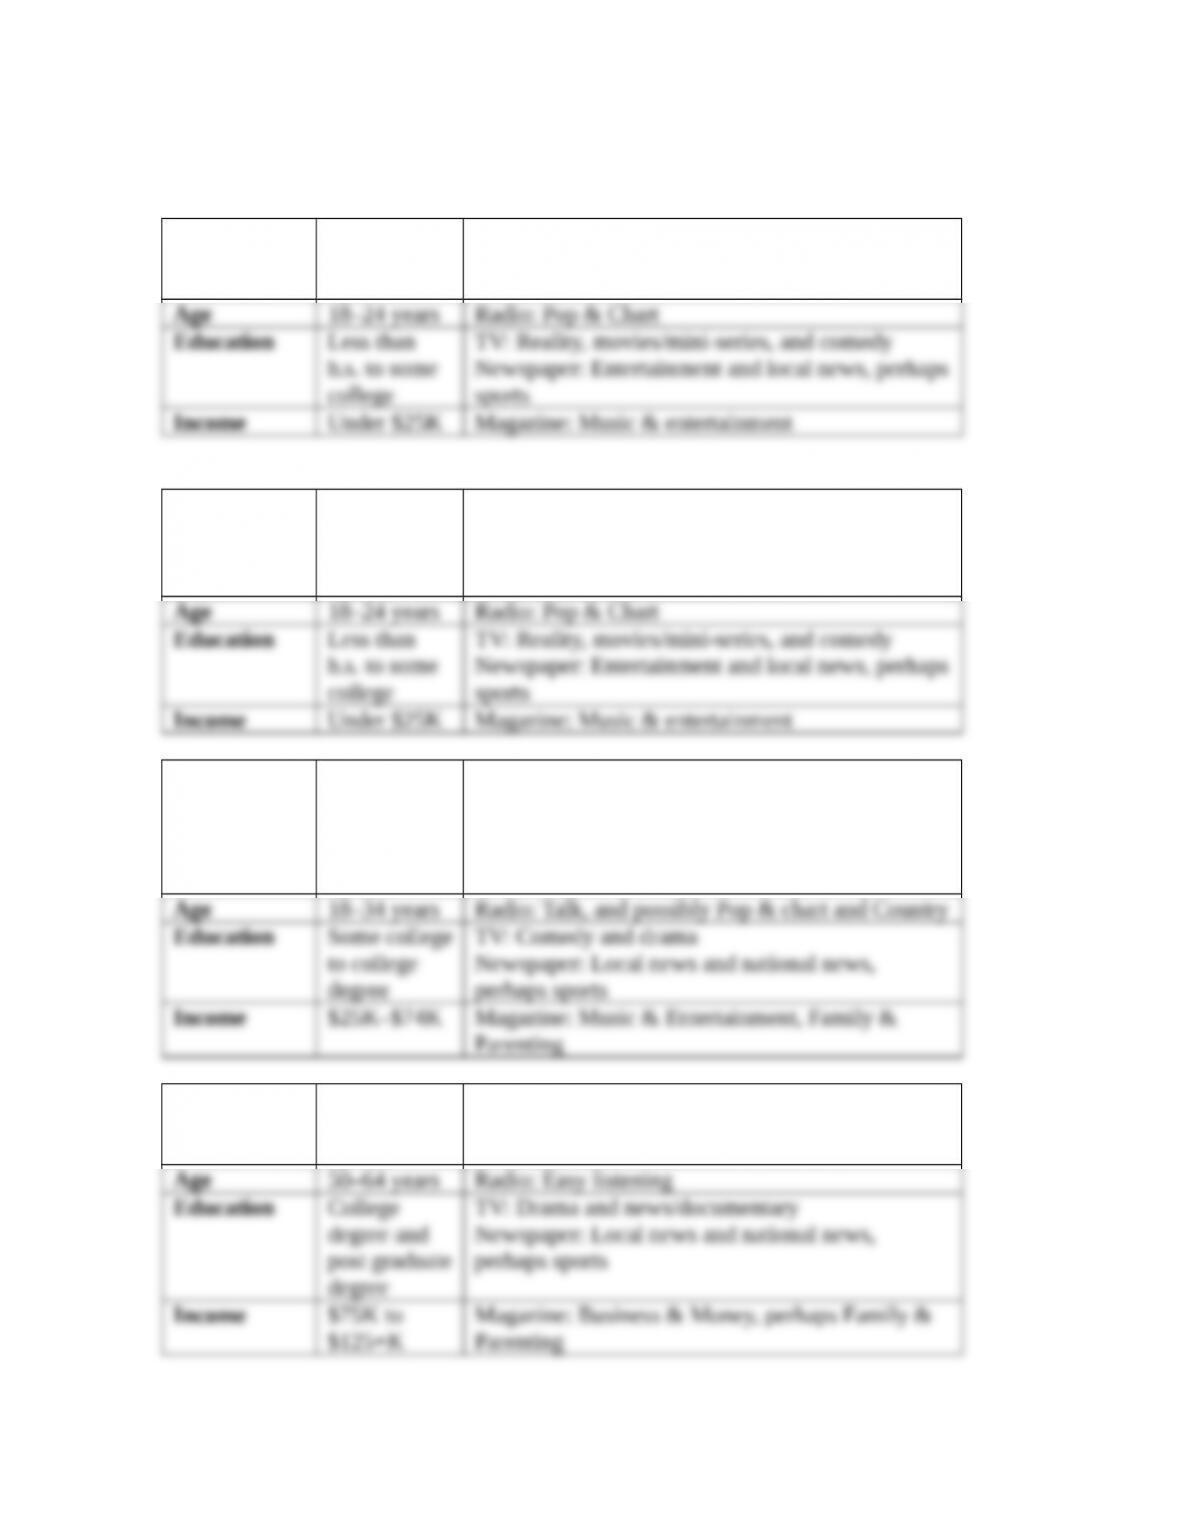
percentage tables are most informative. Here are the recommended media vehicles for each
model target market.
Demographi
c variable
Super Cycle
one-seat
hybrid Recommended Promotional Vehicles
Demographi
c variable
Runabout
Sport
two-seat
hybrid Recommended Promotional Vehicles
Demographi
c variable
Runabout
with
Luggage
two-seat
hybrid Recommended Promotional Vehicles
Demographi
c variable
Economy
four-seat
hybrid Recommended Promotional Vehicles
Demographi
c variable
Standard
four-seat
hybrid Recommended Promotional Vehicles
$125+K
1. What is the lifestyle of each of the possible target markets, and what are the implications of
this finding for the advertising message that would “speak” to this market segment when the
hybrid model is introduced?
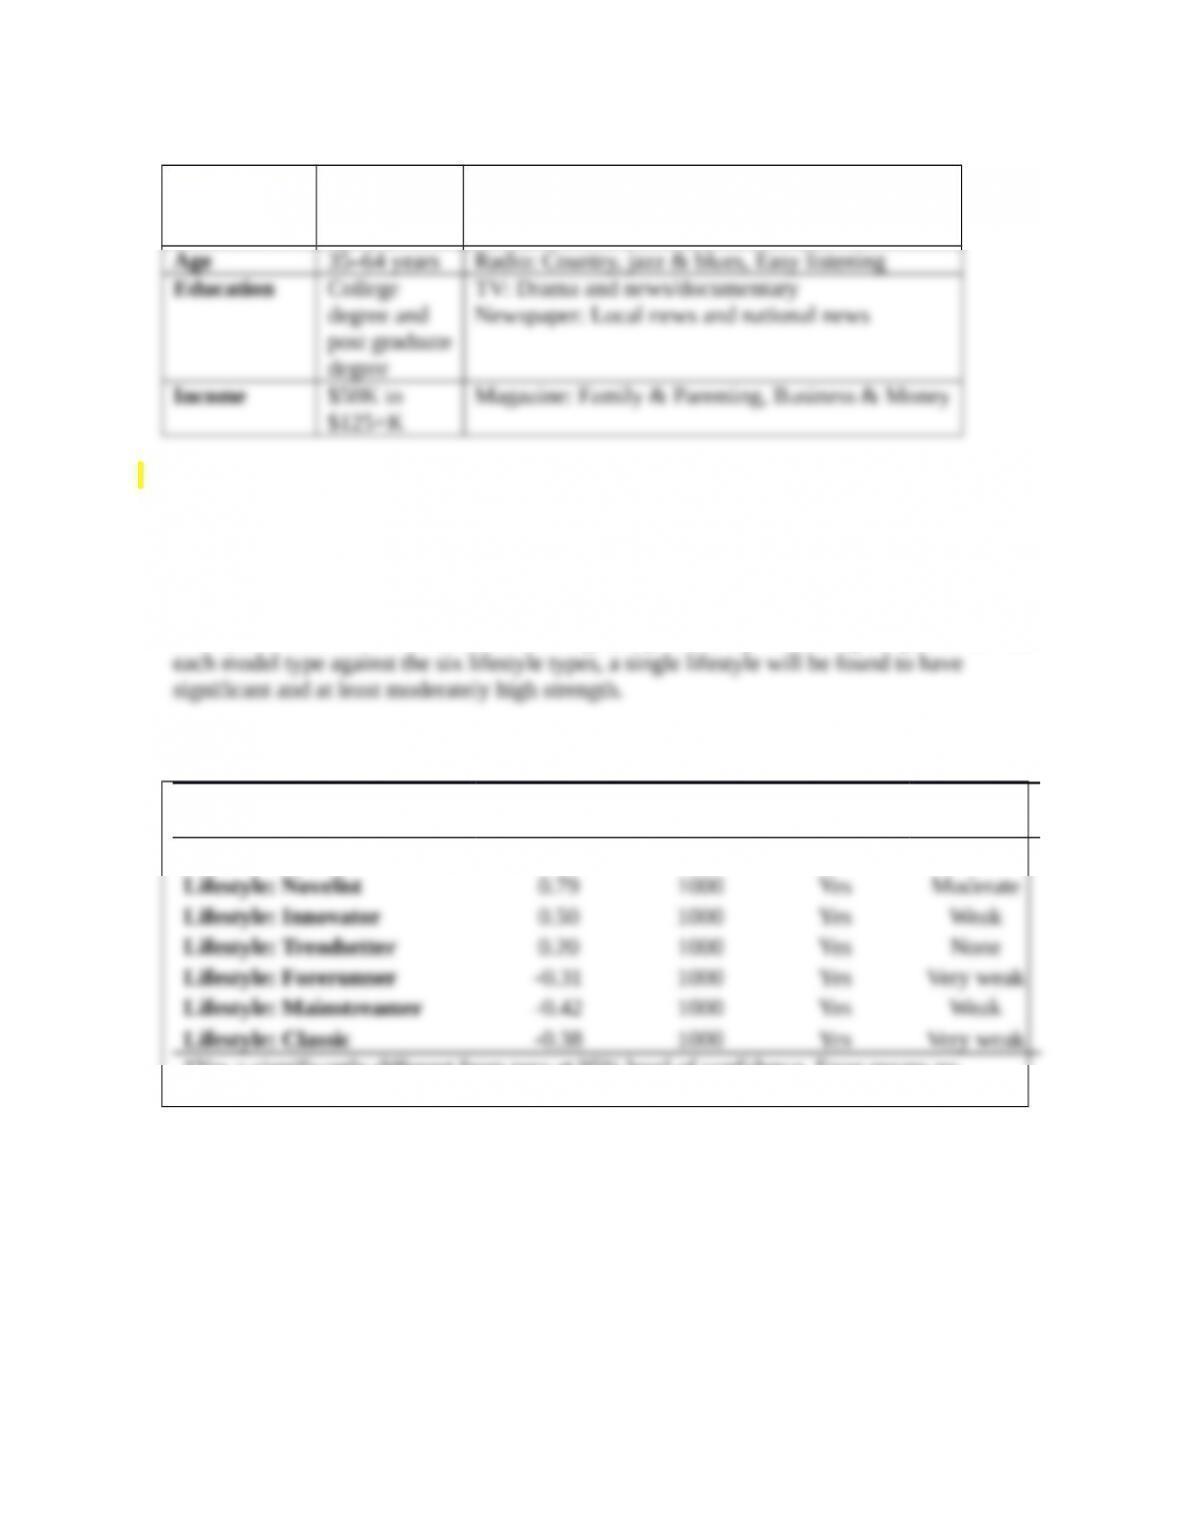
Lifestyle is often used to flesh out market segment profiles. By correlating the preference for
The lifestyle for the Super Cycle is the “novelist.”
Preference: Super Cycle
one-seat hybrid Correlation
Sample
Size Significant?* Strength
With…
*Yes = significantly different from zero at 95% level of confidence. Error means no
variance or some other data error.
The lifestyle for the Runabout Sport is the “innovator.”
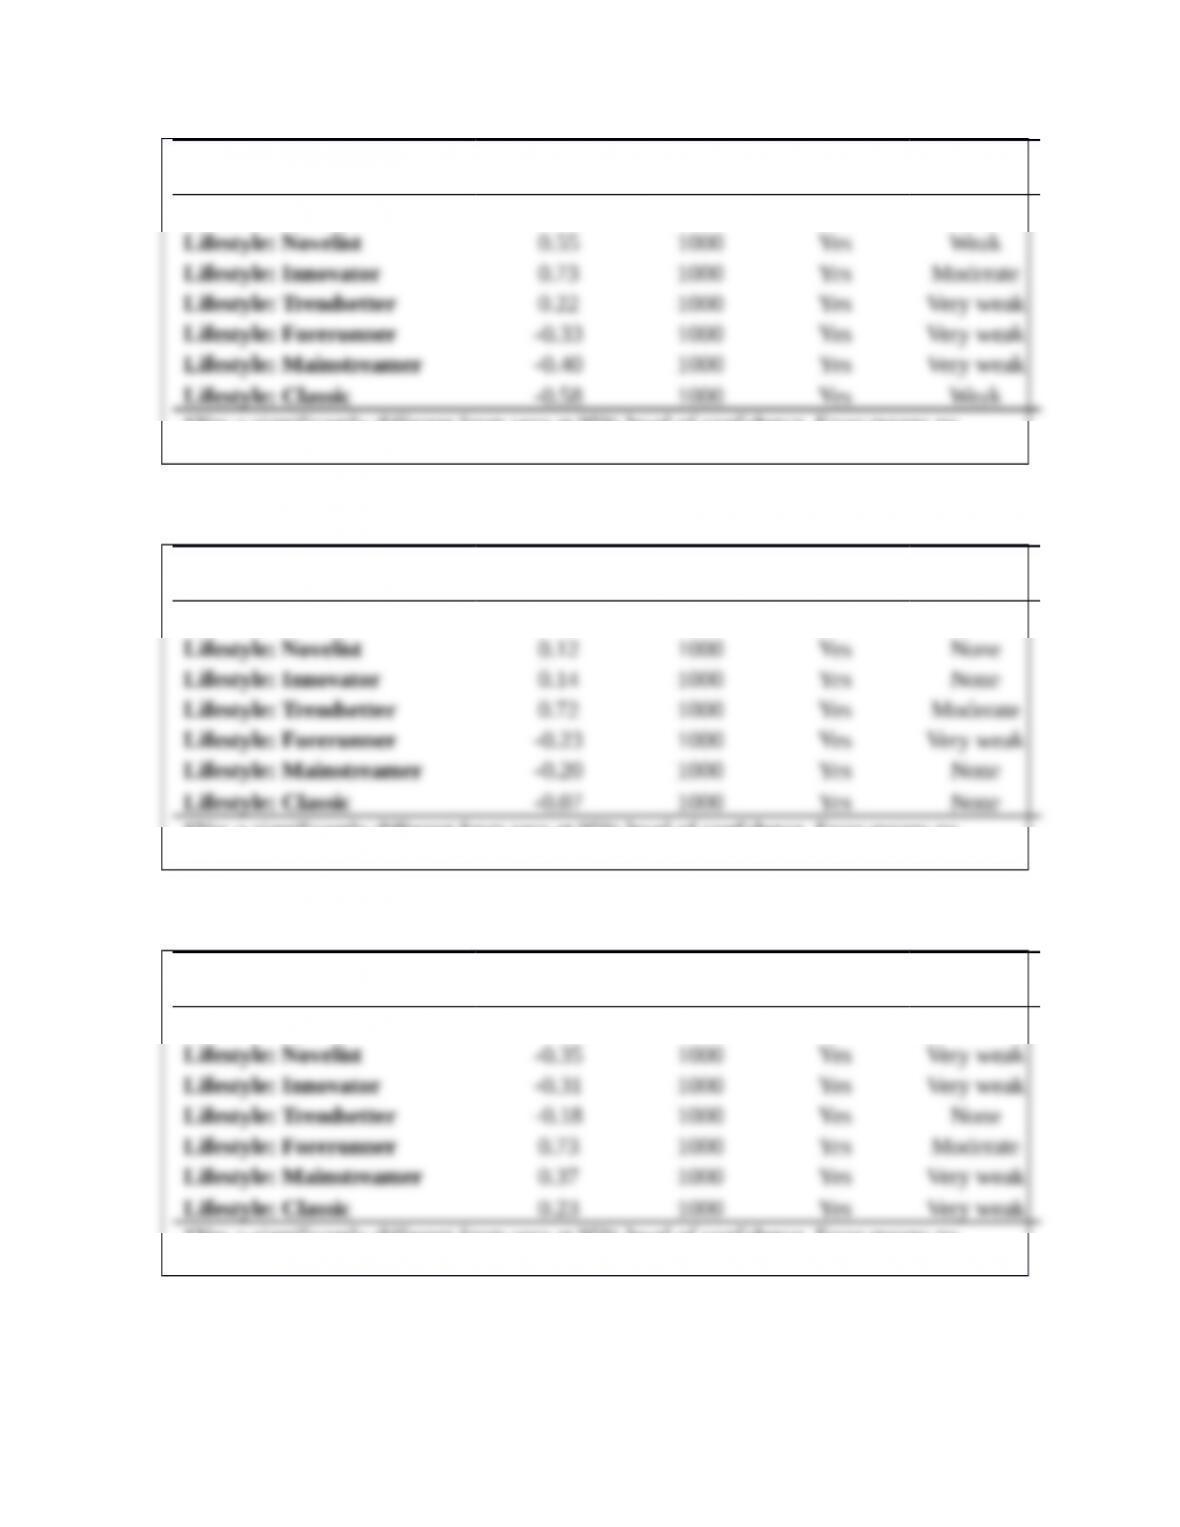
Preference: Runabout
Sport two-seat hybrid Correlation
Sample
Size Significant?* Strength
With…
*Yes = significantly different from zero at 95% level of confidence. Error means no
variance or some other data error.
The lifestyle for the Runabout with luggage is the “trendsetter.”
Preference: Runabout with
Luggage two-seat hybrid Correlation
Sample
Size Significant?* Strength
With…
*Yes = significantly different from zero at 95% level of confidence. Error means no
variance or some other data error.
The lifestyle for the Economy, four-seat hybrid is the “forerunner.”
Preference: Economy
four-seat hybrid Correlation
Sample
Size Significant?* Strength
With…
*Yes = significantly different from zero at 95% level of confidence. Error means no
variance or some other data error.
The life style for the Standard, 4-seat hybrid is the “mainstreamer.”
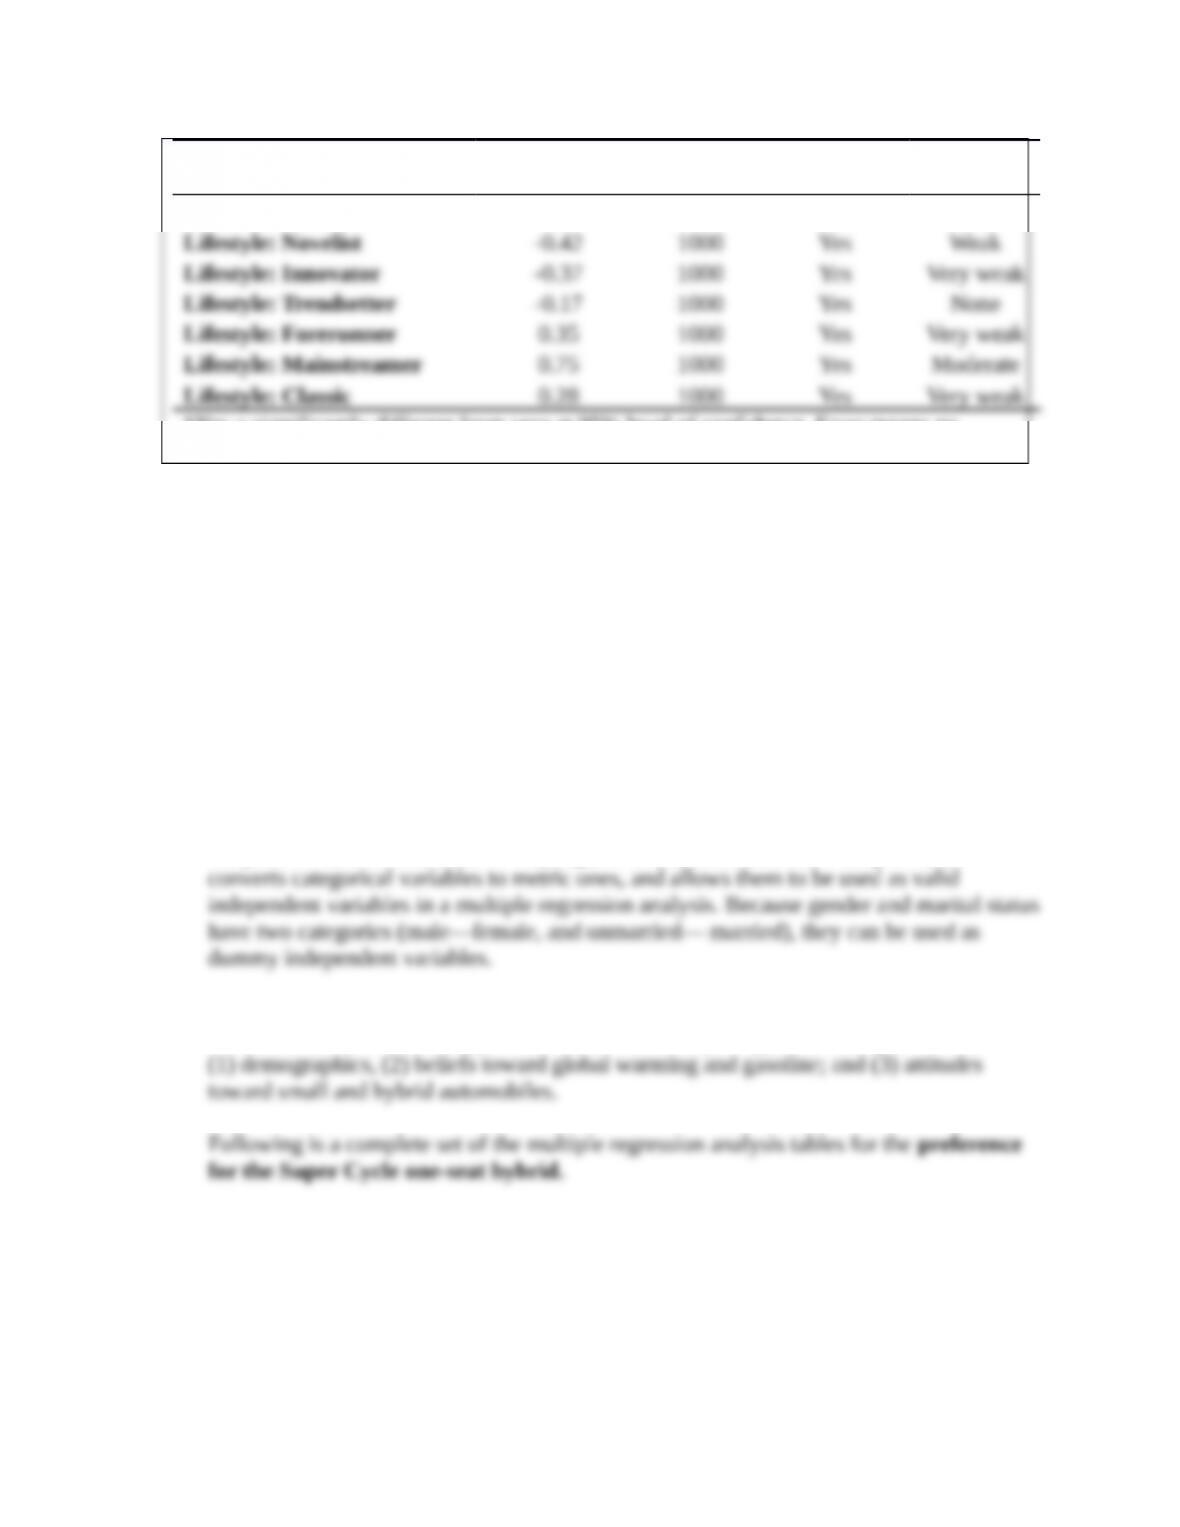
Preference: Standard
four-seat hybrid Correlation
Sample
Size Significant?* Strength
With…
*Yes = significantly different from zero at 95% level of confidence. Error means no
variance or some other data error.
3. Perform the proper analyses to identify the salient demographic, belief, and/or attitude
factors that are related to preferences for each of the five different hybrid models under
consideration. With each hybrid automobile model, prepare a summary that:
a. Lists the statistically significant independent variables (use 95% level of confidence).
b. Interprets the direction of the relationship of each statistically significant independent
variable with respect to the preference for the hybrid model concerned.
c. Assesses the strength of the statistically significant independent variables as they join
to predict the preferences for the hybrid model concerned.
The textbook notes that there are some variables that are recoded, and the new dataset is
“AAConcepts.Recoded.xlsm. Specifically, the following variables are recoded with
midpoints—size of hometown or city, age, education, and income. This procedure
Because of the constraint in Excel with regards to the maximum number of independent
variables, a recommended approach is to do the multiple regression analyses in blocks: