ANSWERS TO REVIEW QUESTIONS
1. What is a relationship between two variables, and how does a relationship help a marketing
manager? Give an example using a demographic variable and a consumer behavior
variable, such as satisfaction with a brand.
A relationship is a consistent and systematic linkage between the levels or labels for two
An example would be income. If Lexus found that high income consumers were satisfied
2. What is the basis for a cross-tabulation table? What types of variables are best analyzed with
a cross-tabulation table and why?
With cross-tabulation, the two categorical variables are arranged in a cross-tabulation table,
3. Illustrate how a cross-tabulation cell occurs in a cross-tabulation table. Provide an example
using the variables of gender (categories: male and female) and vehicle type driven (SUV,
sedan, sports car).
The intersection of a row and a column in a cross-tabulation table is called a
cross-tabulation cell. In the example, the cells are males who drive SUVs, males who drive
The cells are empty, but students can fill in frequencies, row, or column percents in their
examples.
Gender
Vehicle type Male Female
SUV
Sedan
Sports car
4. Describe chi-square analysis by explaining the following:
a. Observed frequencies
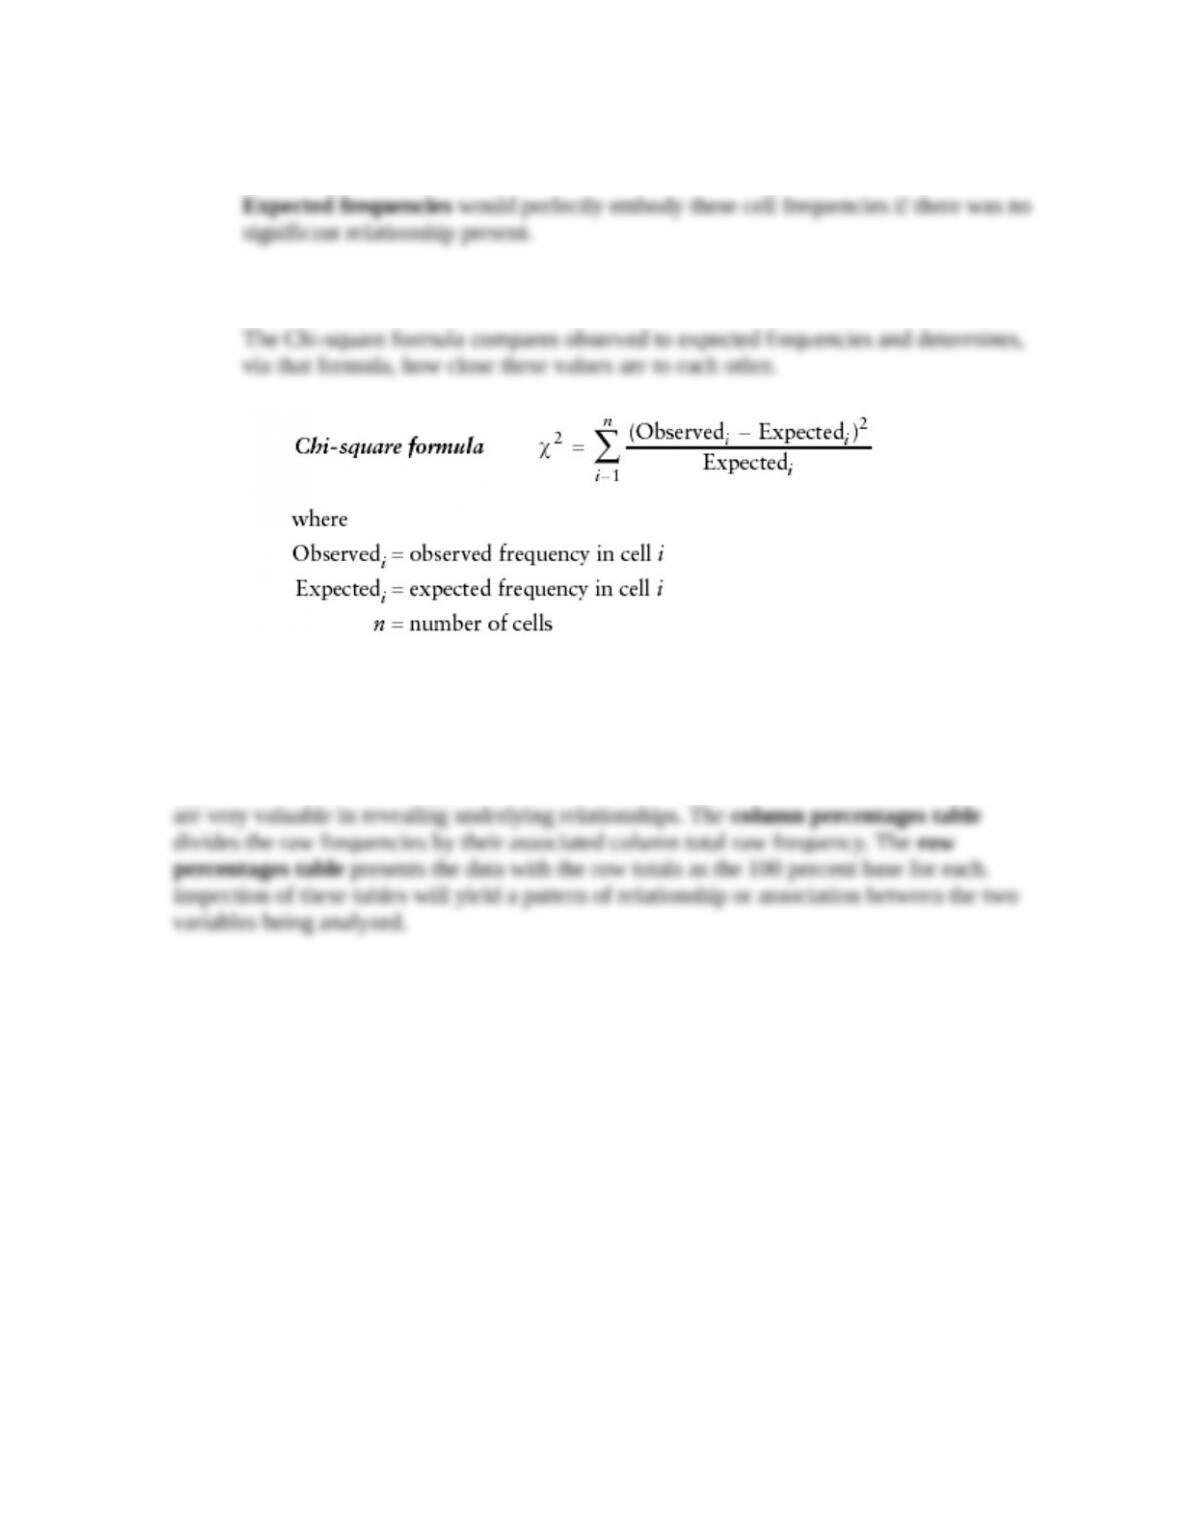
b. Expected frequencies
c. Chi-square formula
5. When a researcher finds a statistically significant chi-square result for a cross-tabulation
analysis, what should the researcher do next?
When you determine that a significant relationship does exist (no support for the null
hypothesis of no relationship), two additional cross-tabulation tables can be calculated that
6. Use a scatter diagram and illustrate the covariation for the following correlations:
a. –.99
The pattern would define a downward sloping ellipse that is very compact.

c. +.21
c. +.76
7. Explain why the statistical significance of a correlation is important. That is, what must be
assumed when the correlation is found to not be statistically significant?
The null hypothesis for a correlation states that the population correlation coefficient is
8. Describe the connection between a correlation and a bivariate regression analysis. In your
discussion, specifically note: (1) statistical significance, (2) sign, and (3) use or application.
A bivariate regression means there are only two variables involved. The correlation
coefficient is based on a straight line relationship, meaning a linear regression of two
variables. A statistically significant correlation indicates that there is a linear (bivariate
9. Relate how a bivariate regression analysis can be used to predict the dependent variable. In
your answer, identify the independent and dependent variables, intercept, and slope. Also,
give an example of how the prediction should be accomplished.
The dependent variable, y, is predicted by the equation y = a + bx where a is the intercept and
10. When a regression analysis is performed, what assures the researcher that the resulting
regression equation is the best or optimal regression equation? Explain this concept.
When any statistical analysis program computes the intercept and the slope in a regression
analysis, it does so on the basis of the “least squares criterion.” The least squares criterion
is a way of guaranteeing that the straight line that runs through the points on the scatter
11. How does multiple regression differ from bivariate regression? How is it similar?
Multiple regression analysis is an expansion of bivariate regression analysis such that more
than one independent variable is used in the regression equation. The addition of independent
12. Define and note how each of the following is used in multiple regression:
a. Dummy independent variable
A dummy independent variable is defined as one that is scaled with a nominal 0 vs.
1 coding scheme. The 0 vs. 1 code is traditional, but any two adjacent numbers could
b. Standardized beta coefficients
With the standardized beta coefficient direct comparisons may be made between the
resulting betas. The larger the absolute value of a standardized beta coefficient, the
c. Multiple R
13. How should you regard your knowledge and command of multiple regression analysis that is
based on its description in this chapter? Why?
The coverage in this chapter introduces you to regression analysis, and it provides you with
ANSWERS TO APPLICATION QUESTIONS
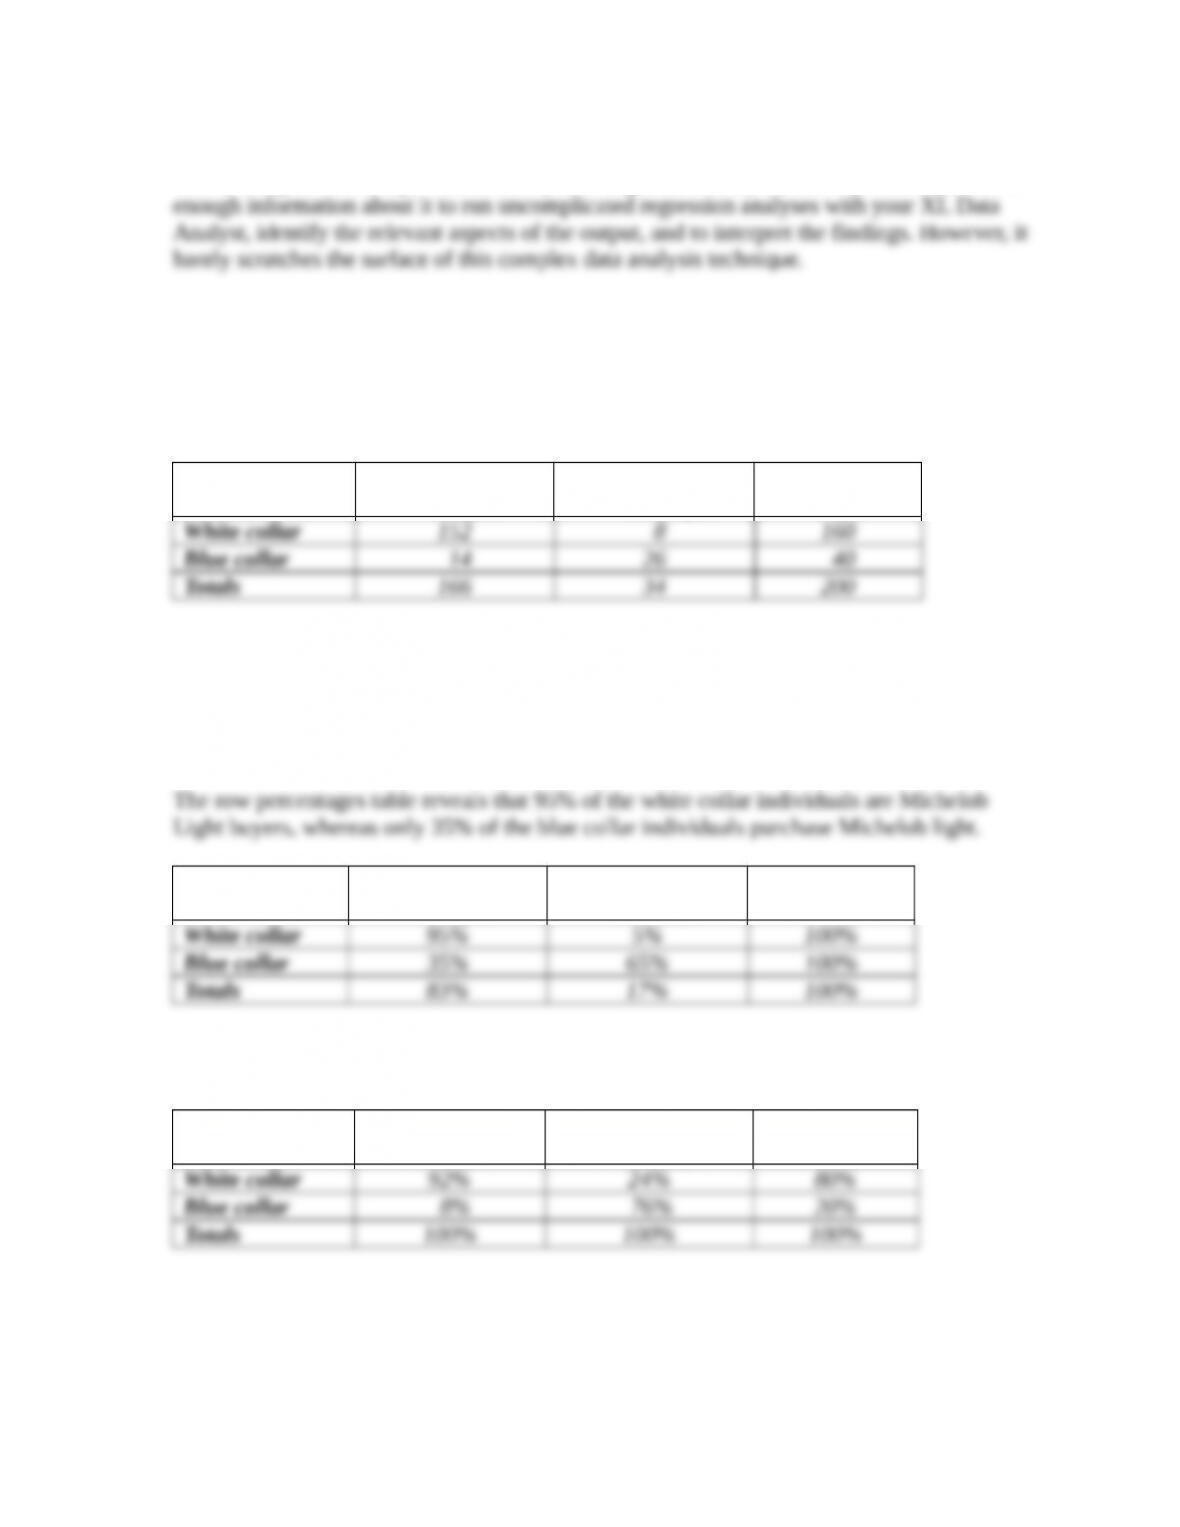
14. A researcher has conducted a survey for Michelob Light beer. There are two questions in the
survey being investigated in the following cross-tabulation table.
Michelob Light
Buyer
Michelob Light
Nonbuyer
Totals
The computed chi-square value of 81.6 is greater than the chi-square table critical value of
3.8. Interpret the researcher’s findings.
There is a significant Chi-square value (greater than the table value), so the researcher is
justified in further manipulation of the cross-tabulation to find the pattern of relationship.
Michelob Light
Buyer
Michelob Light
Nonbuyer
Totals
Similarly, the column percentages table shows that 92% of the Michelob buyers are white
collar individuals while 76% of the nonbuyers of Michelob Light are blue collar workers.
Michelob Light
Buyer
Michelob Light
Nonbuyer
Totals
15. Following is some information about ten respondents to a mail survey concerning candy
purchasing. Construct the various different types of cross-tabulation tables that are possible.
Label each table, and indicate what you find to be the general relationship apparent in the
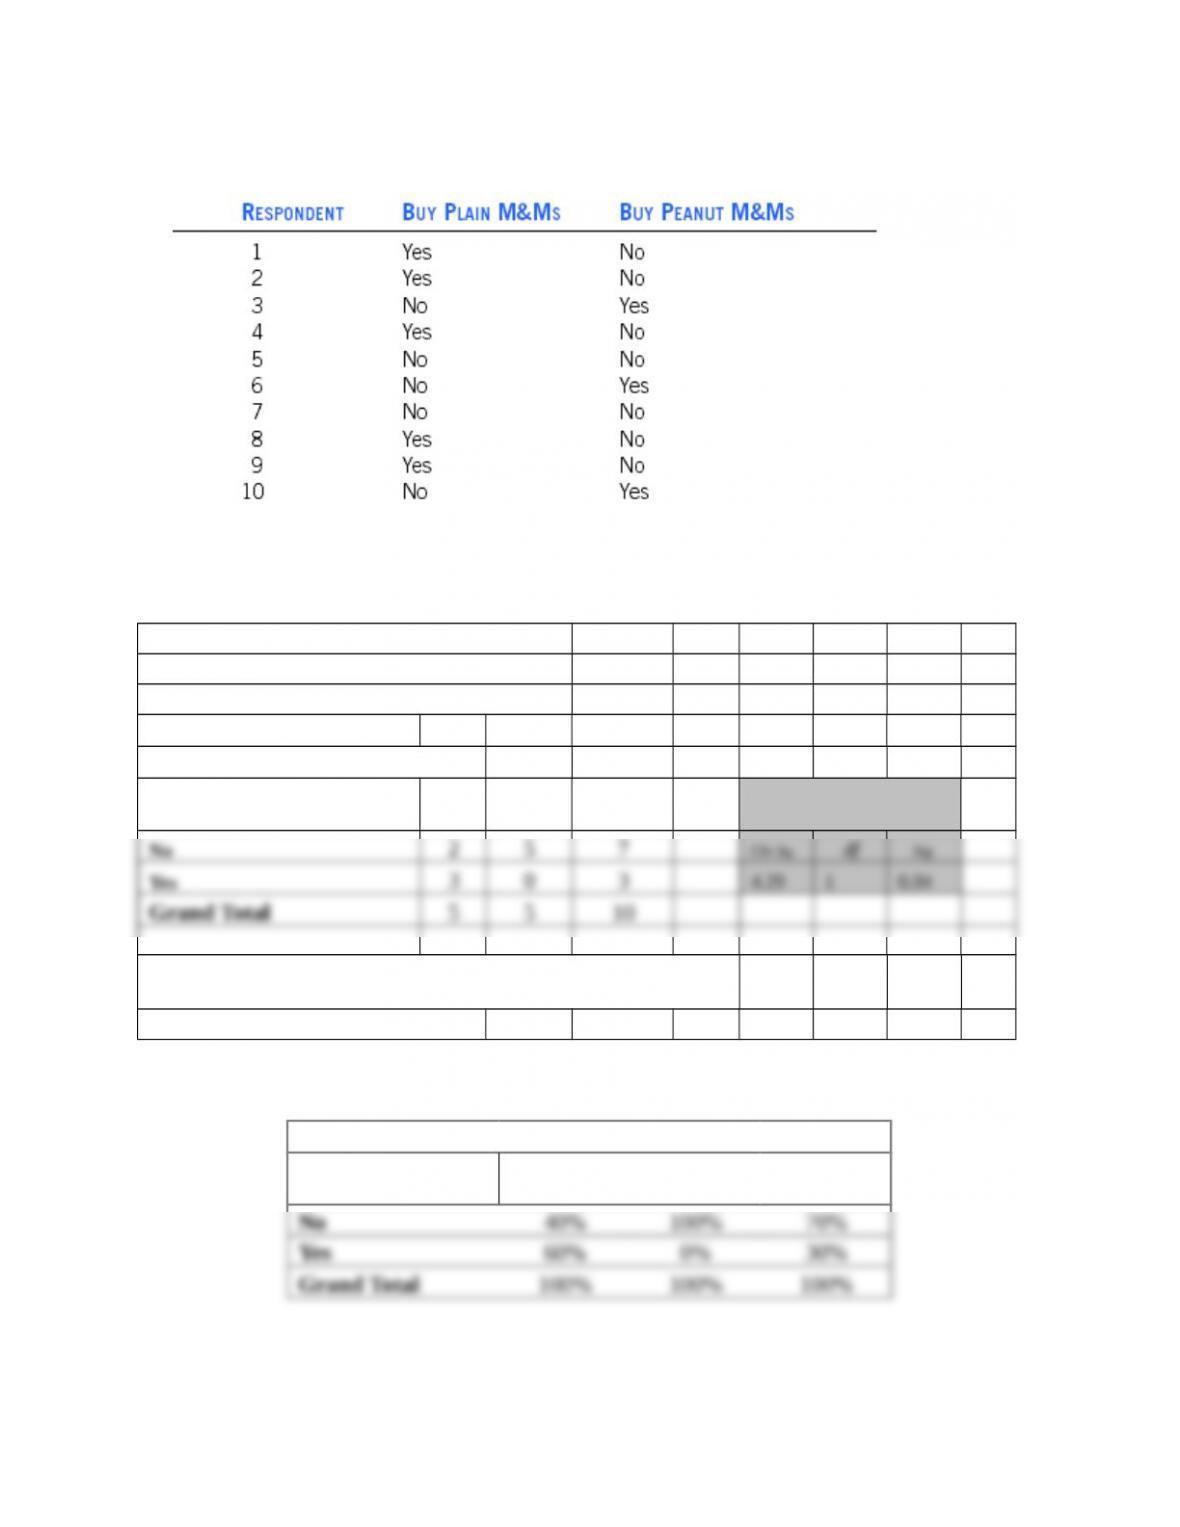
data.
This small data set can be easily made into an XL Data Analyst Excel file. Here is the result
of cross-tabulation analysis.
CROSSTABS VARIABLES ANALYZED
Row Variable: Plain M&M’s
Column Variable: Peanut M&M’s
Observed Frequencies
Plain M&M’s No Yes
Grand
Total Statistical Values
There IS a significant association between these two
variables.
(95% level of confidence)
The column percents table shows that folks who eat peanut M&M’s do not eat plain ones.
Column Percents Peanut M&M’s
Plain M&M’s No Yes
Grand
Total
The row percents table shows that people who eat plain M&M’s do not eat peanut ones.
Row Percents Peanut M&M’s
Plain M&M’s No Yes
Grand
Total
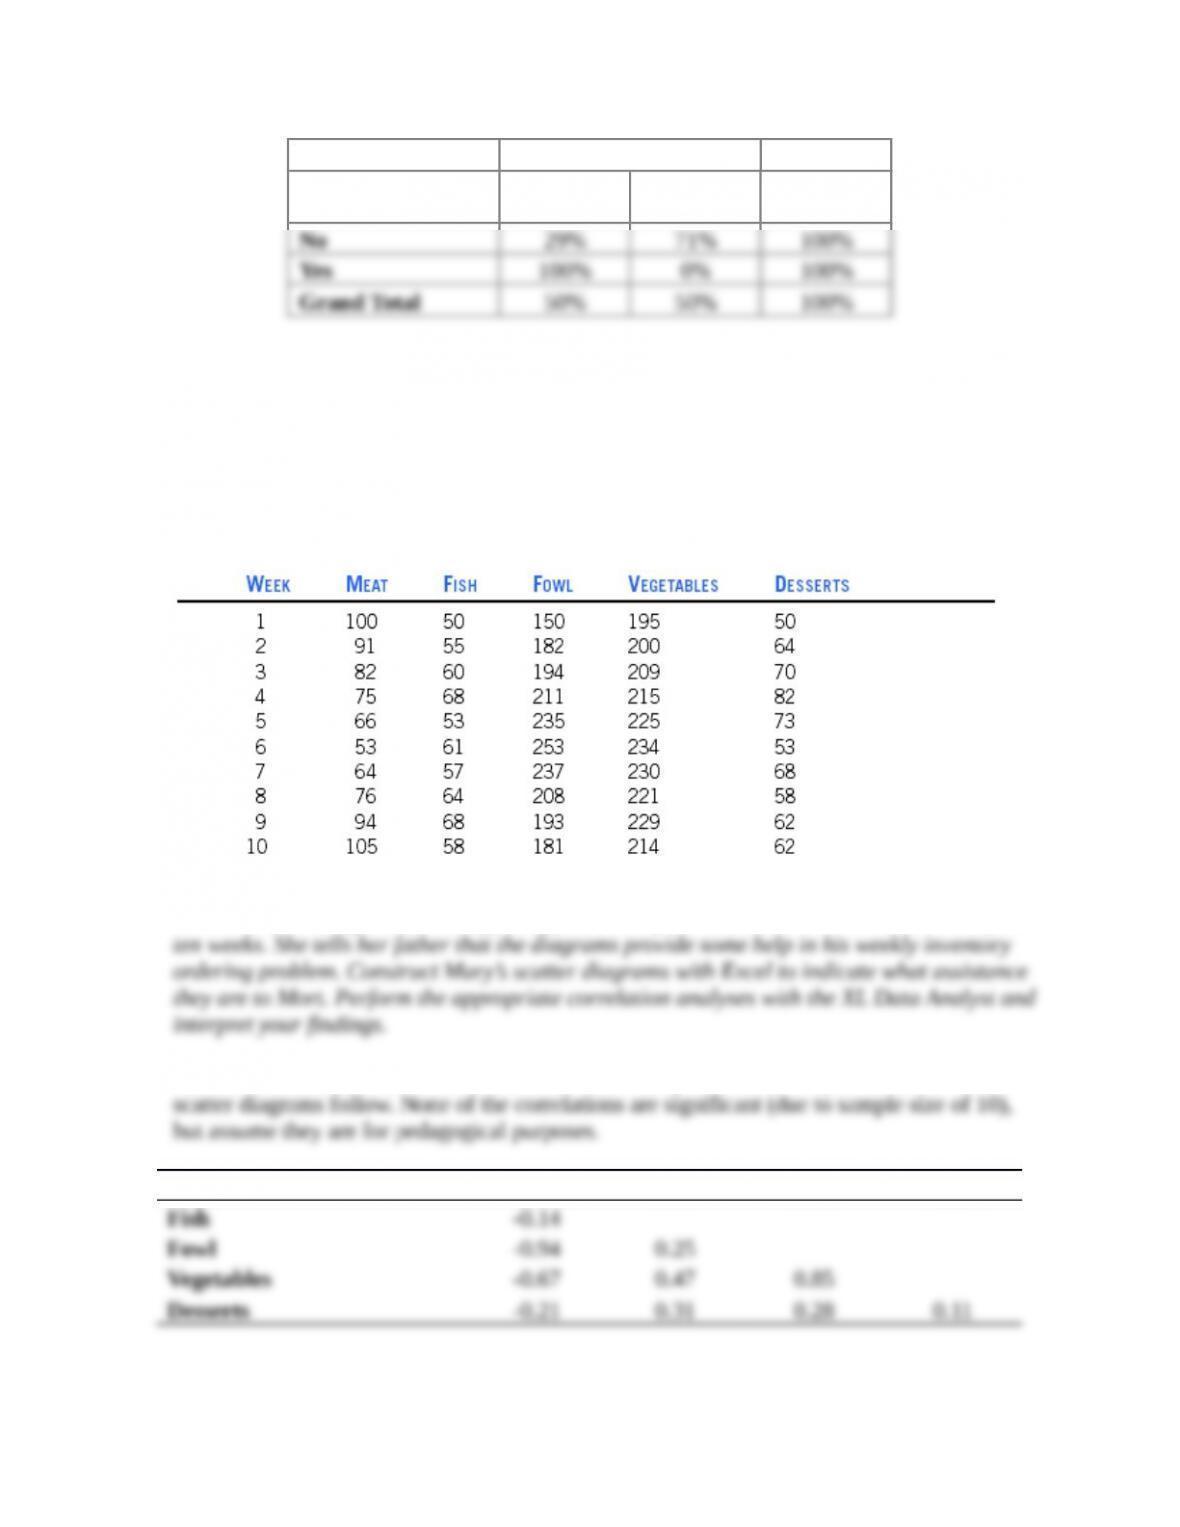
16. Morton O’Dell is the owner of Mort’s Diner, which is located in downtown Atlanta, Georgia.
Mort’s opened up about twelve months ago, and it has experienced success, but Mort is
always worried about what food items to order as inventory on a weekly basis. Mort’s
daughter, Mary, is an engineering student at Georgia Tech, and she offers to help her father.
She asks him to provide sales data for the past ten weeks in terms of pounds of food bought.
With some difficulty, Mort comes up with the following list.
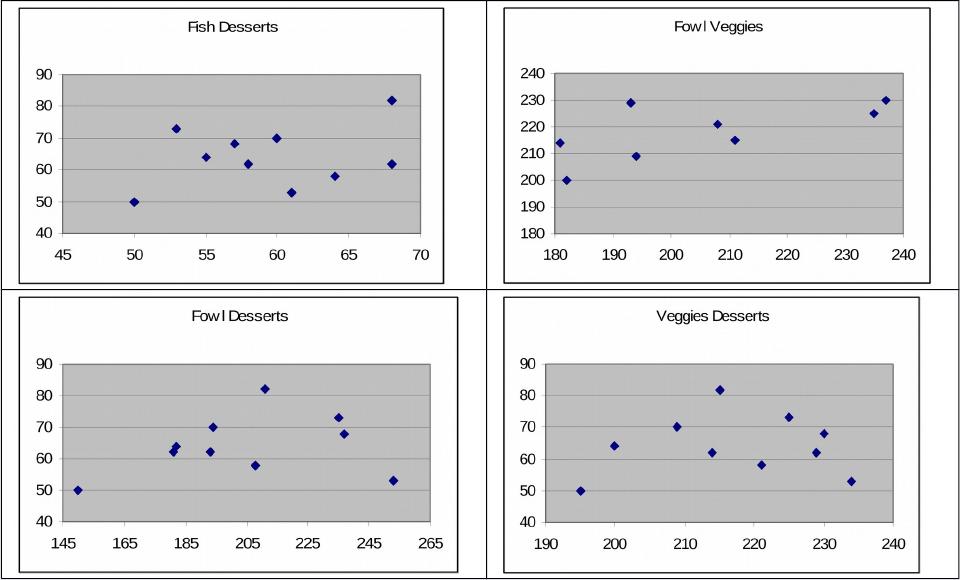
Mary uses these sales figures to construct scatter diagrams that illustrate the basic
relationships among the various types of food items purchased at Mort’s Diner over the past
Here is a correlation matrix built on the XL Data Analyst correlation operation, and the
Meat Fish Fowl Veggies
Implications are as follows.
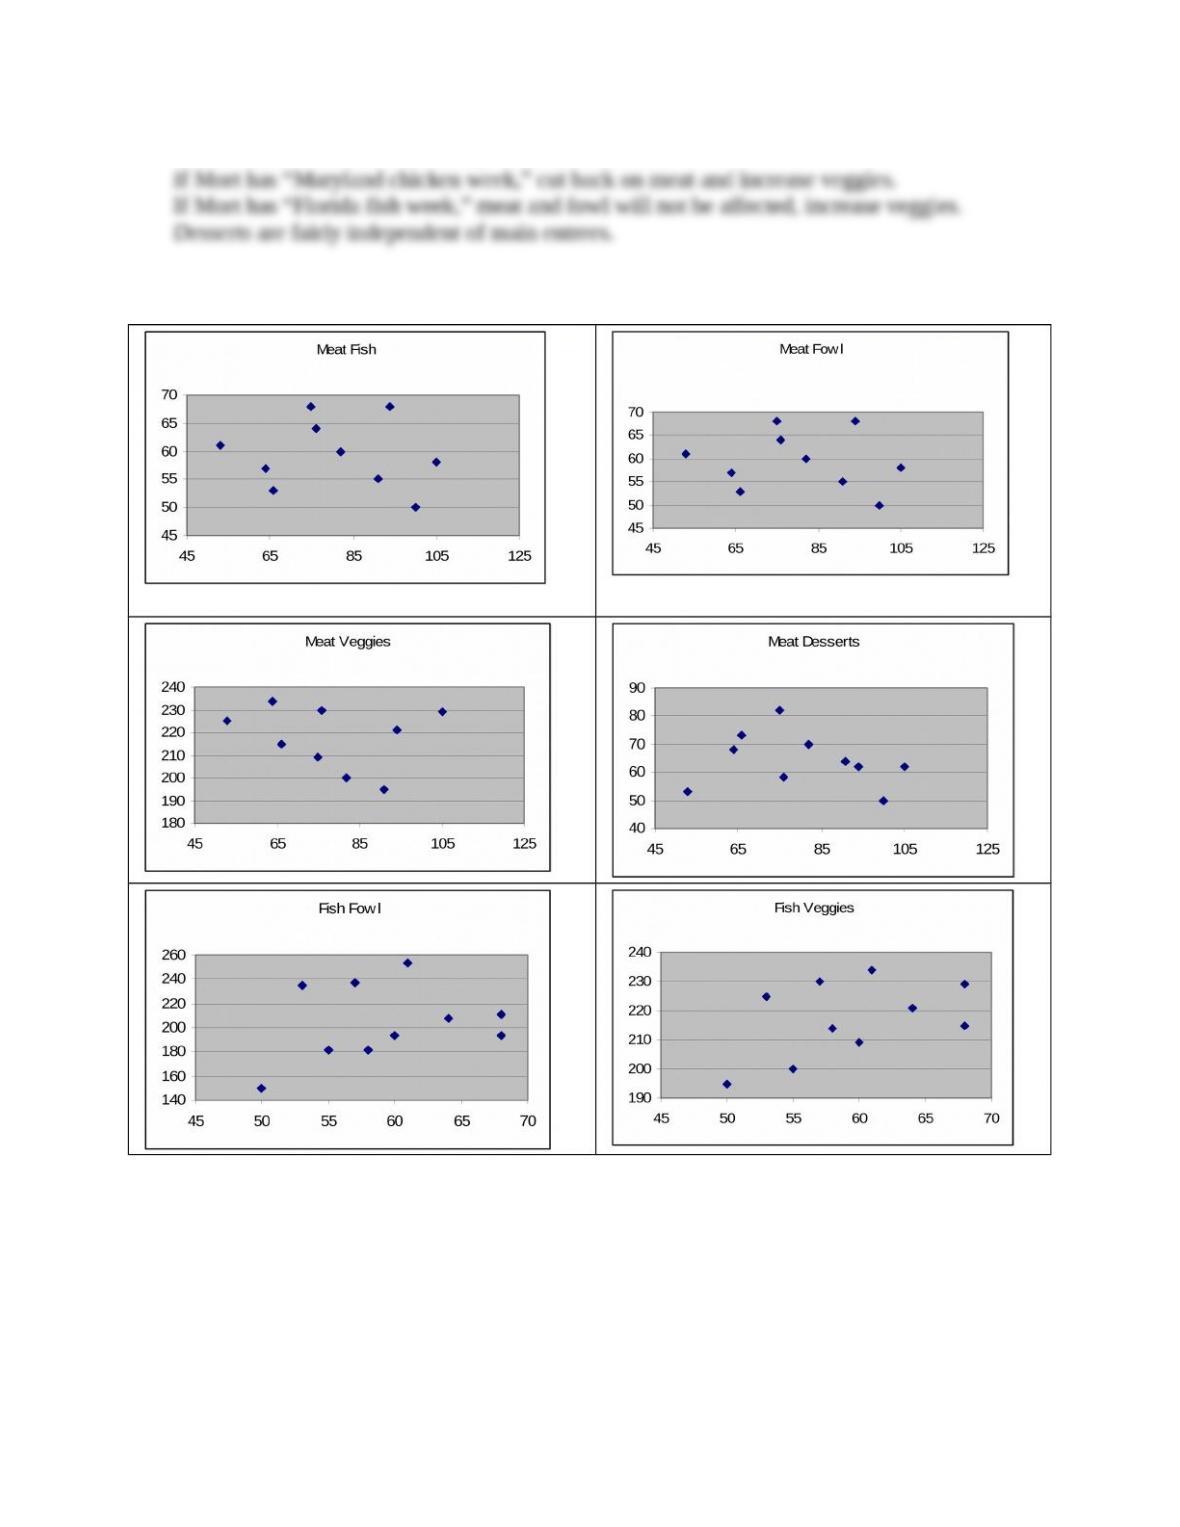
If Mort has “Nebraska beef week,” cut back on fowl.