ANSWERS TO REVIEW QUESTIONS
1. What are differences and why should marketing researchers be concerned with them?
Differences are instances where two (or more) groups are not the same. Market
segmentation holds that within a product market there are different types of consumers who
2. What are the three ways a researcher can investigate for differences?
There are three ways a researcher can analyze for differences: (1) compare one group to
3. Why does the nature of the scale (categorical or metric) being used matter when performing
a differences test?
With a categorical scale, one must use percentage differences, while with a metric scale, one
4. What is the null hypothesis and what is the alternative hypothesis for a differences test?
To test whether a true difference exists between two group percentages or averages, we test
the null hypothesis that the difference in their population parameters is equal to zero. The
5. When the percentages or the averages of two groups are compared, what is the nature of the
comparison operation?
6. When a standard error of a difference (between percentages or averages) is computed, what
two factors are taken into account, and how does each affect the size of the standard error?
In essence, the standard error of a difference is the sum of the standard errors of the two
percentages or averages being compared. The standard error of the percent of the average is
7. Describe how a directional hypothesis about the difference between two percentages or two
averages is tested.
The procedure is identical to directional hypotheses that are stipulated in hypothesis tests.
That is, you must first look at the sign of the computed z value to check that it is consistent
8. What is ANOVA, and when is it used? Why is it termed efficient?
Analysis of variance, sometimes called ANOVA, is used to accomplish such differences
tests for the averages when three or more groups are involved. ANOVA is a very efficient and
9. What is the null hypothesis in ANOVA?
The null hypothesis in ANOVA is that none of the all possible group-to-group averages is
10. How is a test of the difference between the averages of two variables different from a test of
the difference between the averages of two groups with the same variable? How is it similar?
ANSWERS TO APPLICATION QUESTIONS
11. Are the following two sample results significantly different?
a. Sample 1 mean of 10.6, s.d. of 1.5, n of 150; sample 2 mean of 11.7, s.d. of 2.5, n of
300; level of 95%
No, two means are not statistically significant in their differences.
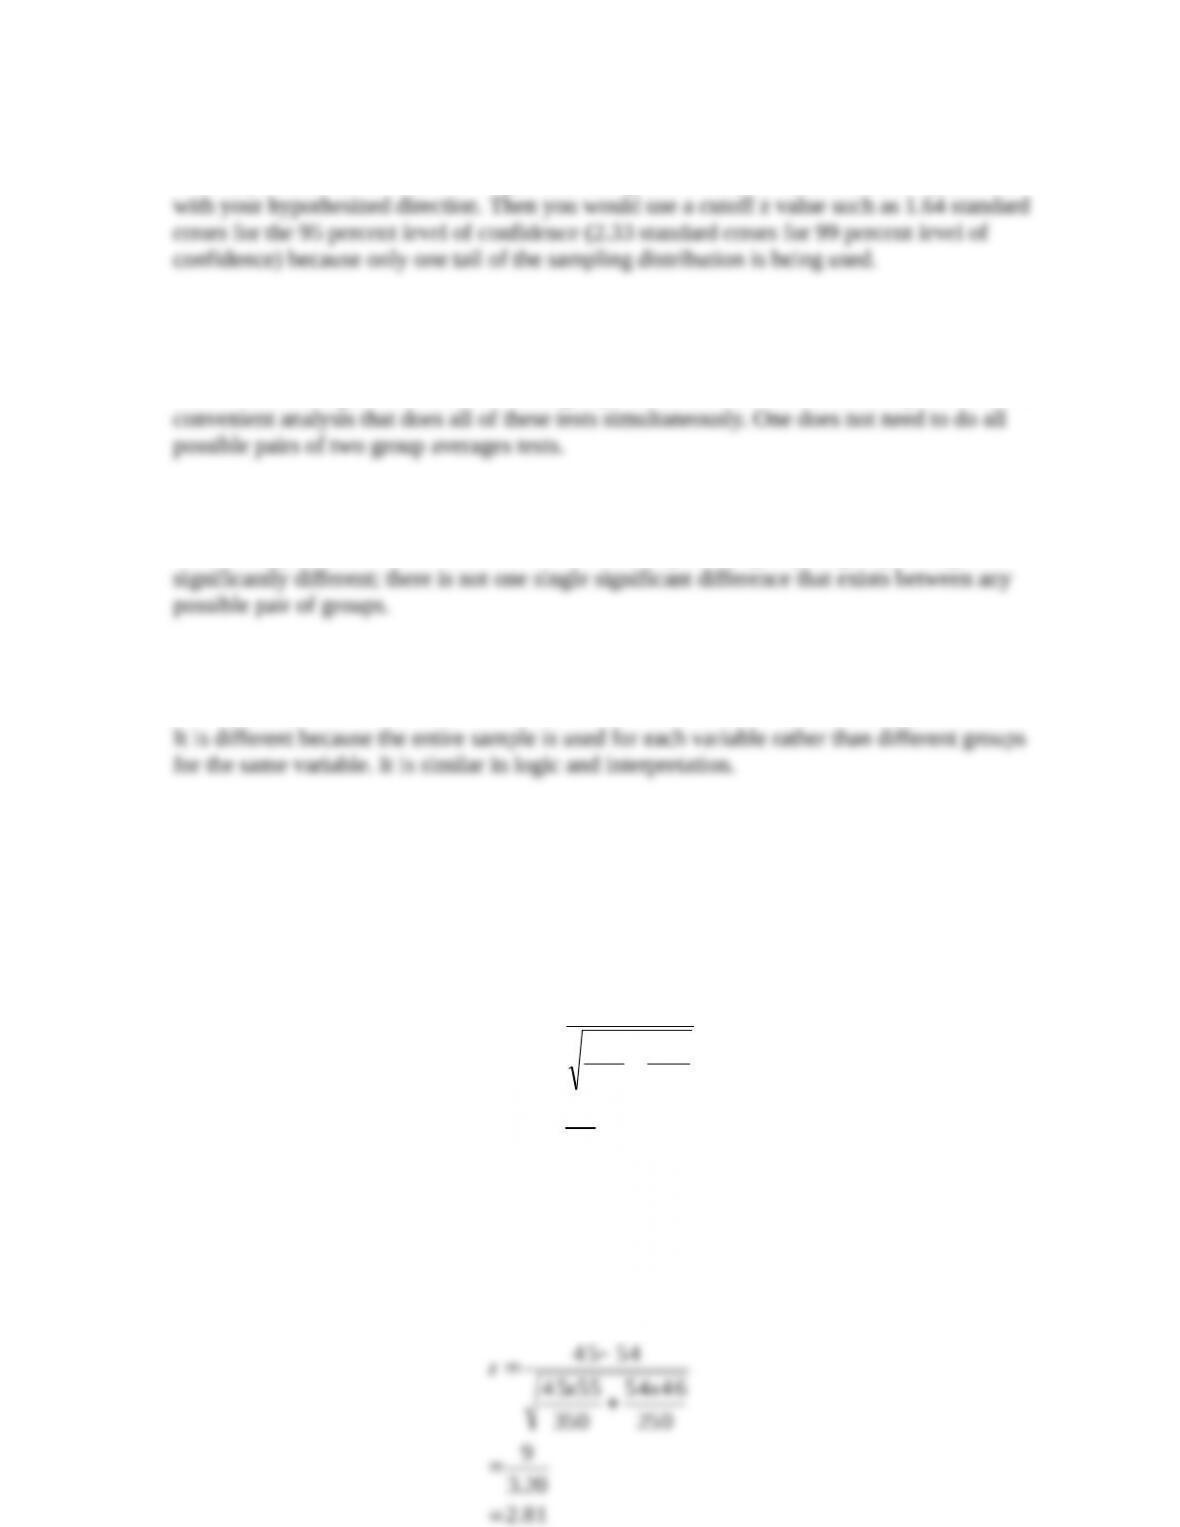
b. Sample 1 percent of 45%, n of 350; sample 2 percent of 54%, n of 250; level of 99%
56.
19.
1.1
300
5.2
150
5.1
7.116.10
22
z
81.2
20.3
9
z
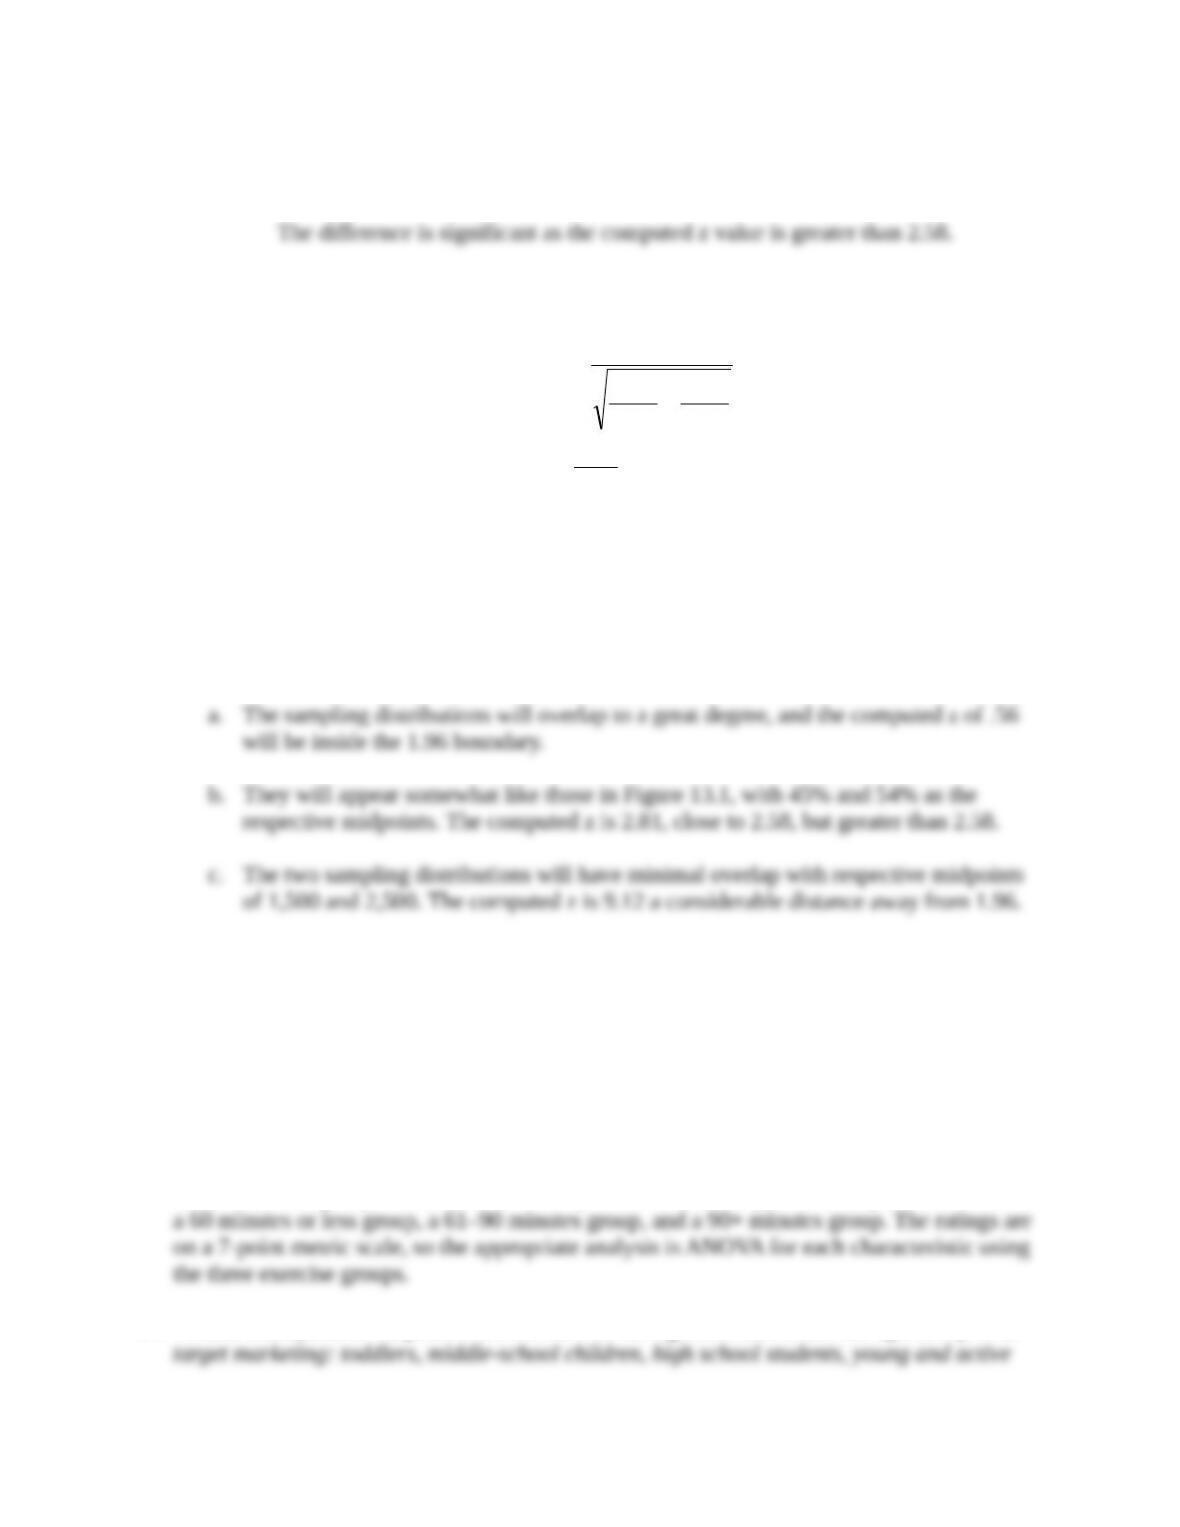
c. Sample 1 mean of 1,500, s.d. of 550, n of 1,200; sample 2 mean of 1,250, s.d. of 500,
n of 500, level of 95%
There is a statistically significant difference.
12. Demonstrate your understanding of your work in question 11, by drawing the sampling
distributions of each case—a, b, and c—in the format presented in Figure 13.1.
13. A researcher is investigating different types of customers for a sporting goods store. In a
survey, respondents have indicated how much they exercise in approximate minutes per
week. These respondents have also rated the performance of the sporting goods store across
twelve difference characteristics such as good value for the price, convenience of location,
and helpfulness of the sales clerks. The researcher used a 7-point rating scale for these
twelve characteristics where 1 = poor performance and 7 = excellent performance. How can
the researcher investigate differences in the ratings based on the amount of exercise reported
by the respondents?
There are three groups based on their weekly exercise time range, for example there could be
14. A shoe manufacturer suspects there are six market segments that it can use effectively in its
target marketing: toddlers, middle-school children, high school students, young and active
12.9
4.27
250
500
500
1200
550
12501500
22
z
adults, professionals, and senior citizens. How many pairs of averages can be assessed for
significant differences? Specify each separate pair.
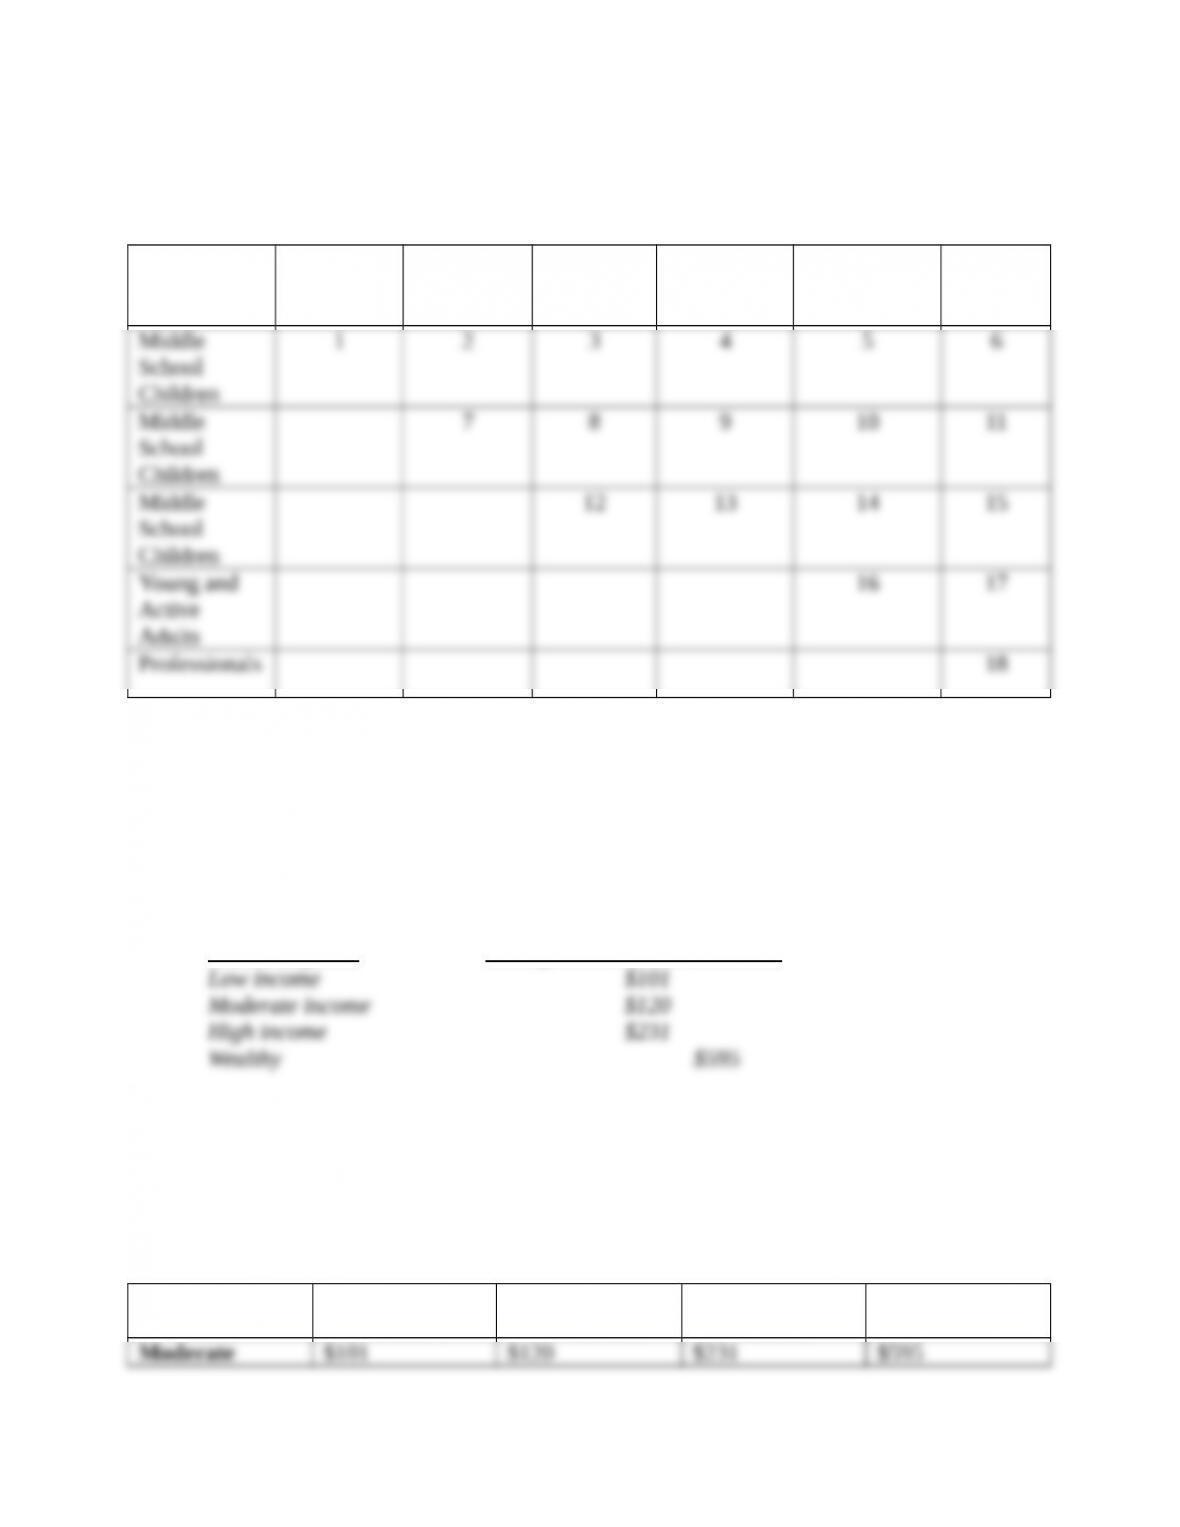
There are 18 separate pairs. Here is a matrix that identifies all of the pairs.
Toddler Middle
School
Children
High
School
Students
Young and
Active
Adults
Professionals Senior
Citizens
15. A marketing manager of a Web-based catalog sales company uses a segmentation scheme
based on the incomes of target customers. The segmentation system has four segments: (1)
low income, (2) moderate income, (3) high income, and (4) wealthy. The company database
holds information on every customer’s purchases over the past several years, and the total
dollars spent is one of the prominent variables. The marketing manager finds that the
average total dollar purchases for the four groups are as follows:
Market Segment Average Total Dollar Purchases
Construct a table that is based on how the XL Data Analyst presents its findings for ANOVA
that illustrates that the low- and moderate-income groups are not different from each other,
but the other groups are significantly different from one another.
The result would look like the following:
Low
income
Moderate
income
High
income
Wealthy
income
income
CASE SOLUTIONS
Case 13.1 The Daily Advocate Lost Subscribers Survey
Case Objective: Students must interpret the findings of several differences analyses and come
up with market segmentation strategies based on these findings.
Answers to Case Questions
1. Why has the Daily Advocate’s circulation fallen in the face of a population boom in Capital
City?
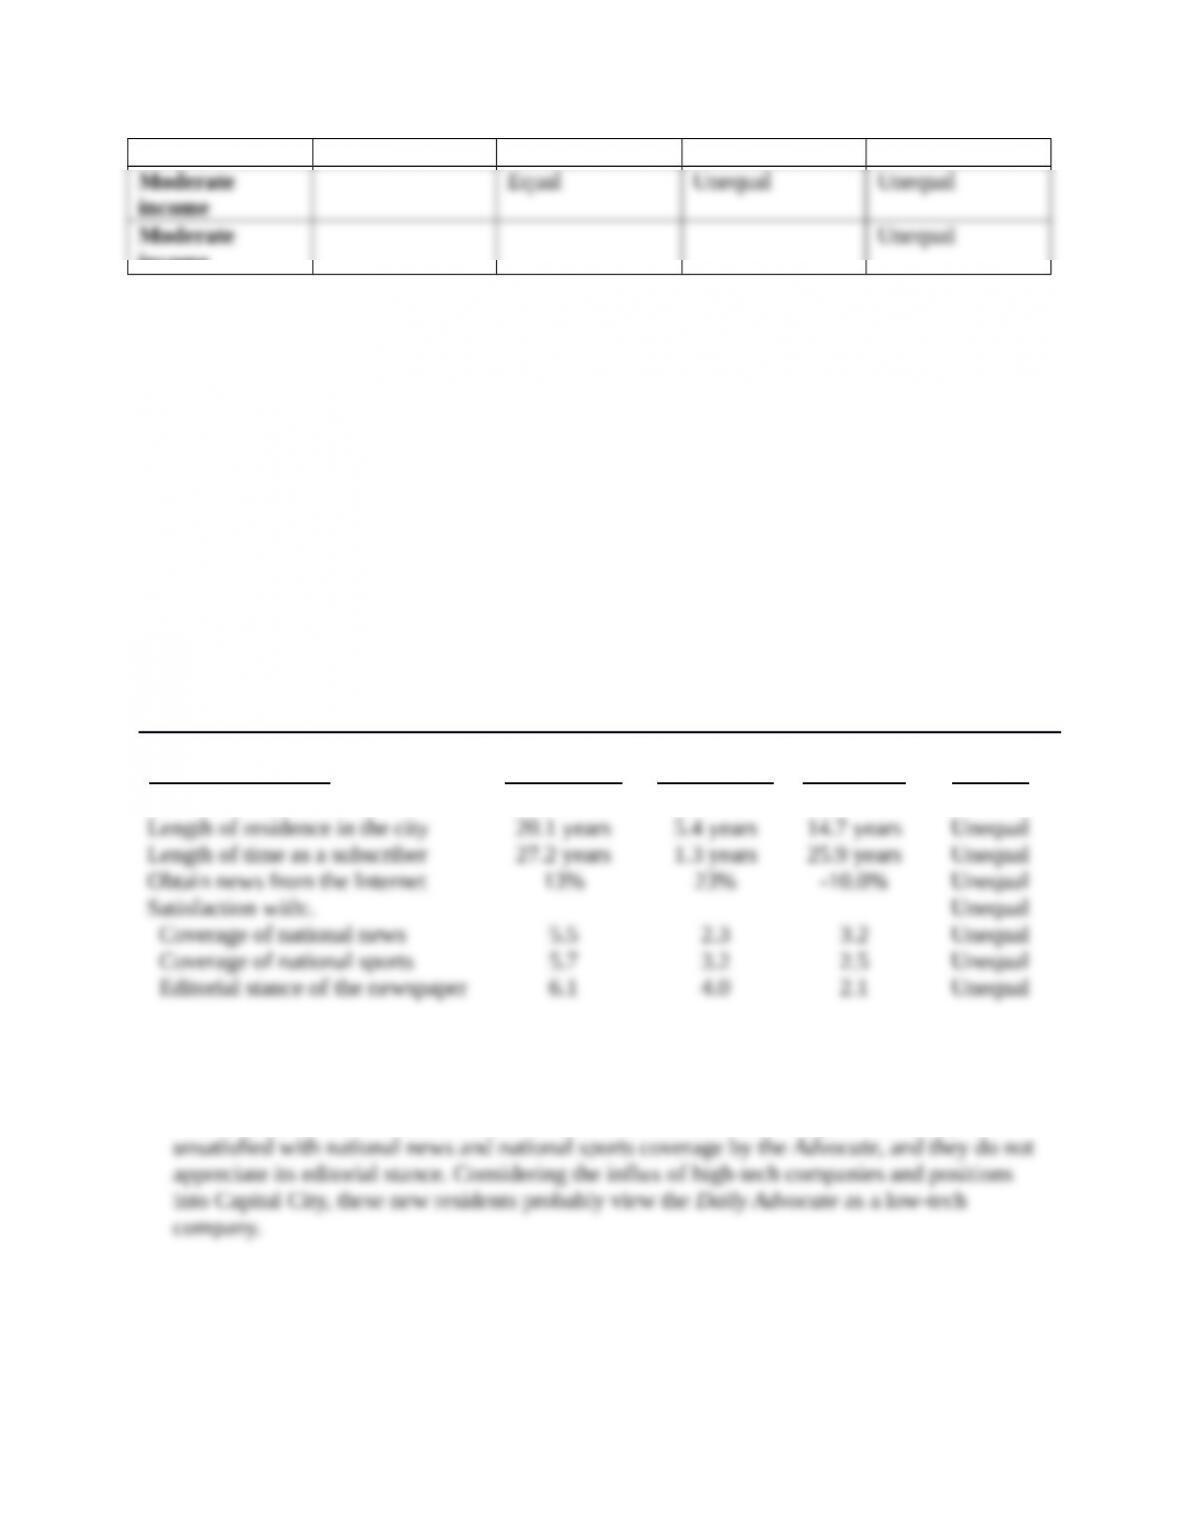
The table below is reconstructed from the one in the case, so only the variables with
significant differences are reported.
Variable Analyzed
Current
Subscribers
Lost
Subscribers Difference Finding
The lost subscribers are relatively new to the city (5.4 years), and their subscription length is
short due to being newcomers and dropping the subscription. Compared to the current
subscribers, the lost subscribers use the Internet as a news source. They are relatively
2. What marketing strategies should the Daily Advocate consider in order to sustain itself as
the primary news vehicle in Capital City?
The new residents of Capital City are a new market segment in high-tech/Internet delivery of
news, and they are definitely oriented toward national news and sports. (They are probably
Case 13.2 Integrated Case: The Advanced Automobile Concepts Survey
Differences Analysis
Case Objective: Students must perform the appropriate differences analyses on the Advanced
Automobile Concepts survey data to answer the questions posed by the
principals. Market segmentation differences are to be found and their
appropriate target market descriptions generated.
Answers to Case Questions
Your task is to apply appropriate differences analysis to your AAConcepts XL
Data Analyst data set to determine the target market descriptions for each
of the ve possible hybrid models.
The six demographic variables to be used as grouping variables are:
Gender (2 groups), Marital status (2 groups), Age category (7 groups),
It is more efficient to perform the di4erences tests by demographic
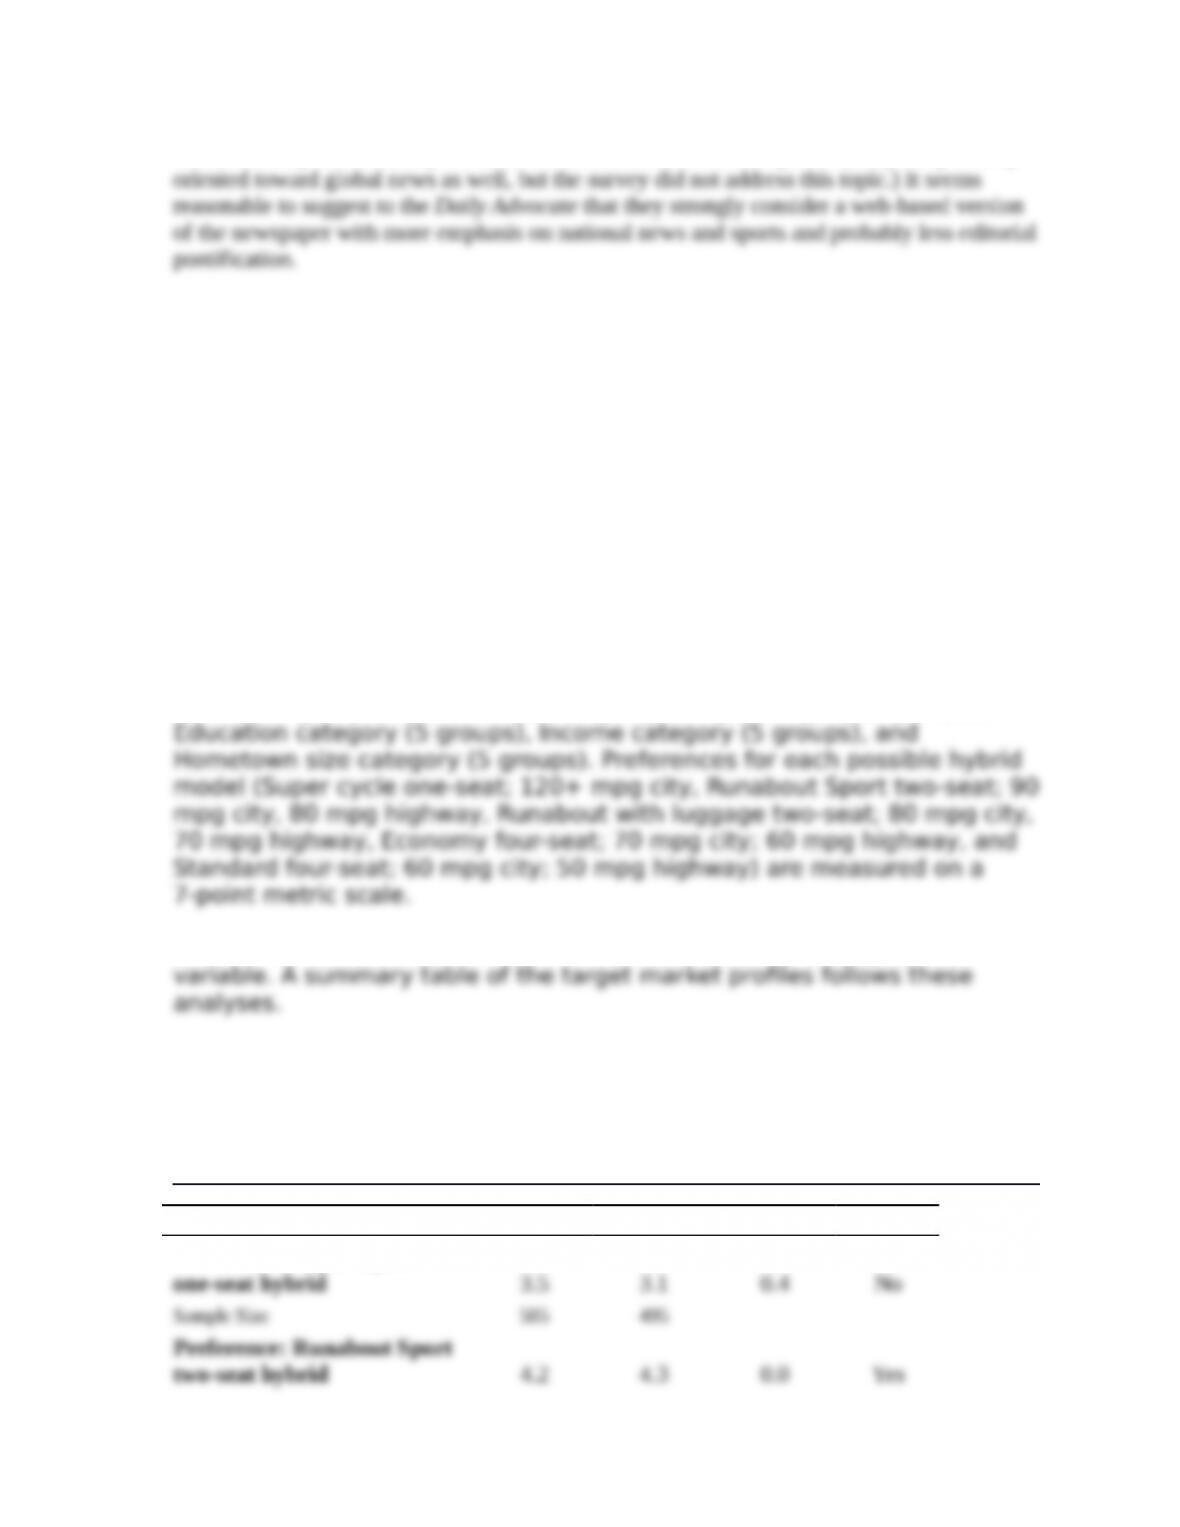
Gender: males prefer the super cycle more than females; females
prefer the standard size four-seat model more than males.
Gender Male Female Difference Equal?*
Preference: Super Cycle
*Yes = Equal
No = Not Equal at 95% level of significance
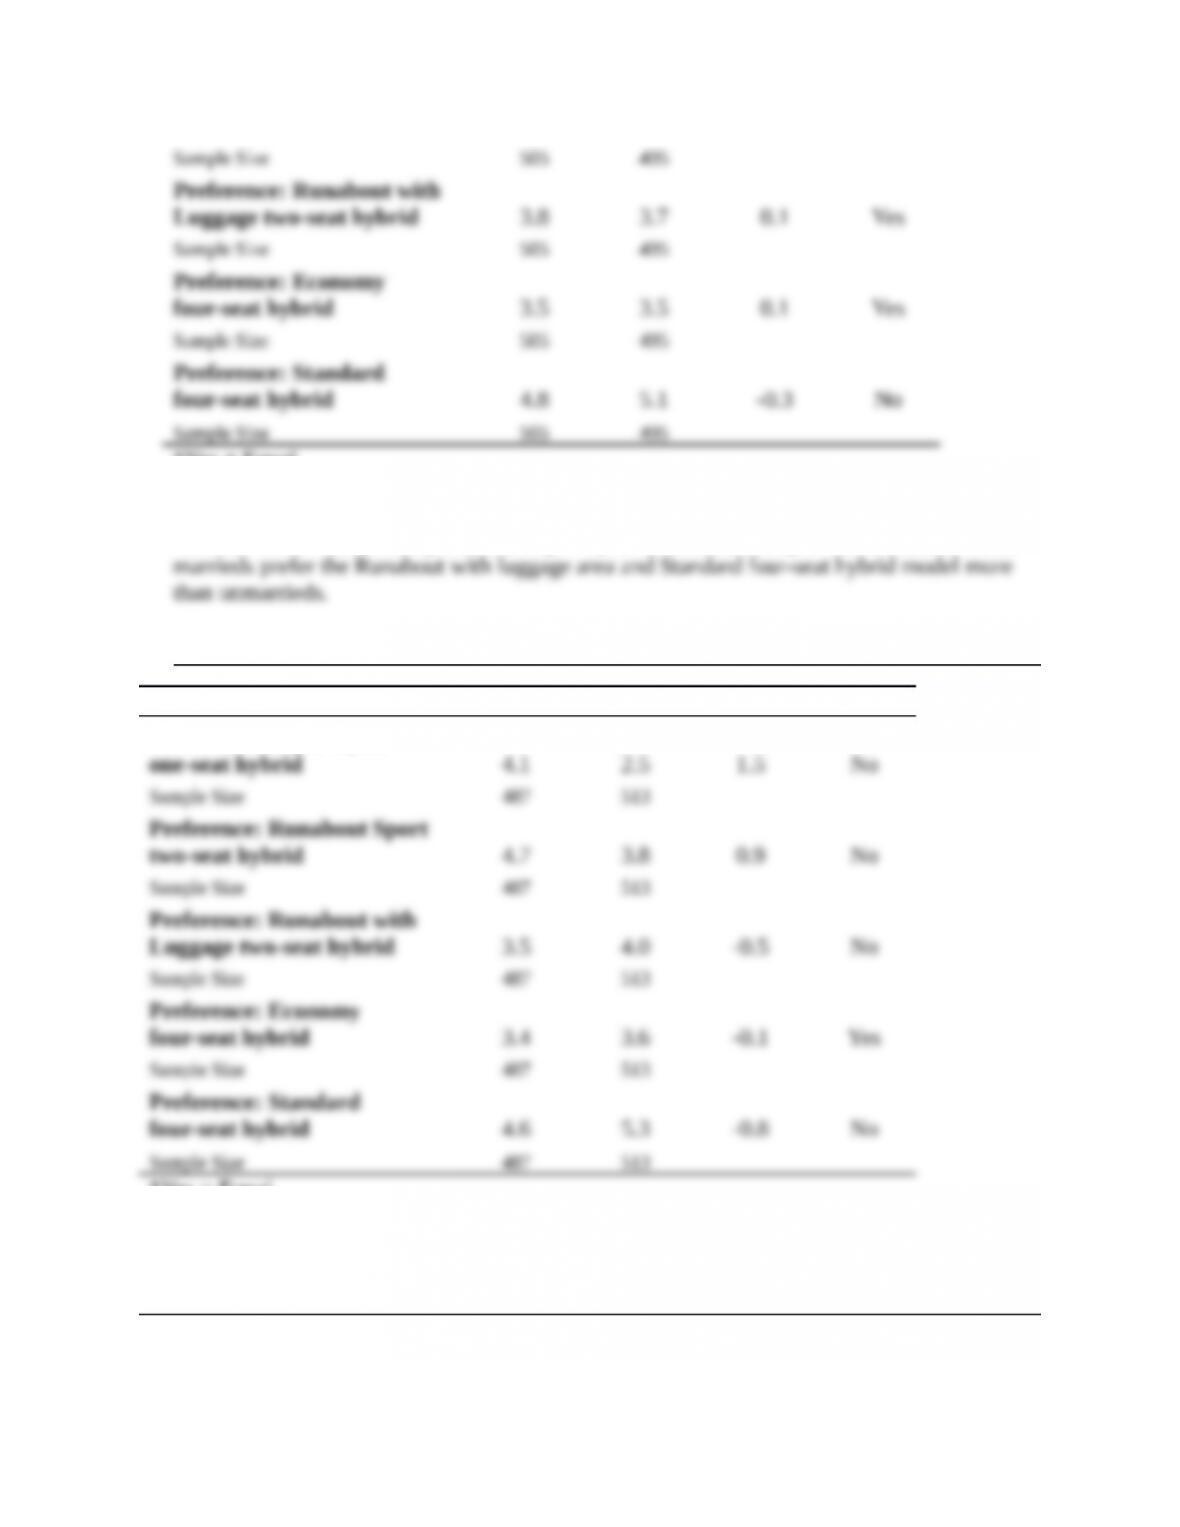
Marital status: Unmarrieds prefer the Super Cycle and Runabout Sport more than marrieds;
Marital status Unmarried Married Difference Equal?*
Preference: Super Cycle
*Yes = Equal
No = Not Equal at 95% level of significance
Age category: Super Cycle is most preferred by the youngest drivers.
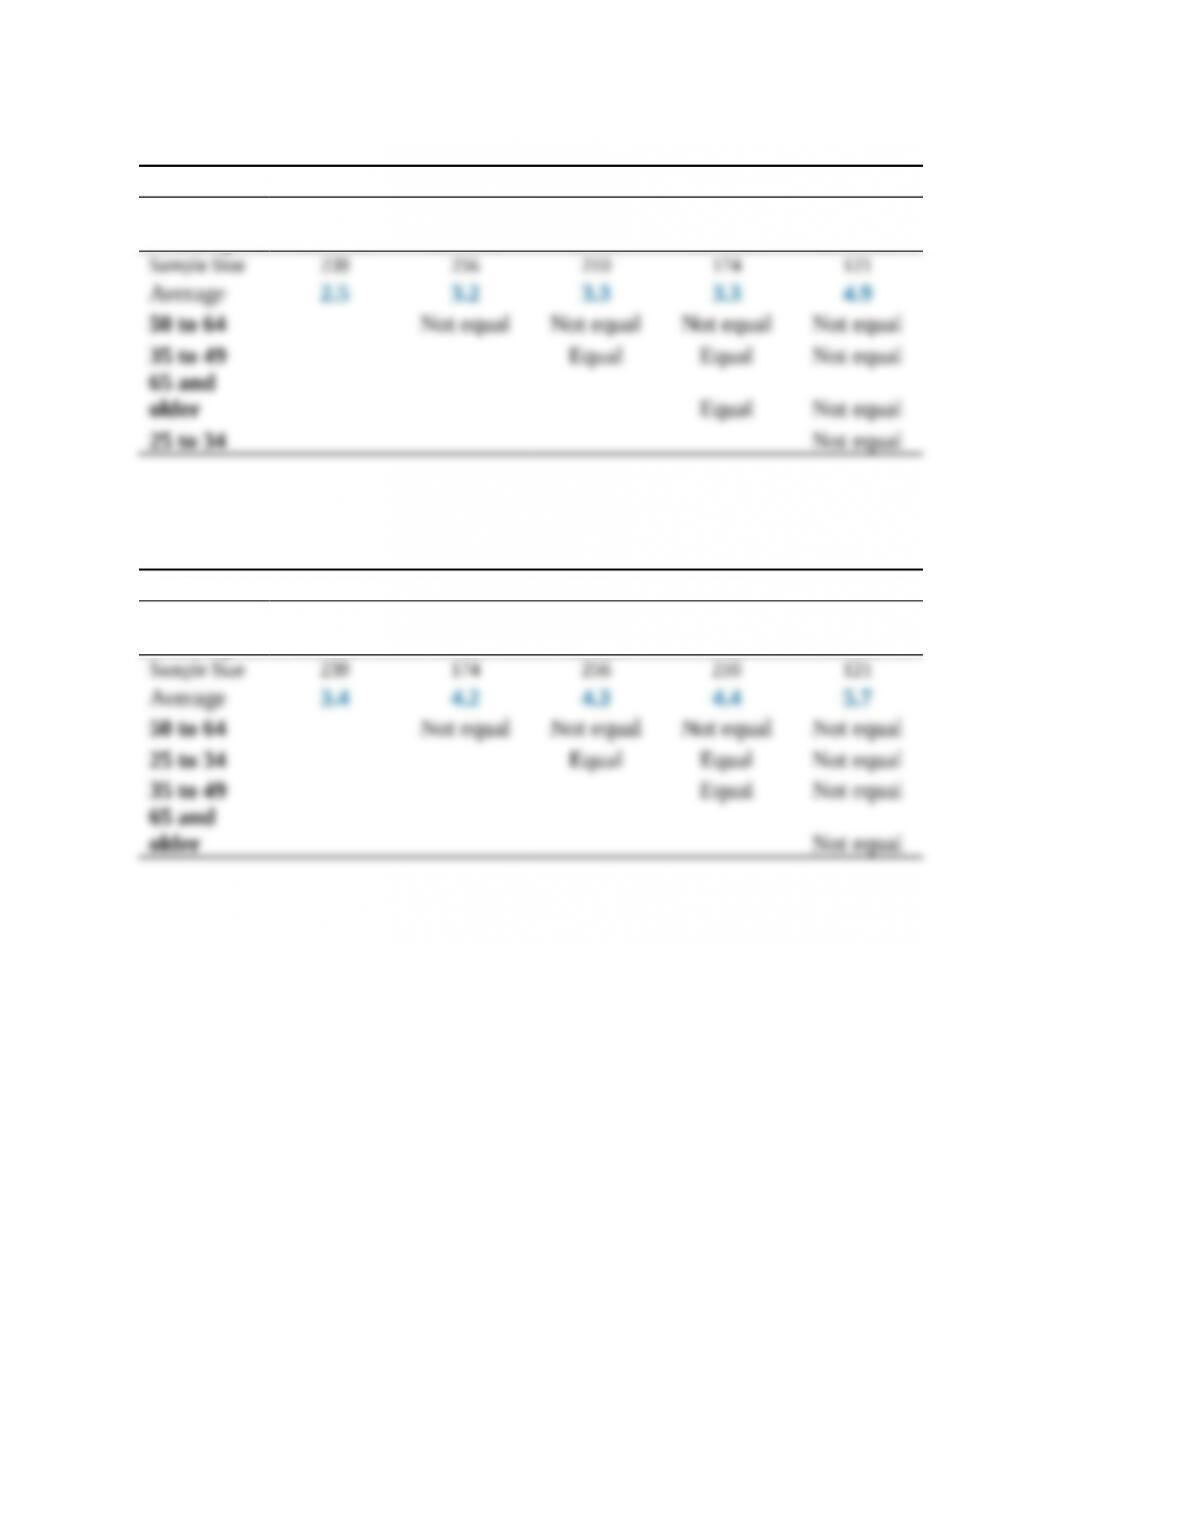
Preference: Super Cycle one-seat hybrid
Group 50 to 64 35 to 49
65 and
older 25 to 34 18 to 24
Age category: Runabout Sport is most preferred by the youngest drivers.
Preference: Runabout Sport two-seat hybrid
Group 50 to 64 25 to 34 35 to 49
65 and
older 18 to 24
Age category: Runabout with luggage is most preferred by the 18–34s.