
CASE SOLUTIONS
Case 12.1The Pets, Pets, & Pets Survey
Case Objective: Students must use the proper formulas and interpretations to perform
the various generalization analyses necessary.
Answers to Case Questions
1. How often did Pets, Pets, & Pets customers visit it last year?
x ± zaxs
√
n
=¿
¿4.4 ±1.96 x4.98
√
162
¿4.4 ±1.96 x.39
¿4.4 ±.76
3.6 to 5.2 times
2. How much did they typically spend on the last visit?
x ± zaxs
√
n
=¿
¿18.2±1.96 x8.50
√
162
¿18.2±1.96 x.67
¿18.2±1.31
$16.89 to $19.51
3. How likely are they to buy a Pets, Pets, & Pets on their next visit?
x ± zaxs
√
n
=¿
¿5.3 ±1.96 x1.50
√
162
¿5.3 ±1.96 x.12
¿5.3 ±.23
Copyright © 2012 Pearson Education, Inc. publishing as Prentice Hall
1

5.1 to 5.5
4. What percent are “regular” Pets, Pets, & Pets customers?
p± zax
√
p x q
n
¿44.4 ±1.96 x
√
44.4 x55.6
162
¿44.4 ±1.96 x3.9
¿44.4 ±7.7
36.7% to 52.1%
5. What percent has recommended Pets, Pets, & Pets to friends?
p± zax
√
p x q
n
¿82.1±1.96 x
√
82.1 x17.9
162
¿82.1±1.96 x3.0
¿82.1±5.9
76.2% to 88.0%
6. The manager at Pets, Pets, & Pets believes that, on average, store customers own
two pets. Is this belief supported by the survey?
z=x−μH
s
√
n
¿1.64−2
.77
√
162
¿−.36
.06
¿−6.0
Because -6.0 is greater than -1.96, the hypothesis is not supported. The confidence
interval is:
x ± zaxs
√
n
=¿
Copyright © 2012 Pearson Education, Inc. publishing as Prentice Hall
2

¿1.64 ±1.96 x.77
√
162
¿1.64 ±1.96 x.06
¿1.64 ±.12
1.5 to 1.8 pets
7. The manager also believes that Pets, Pets, & Pets monthly newspaper advertising
is highly effective and reaches 80% of the store’s customers. Is this belief
supported by the survey?
z=p−πH
√
pxq
n
¿46.9−80
√
46.9 x53.1
162
¿−33.1
3.9
= –8.49
Because -8.49 is greater than -1.96, the hypothesis is not supported. The
confidence interval is:
p± zax
√
p x q
n
¿46.9 ±1.96 x
√
46.9 x53.1
162
¿46.9 ±1.96 x3.9
¿46.9 ±7.8
39.1% to 54.7%
Case 12.2 Integrated Case: The Advanced Automobile Concepts Survey
Generalization Analysis
Case Objective: Students must use the XL Data Analyst with the Advanced Automobile
Concepts data set to perform and interpret various generalization
analyses.
Answers to Case Questions
Copyright © 2012 Pearson Education, Inc. publishing as Prentice Hall
3
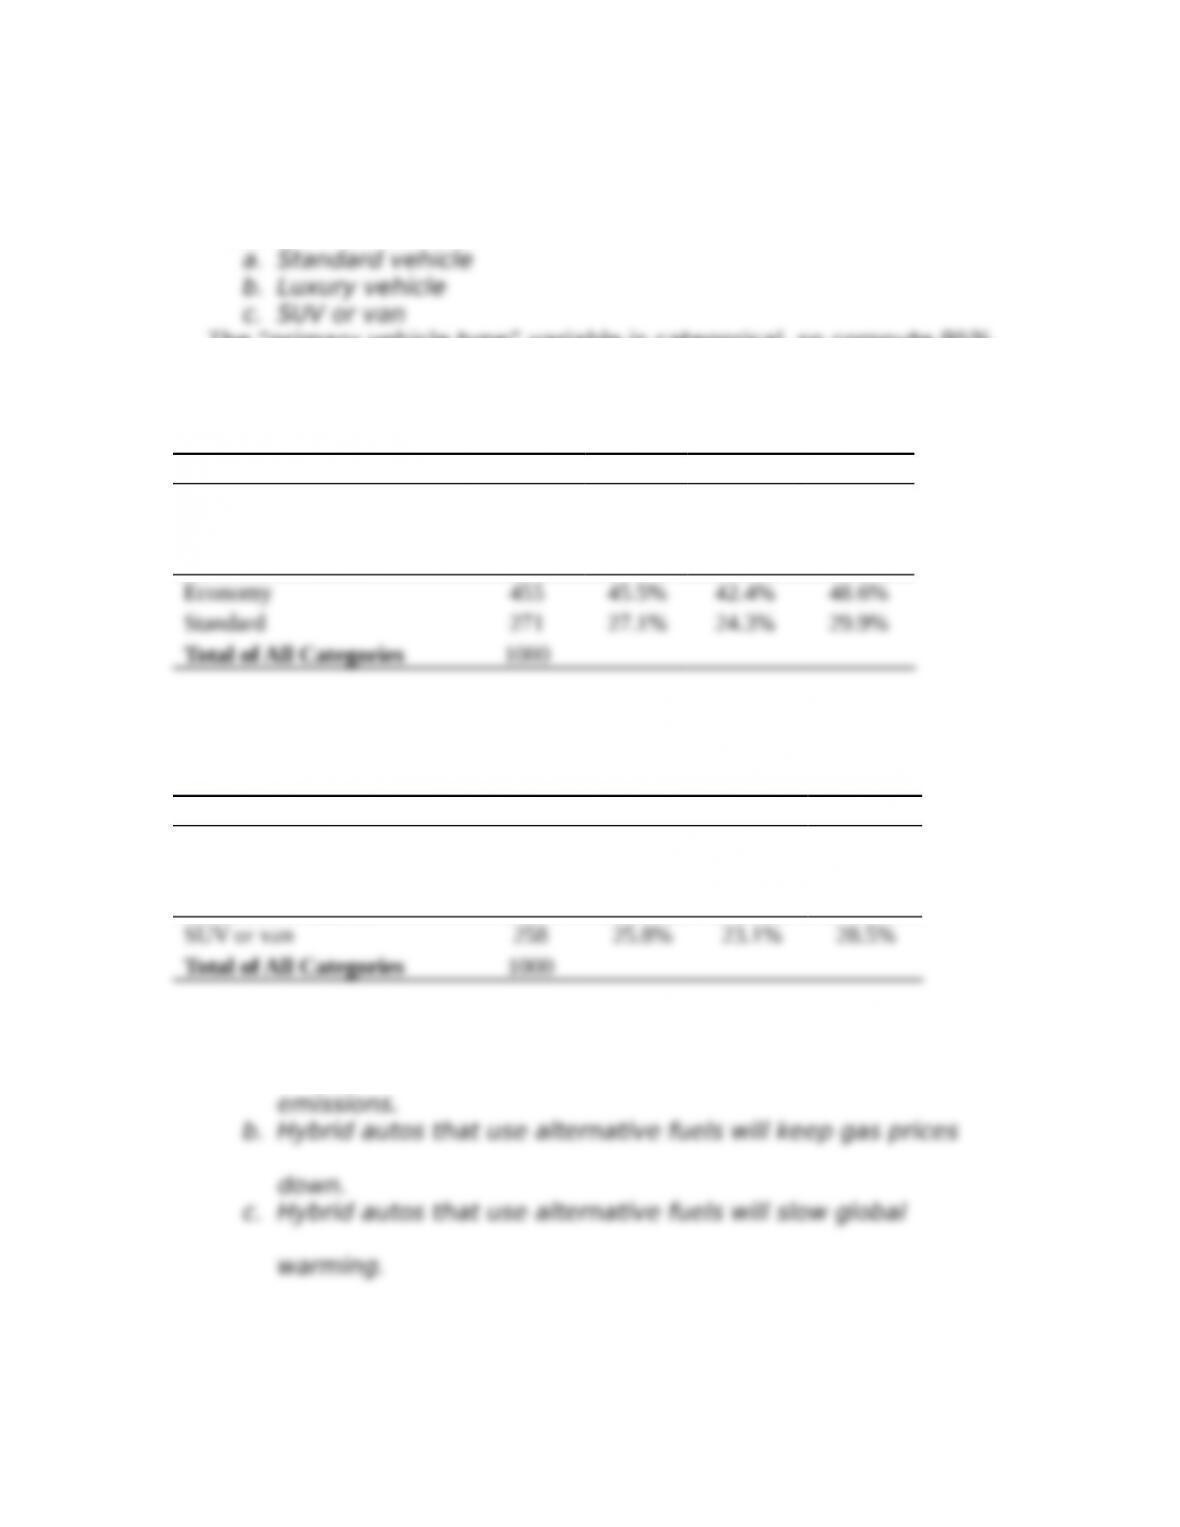
1. What percent of the American public owns the following type of
vehicle?
The “primary vehicle type” variable is categorical, so compute 95%
confidence intervals to the two answer categories of “economy” and
“standard.”
Primary Vehicle Price Type
Category
Frequen
cy Percent
Lower
Boundar
y
Upper
Boundar
y
“SUV or van” is a category in the Primary vehicle type variable, so
compute a 95% confidence interval for it.
Primary Vehicle Type
Category
Frequenc
y Percent
Lower
Boundar
y
Upper
Boundar
y
2. How does the American public feel about the following statements?
a. Hybrid autos that use alternative fuels will reduce fuel
Copyright © 2012 Pearson Education, Inc. publishing as Prentice Hall
4
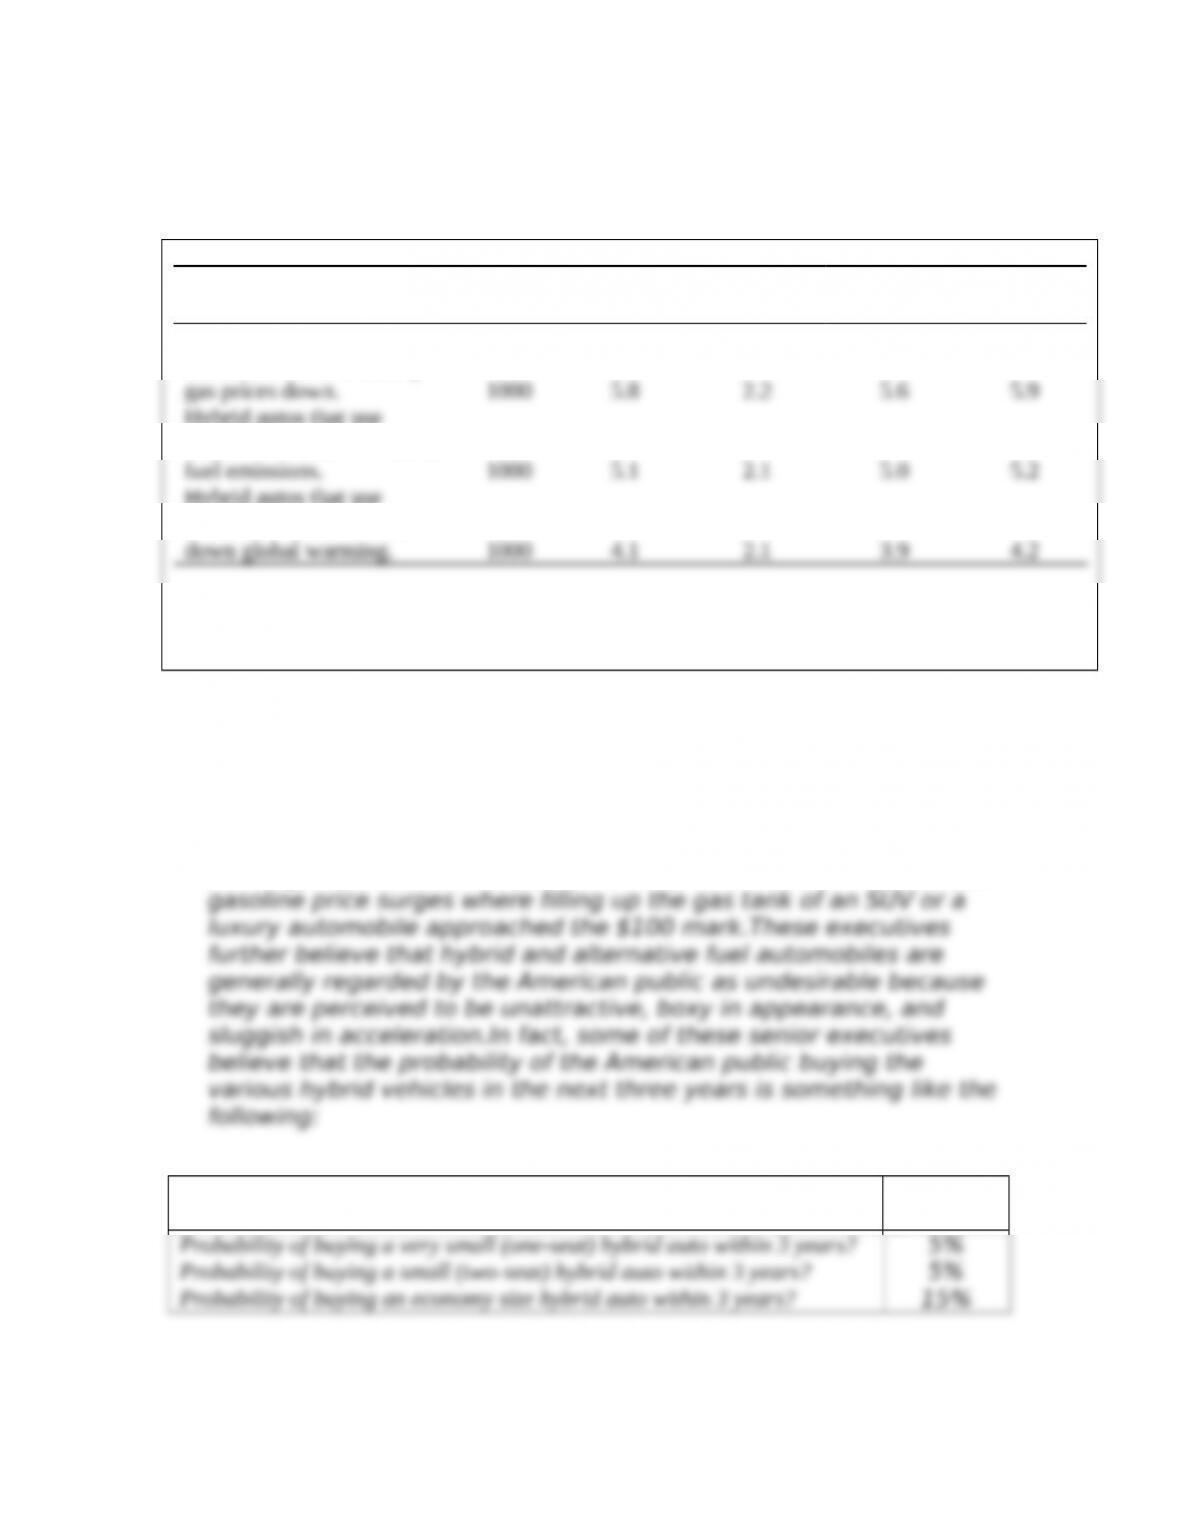
The same metric scale is used for all three statements, so compute
95% confidence intervals for the averages.
Variable Sample Average
Standard
Deviation
Lower
Boundary
Upper
Boundary
Hybrid autos that use
alternative fuels will keep
Hybrid autos that use
alternative fuels will reduce
Hybrid autos that use
alternative fuels will slow
3. Prtincipals at Advanced Automobile Concepts fully understand that
there is resistance to change in Zen.There are some senior
executives who grew up during America’s “romance with the
automobile” era of the 1950s and 1960s and who believe that most
Americans want a large and powerful automobile.These executives
point out that SUVs are extremely popular despite global warming
warnings that have been issued for the past decade and numerous
Hybrid Vehicle Type Probabilit
y
Copyright © 2012 Pearson Education, Inc. publishing as Prentice Hall
5
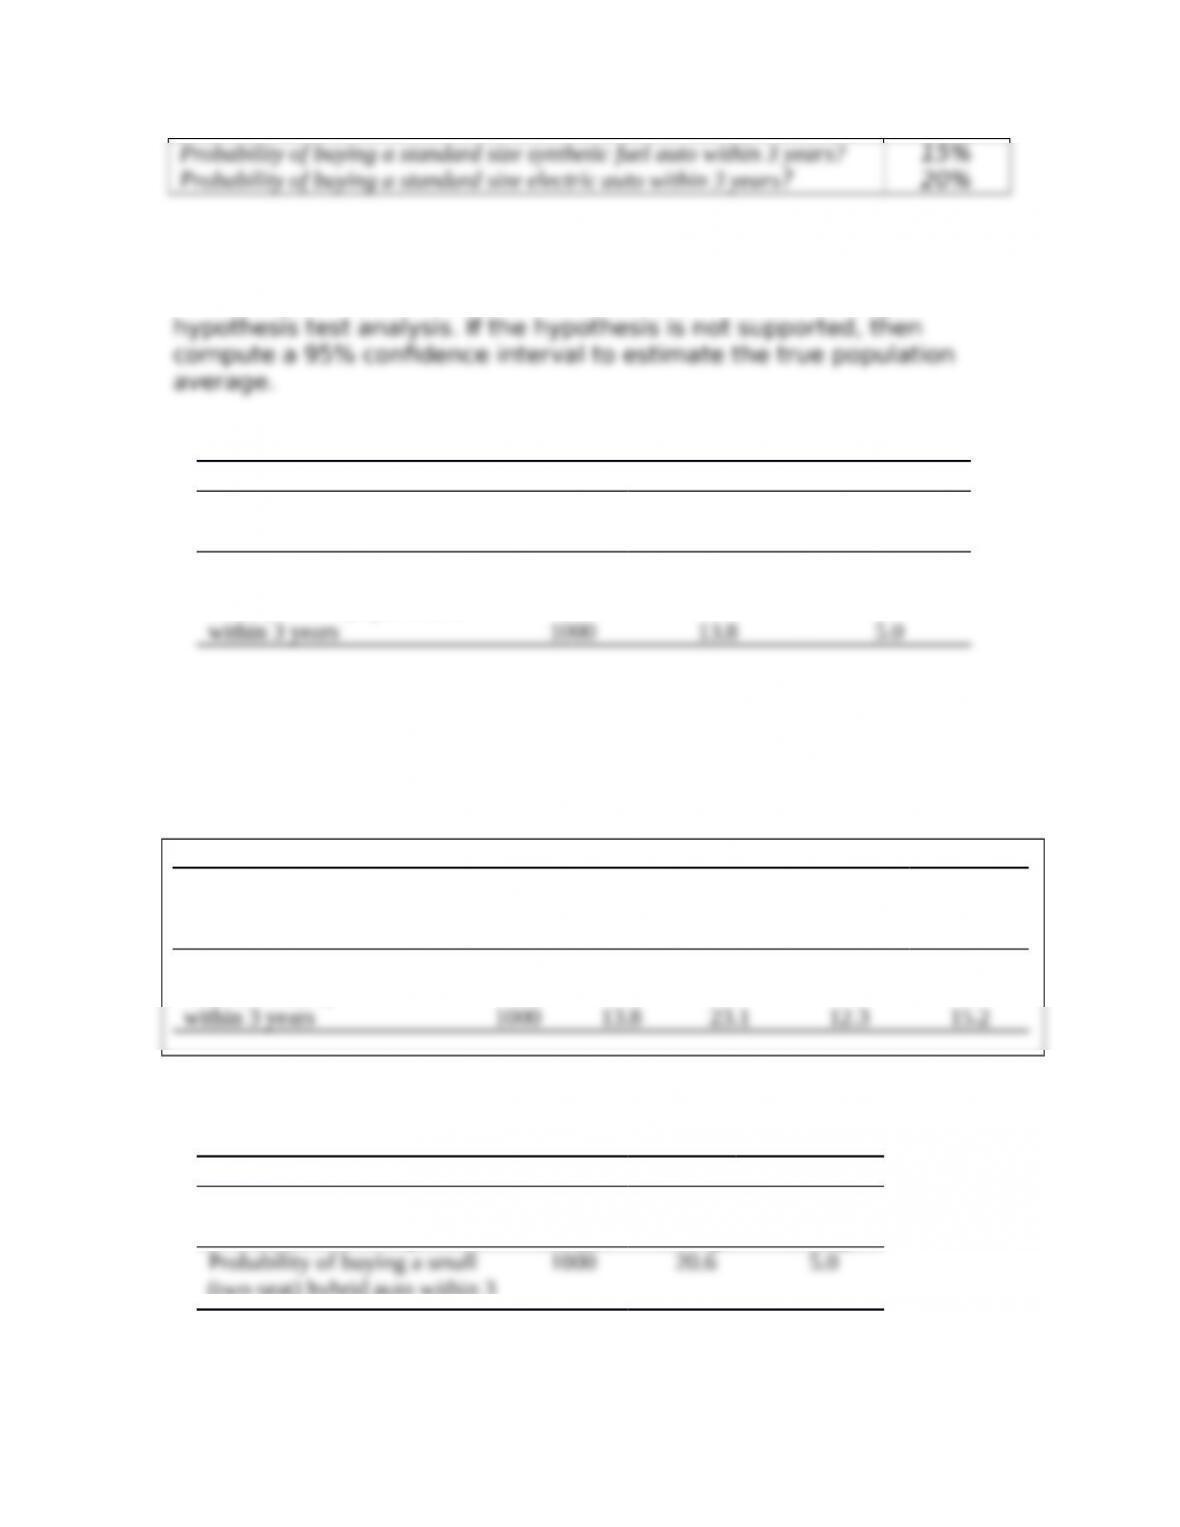
Test these hypotheses with the finding from the survey.
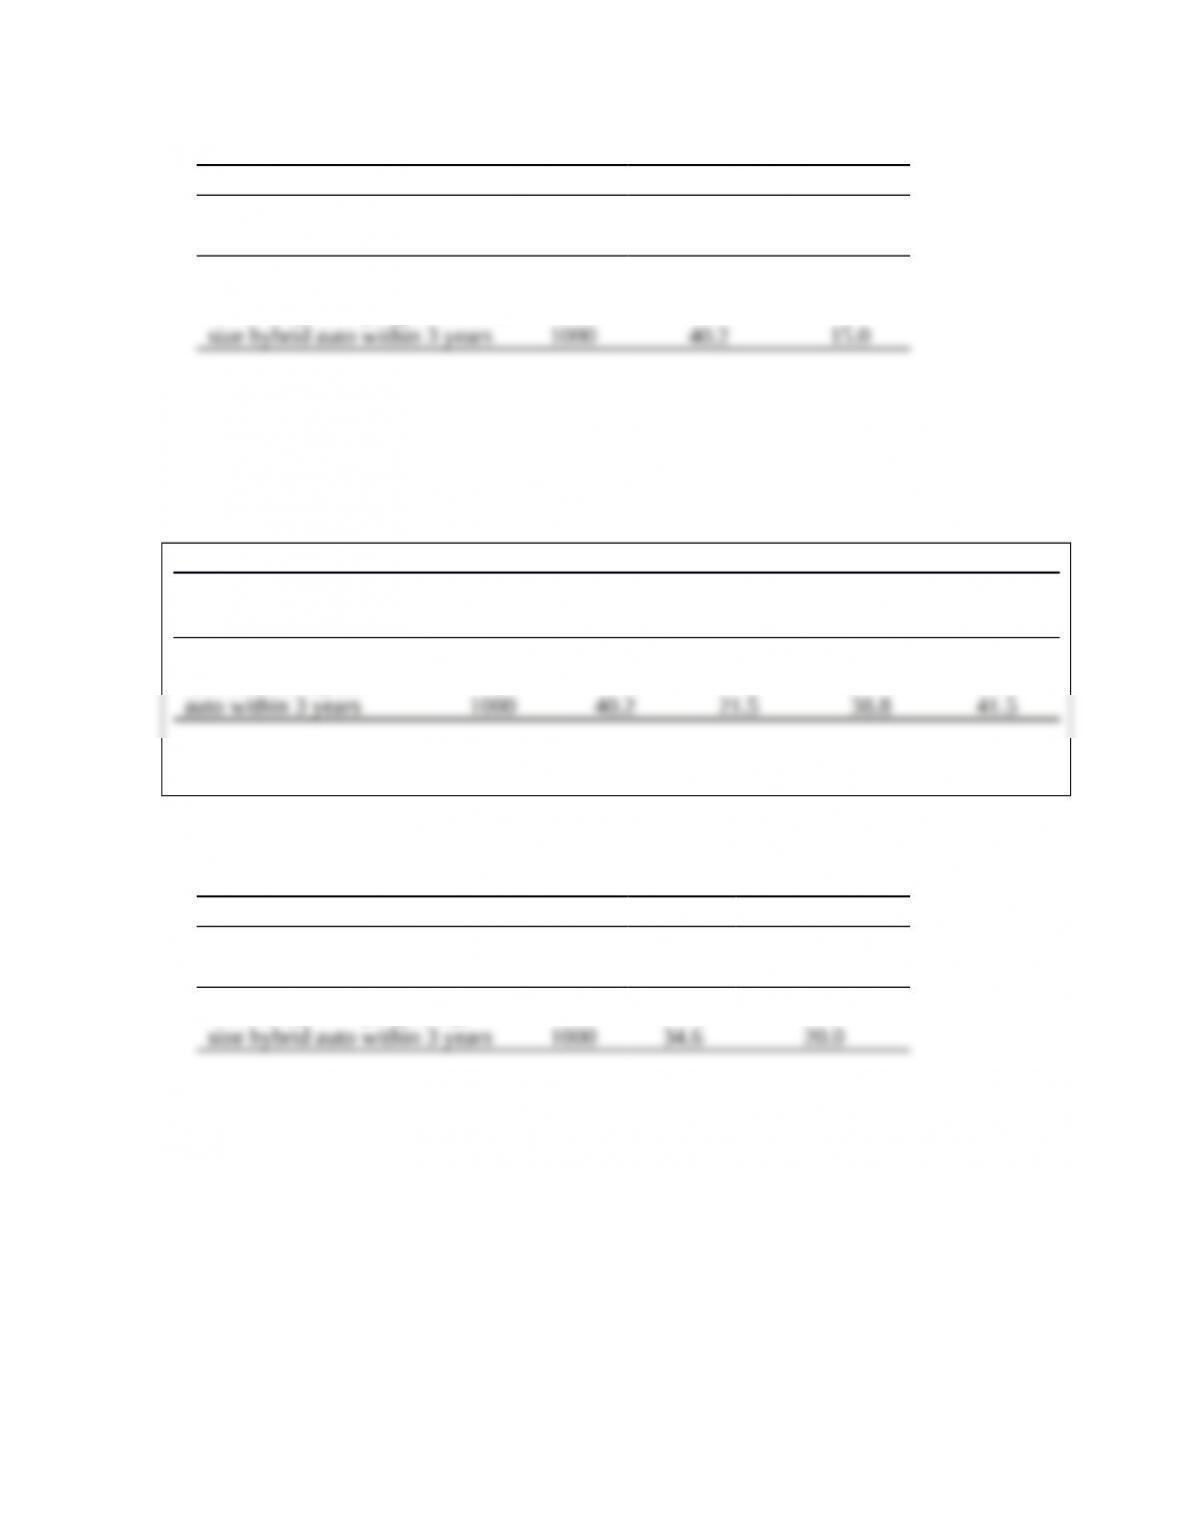
Probability is measured with a metric scale, so use the average
Hypothesis Test for an Average
Variable Description Sample
Sample
Average
Hypoth.
Average
Probability of buying a very
small (one-seat) hybrid auto
Does the sample support the hypothesized average?
At 95% level of confidence, this hypothesis is: NOT SUPPORTED
Variable Sample Average
Standard
Deviatio
n
Lower
Boundary
Upper
Boundar
y
Probability of buying a very
small (1 seat) hybrid auto
Hypothesis Test for an Average
Variable Description Sample
Sample
Average
Hypoth.
Average
(two-seat) hybrid auto within 3
Copyright © 2012 Pearson Education, Inc. publishing as Prentice Hall
6
years
Does the sample support the hypothesized average?
At 95% level of confidence, this hypothesis is: NOT SUPPORTED
Variable
Sampl
e Average
Standard
Deviation
Lower
Boundary
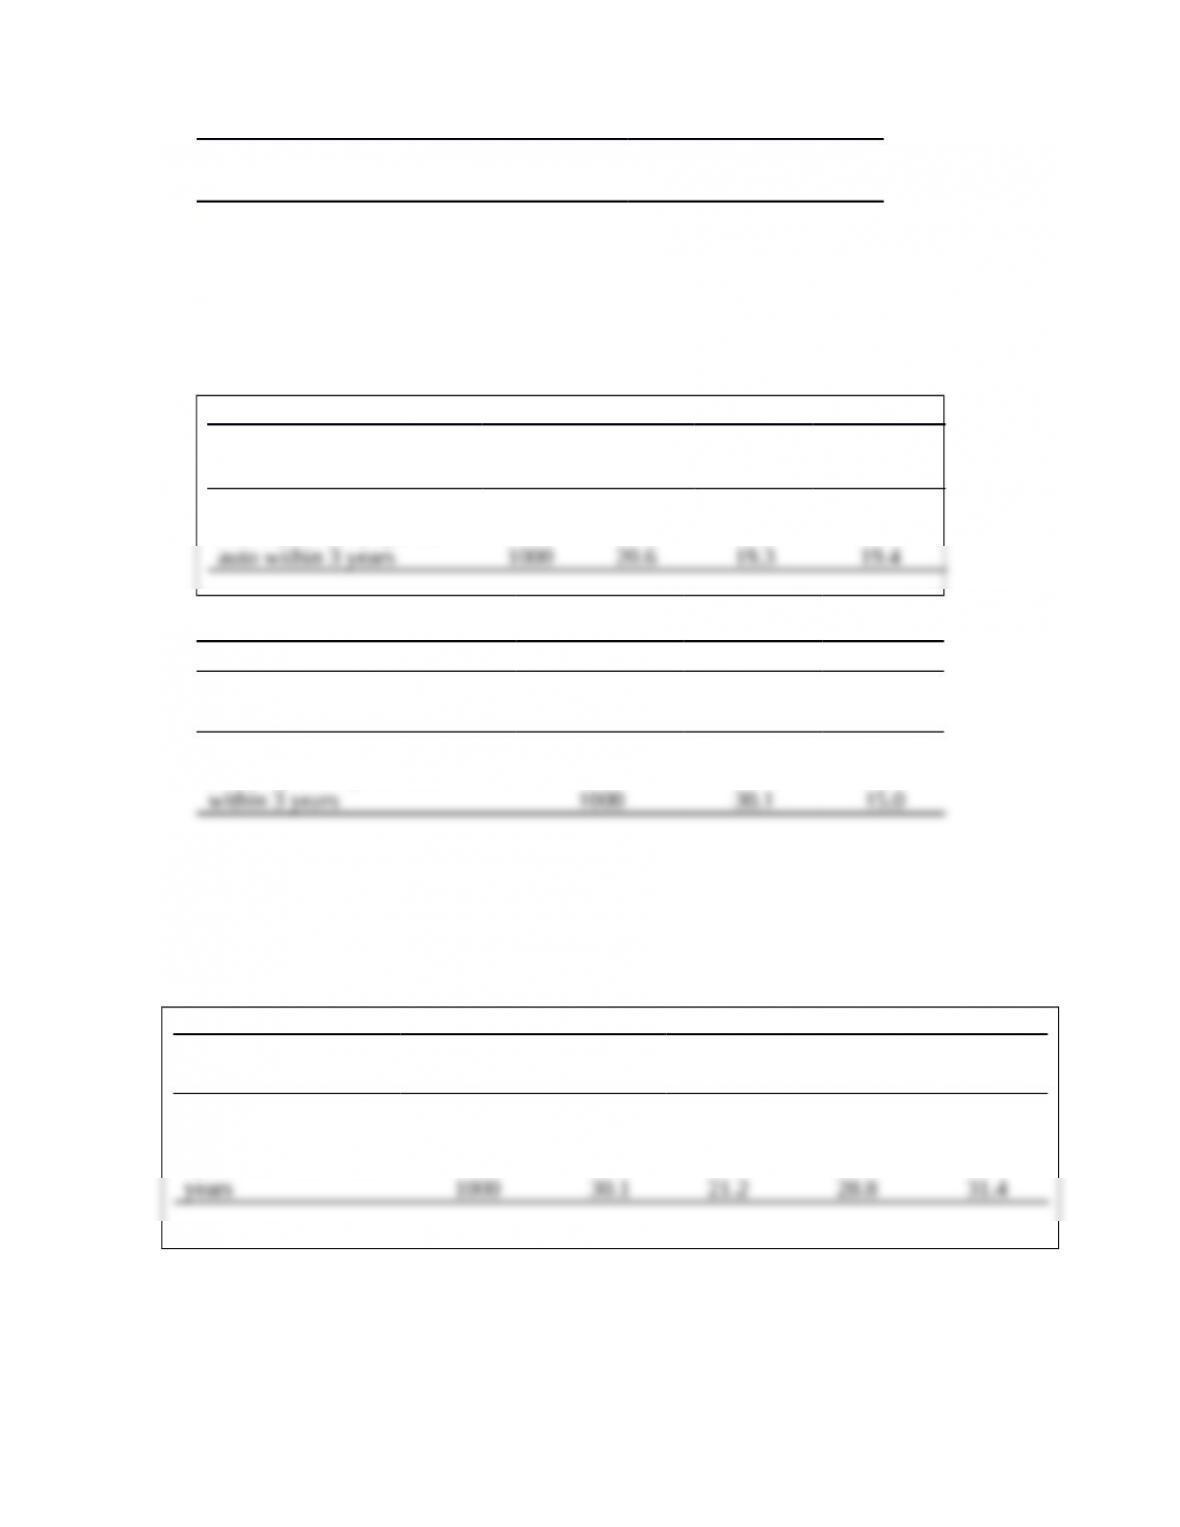
Probability of buying a
small (two-seat) hybrid
Hypothesis Test for an Average
Variable Description Sample
Sample
Average
Hypoth.
Average
Probability of buying an
economy size hybrid auto
Does the sample support the hypothesized average?
At 95% level of confidence, this hypothesis is: NOT SUPPORTED
Variable Sample Average
Standard
Deviation
Lower
Boundary
Upper
Boundary
Probability of buying
an economy size
hybrid auto within 3
Copyright © 2012 Pearson Education, Inc. publishing as Prentice Hall
7
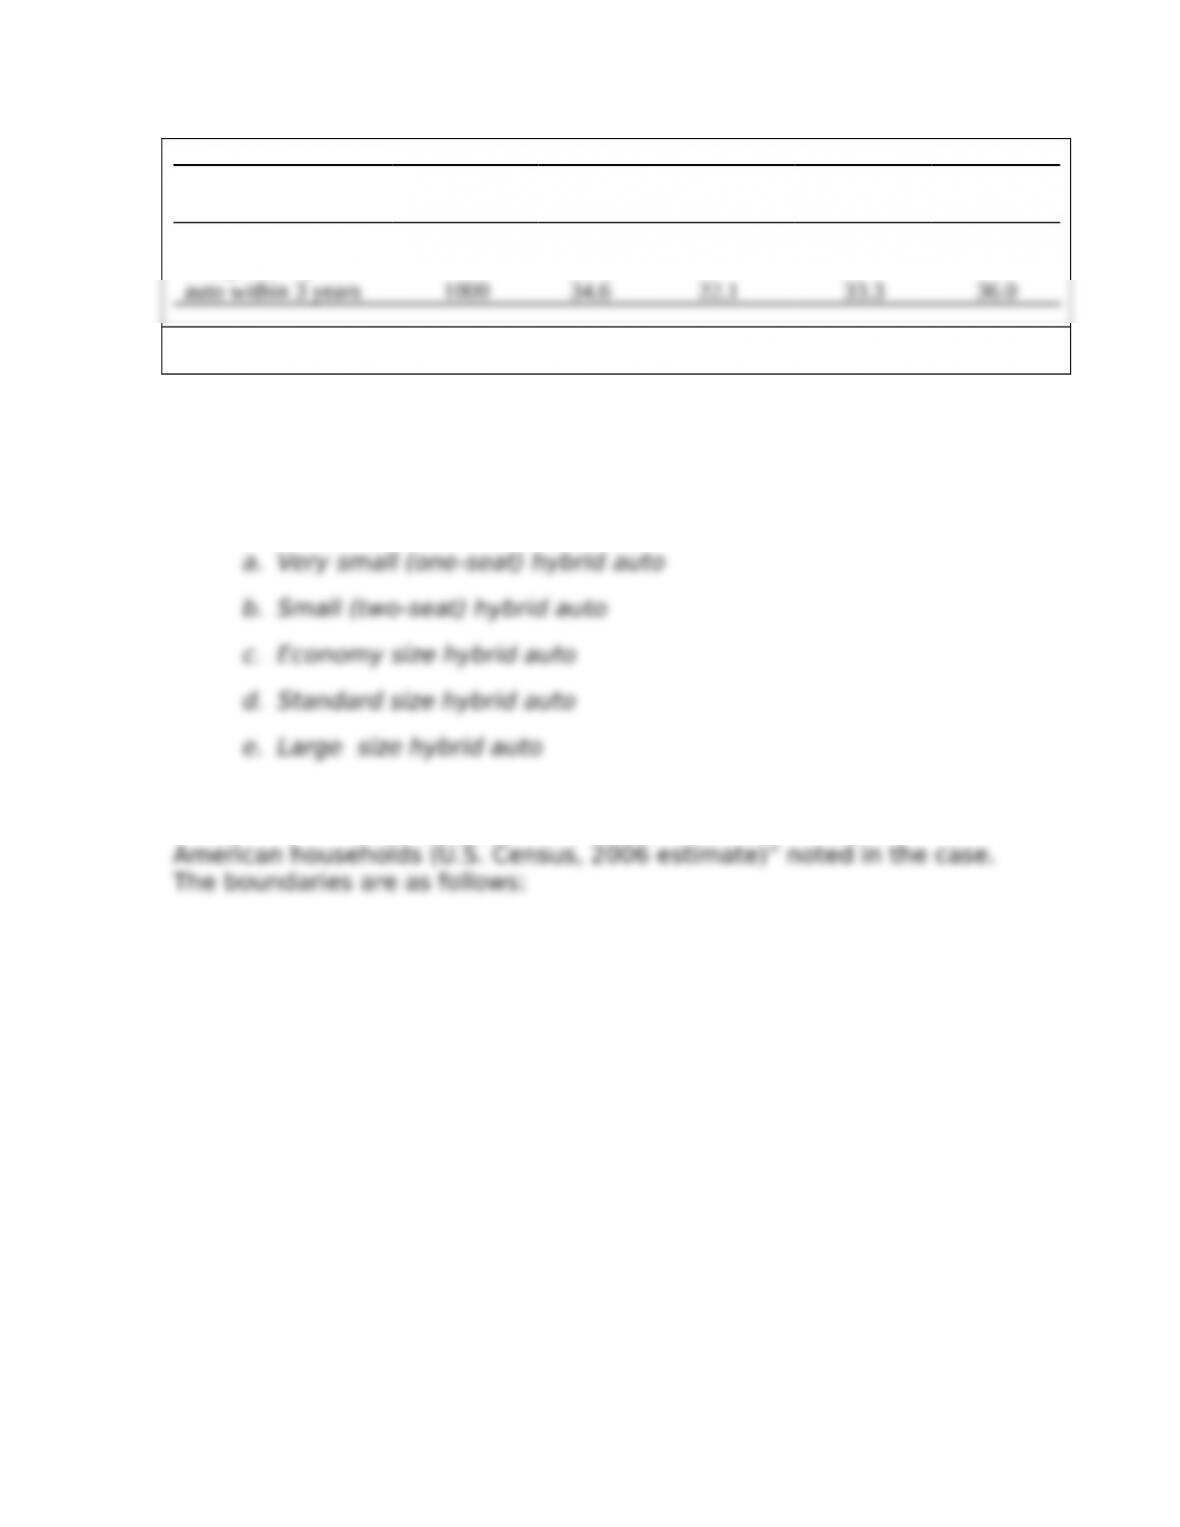
Hypothesis Test for an Average
Variable Description Sample
Sample
Average
Hypoth.
Average
Probability of buying a standard
Does the sample support the hypothesized average?
At 95% level of confidence, this hypothesis is NOT SUPPORTED
Variable Sample Average
Standard
Deviation
Lower
Boundary
Upper
Boundary
Probability of buying a
standard size hybrid
Hypothesis Test for an Average
Variable Description Sample
Sample
Average
Hypoth.
Average
Probability of buying a large
Does the sample support the hypothesized average?
At 95% level of confidence, this hypothesis is: NOT SUPPORTED
Copyright © 2012 Pearson Education, Inc. publishing as Prentice Hall
8
Variable Sample Average
Standard
Deviation
Lower
Boundary
Upper
Boundary
Probability of buying
a large size hybrid
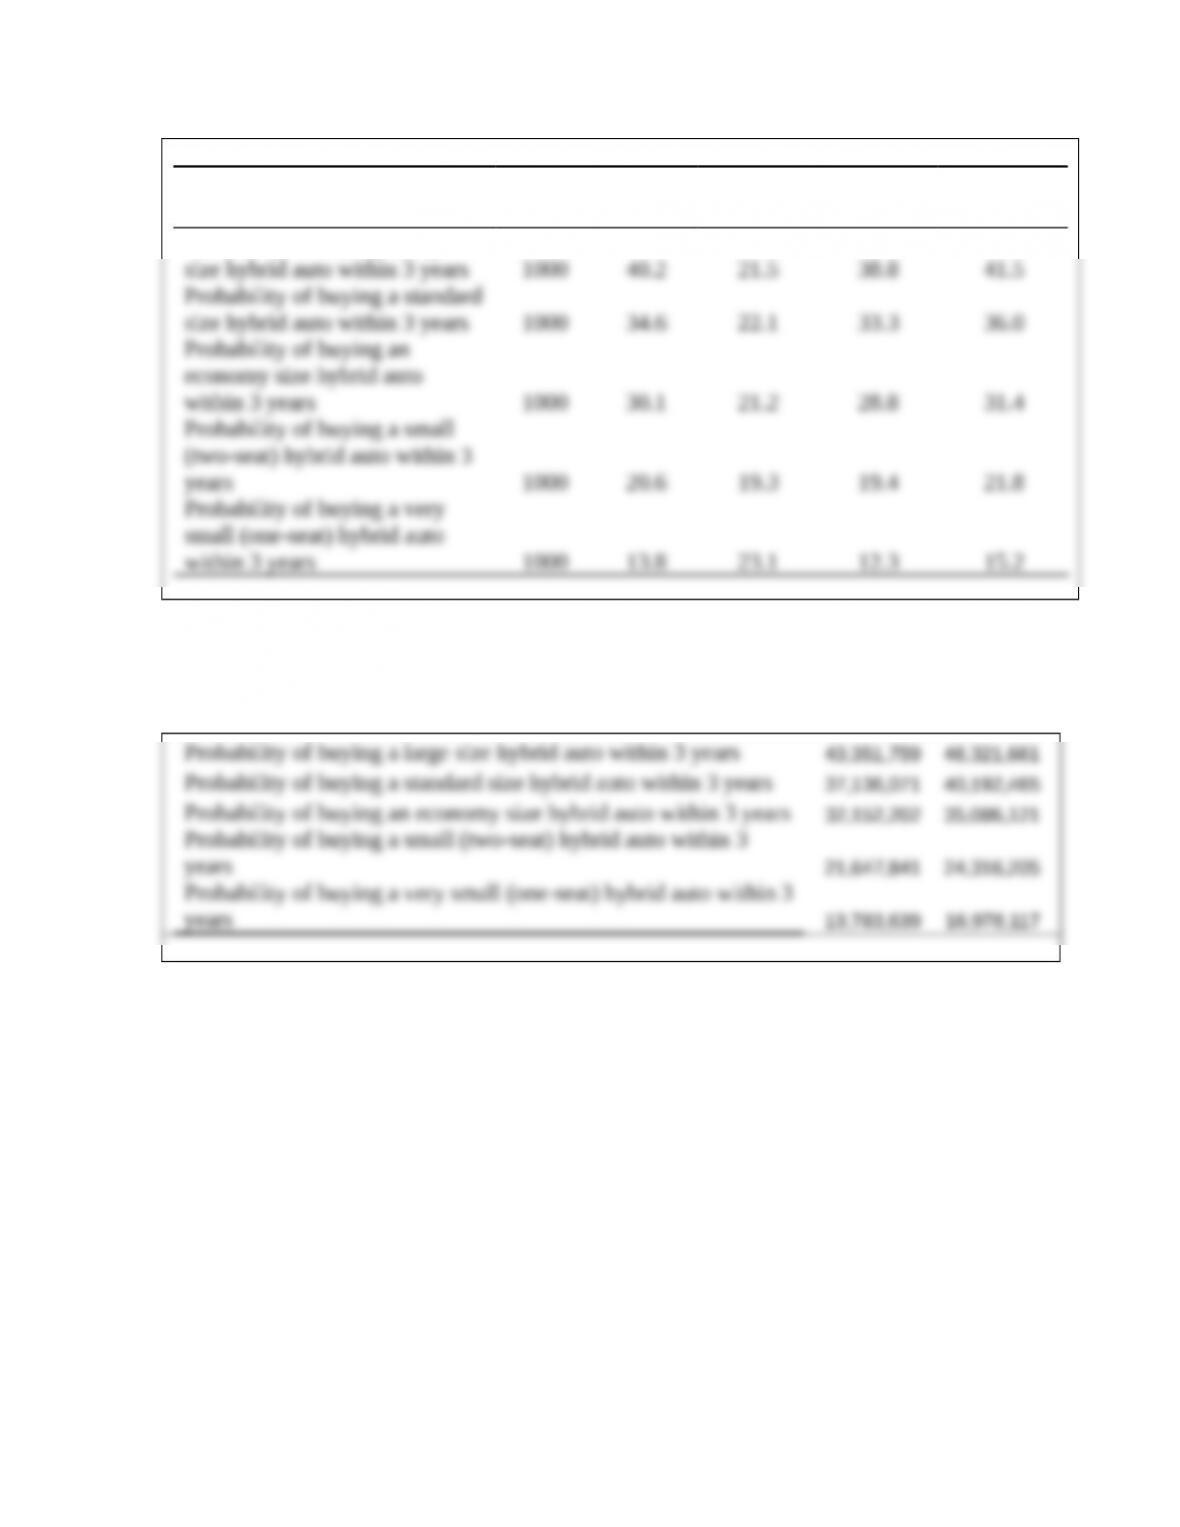
3. Using the finding from the survey, estimate the number of
vehicles of each of the following hybrid types that are expected to
be purchased over the next three years.
One must use the 95% confidence intervals for these averages to estimate the population
averages. The lower boundary percent times “There is an estimated 111,617,402
Copyright © 2012 Pearson Education, Inc. publishing as Prentice Hall
9
Variable Sample Average
Standard
Deviation
Lower
Boundary
Upper
Boundary
Probability of buying a large
The numbers of household estimates are as follows:
Copyright © 2012 Pearson Education, Inc. publishing as Prentice Hall
10