
ANSWERS TO REVIEW QUESTIONS
1. Distinguish between sample findings and population facts. How are they similar, and how
may they differ?
A sample finding is whenever a percentage, or an average, or some other analysis value is
computed with a sample’s data. However, because of the sample error involved, the sample
2. Define generalization, and provide an example of what you might generalize if you moved to
a new city and noticed that you were driving faster than most other drivers.
Generalization is the act of estimating a population fact from a sample finding.
With the driving example, your generalization would be based on observing that other drivers
3. What is a parameter, and what is parameter estimation?
The parameter is the actual population value being estimated (an average, or a percent).The
4. Describe how a confidence interval can be used by a researcher to estimate a population
percentage.
A confidence interval is a range (lower and upper boundary) into which the researcher
Formula for a population
percentage estimation
n
pxq
xzp
Where:
p = sample percentage
Copyright © 2012 Pearson Education, Inc. publishing as Prentice Hall
1
z
= z value for 95% or 99% level of confidence (α [alpha] equals either 95% or 99%
level of confidence)
6. Using the formula for a confidence interval for a percentage, indicate the role of:
Formula for a 95%
confidence interval for a
percentage
n
pxq
xp
szp
p
96.1
p is the sample finding
pxq is the variability
n is the sample size
One begins the estimation process with the sample percent, p. The variability is computed by
the product of p times q, so highly variability (e.g., 50×50) increases this product, while low
7. Indicate how a researcher interprets a 95% confidence interval. Refer to the sampling
distribution in your explanation.
The interpretation is based on the normal curve or bell-shaped distribution. The standard
error is a measure of the variability in a population based on the variability found in the
sample. If you theoretically took many, many samples and plotted the sample percentage, p,
8. In the case of a standard error of the average, indicate how it is affected by the following:
a. Standard deviation
Copyright © 2012 Pearson Education, Inc. publishing as Prentice Hall
2
b. Sample size
The standard error of the average is calculated by dividing the standard deviation by the
9. What is a hypothesis and what is the purpose of a hypothesis test? With a hypothesis test
what is the null hypothesis?
A hypothesis is when one makes a statement about the population parameter based on prior
knowledge, assumptions, or intuition. This statement most commonly takes the form of an
exact specification as to what the population value is. A hypothesis test is a statistical
10. How does statistical hypothesis testing differ from intuitive hypothesis testing? How are they
similar?
Intuitive hypothesistesting (as opposed to statistical hypothesis testing) is when someone
11.When performing a hypothesis test, what critical value of z is the most commonly used one,
and to what level of significance does it pertain?
12.When the person who posited a hypothesis argues against the researcher who has performed
the hypothesis test and not supported it, who should win the argument and why?
13.Using a bell-shaped curve, show the acceptance (supported) and rejection (not supported)
regions for the following levels of confidence.
For a., the acceptance level is 95% of the bell-shaped curve (centered over the apex of the
curve), while the rejection region is the 2.5% to the left and to the right of the 95%
Copyright © 2012 Pearson Education, Inc. publishing as Prentice Hall
3
14. How does a directional hypothesis differ from a nondirectional one, and what are the two
critical items to take into account when testing a directional hypothesis?
A directional hypothesis is one that indicates the direction in which you believe the
population parameter falls relative to some hypothesized average or percentage. When testing
a directional (greater than or less than) hypothesis, the critical z value is adjusted downward
ANSWERS TO APPLICATION QUESTIONS
15. Here are several computation practice exercises in which you must identify which
formula should be used and to apply it. In each case, after you perform the necessary
calculations, write your answers in the blank column.
a. Determine confidence intervals for each of the following:
Mean of 150, stdev. of 30, n of 200, level of 95%—
use average confidence interval
Percent of 67%, n of 300, level of 99%—use percentage formula
Copyright © 2012 Pearson Education, Inc. publishing as Prentice Hall
2.1548.14 5
2.4150
200
30
96.1150
x
0.740.60
0.767
300
)33)(67(
58.267
x

Mean of 5.4, stdev. of 0.5, n of 250, level of 99%—use average formula
Percent of 25.8%, n of 500, level of 99%—use percentage formula
b. Test the following hypothesis and interpret your findings.
Hypothesis: mean=7.5, mean of 8.5, s.d. of 1.2, n of 670, level of 95%
The hypothesis is not supported.
Hypothesis: percent=86%, p of 95%, n of 1,000, level of 99%
Copyright © 2012 Pearson Education, Inc. publishing as Prentice Hall
5
4 8.532.5
08.4.5
250
5.0
58.24.5
x
9.307.20
1.58.25
500
)2.74)(8.25(
58.28.25
x
20
05.
0.1
670
2.1
5.75.8
z
85.12
7.
9
1000
595
8695
z
The hypothesis is not supported.
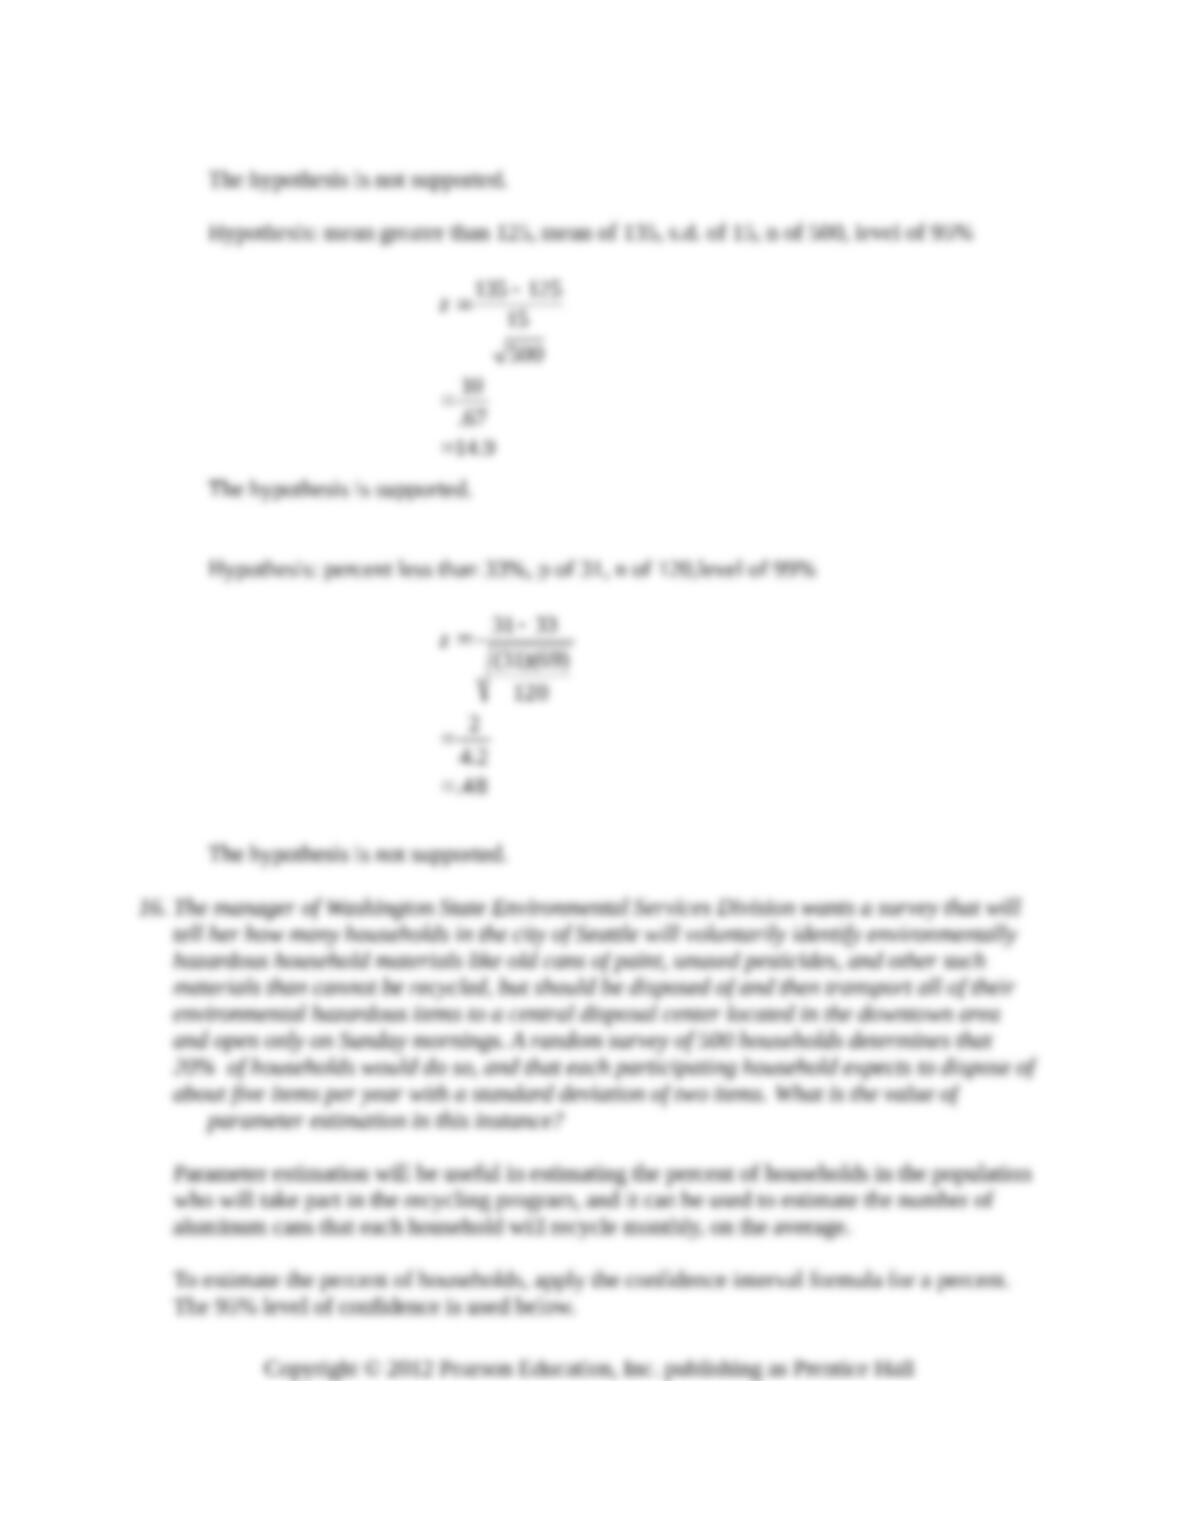
Hypothesis: mean greater than 125, mean of 135, s.d. of 15, n of 500, level of 95%
The hypothesis is supported.
Hypothesis: percent less than 33%, p of 31, n of 120,level of 99%
The hypothesis is not supported.
16. The manager of Washington State Environmental Services Division wants a survey that will
tell her how many households in the city of Seattle will voluntarily identify environmentally
hazardous household materials like old cans of paint, unused pesticides, and other such
materials than cannot be recycled, but should be disposed of and then transport all of their
environmental hazardous items to a central disposal center located in the downtown area
and open only on Sunday mornings. A random survey of 500 households determines that
20% of households would do so, and that each participating household expects to dispose of
about five items per year with a standard deviation of two items. What is the value of
parameter estimation in this instance?
Parameter estimation will be useful in estimating the percent of households in the population
who will take part in the recycling program, and it can be used to estimate the number of
aluminum cans that each household will recycle monthly, on the average.
To estimate the percent of households, apply the confidence interval formula for a percent.
The 95% level of confidence is used below.
Copyright © 2012 Pearson Education, Inc. publishing as Prentice Hall
6
9.14
67.
10
500
15
125135
z
48.
2.4
2
120
)69)(31(
3331
z
To estimate the number of cans, apply the confidence interval formula for a mean. Note,
26.3% – 13.7%
6.3 20
3.2 x 1.96 20
500
20×80
x 1.96 20
n
pxq
x 1.96 p
s
x 1.96 p
p
5.9 100
3 x 1.96 100
100
30
x 1.96 100
s
x 1.96 x
x

17. It is reported in the newspaper that a survey sponsored by Forbes magazine with 200
Fortune 500 company top executives has found that 75% believe that the United States trails
Japan and Germany in automobile engineering. What percent of all Fortune 500 company
top executives believe that the United States trails Japan and Germany?
18.Alamo Rent-A-Car executives believe that Alamo accounts for about 50% of all Cadillacs
that are rented. To test this belief, a researcher randomly identifies twenty major airports
with on-site rental car lots. Observers are sent to each location and instructed to record the
number of rental company Cadillacs observed in a four–hour period. About 500 are
observed, and 30% are observed being returned to Alamo Rent-A-Car. What are the
implications of this finding for the Alamo executives’ belief?
Copyright © 2012 Pearson Education, Inc. publishing as Prentice Hall
8
% – %
6.
3. x 1.96
00
x
x 1.96
n
pxq
x 1.96 p
s
x 1.96 p
p
2.819.68
175
175
2
2575
75

A computed z of -9.76 does not support the hypothesis.
Copyright © 2012 Pearson Education, Inc. publishing as Prentice Hall
9
9.76- =
4.2
20–
=
500
2100
20–
=
500
30×70
50-30
=
n
pq
-p
=
s
-p
=z
H
p
H