CASE SOLUTIONS
Case 11.1The Prospective New Restaurant Survey
Case Objective: This case requires students to identify the correct type of
summarization, or descriptive, analysis based on a determination of
whether a variable is metric or categorical.
Answers to Case Questions
1. Assuming that the data set is comprised of only respondents who answered “Yes” to
question 1, indicate those variables where missing data would be found even if every
respondent answered every question he or she is supposed to answer.
The only missing data in this instance would be where respondents were directed to
“skip” or not answer questions because they are not appropriate.
1. Determine what variables are categorical and indicate the appropriate
summarization analysis.
3. Determine what variables are metric scales and indicate appropriate summarization
analysis.
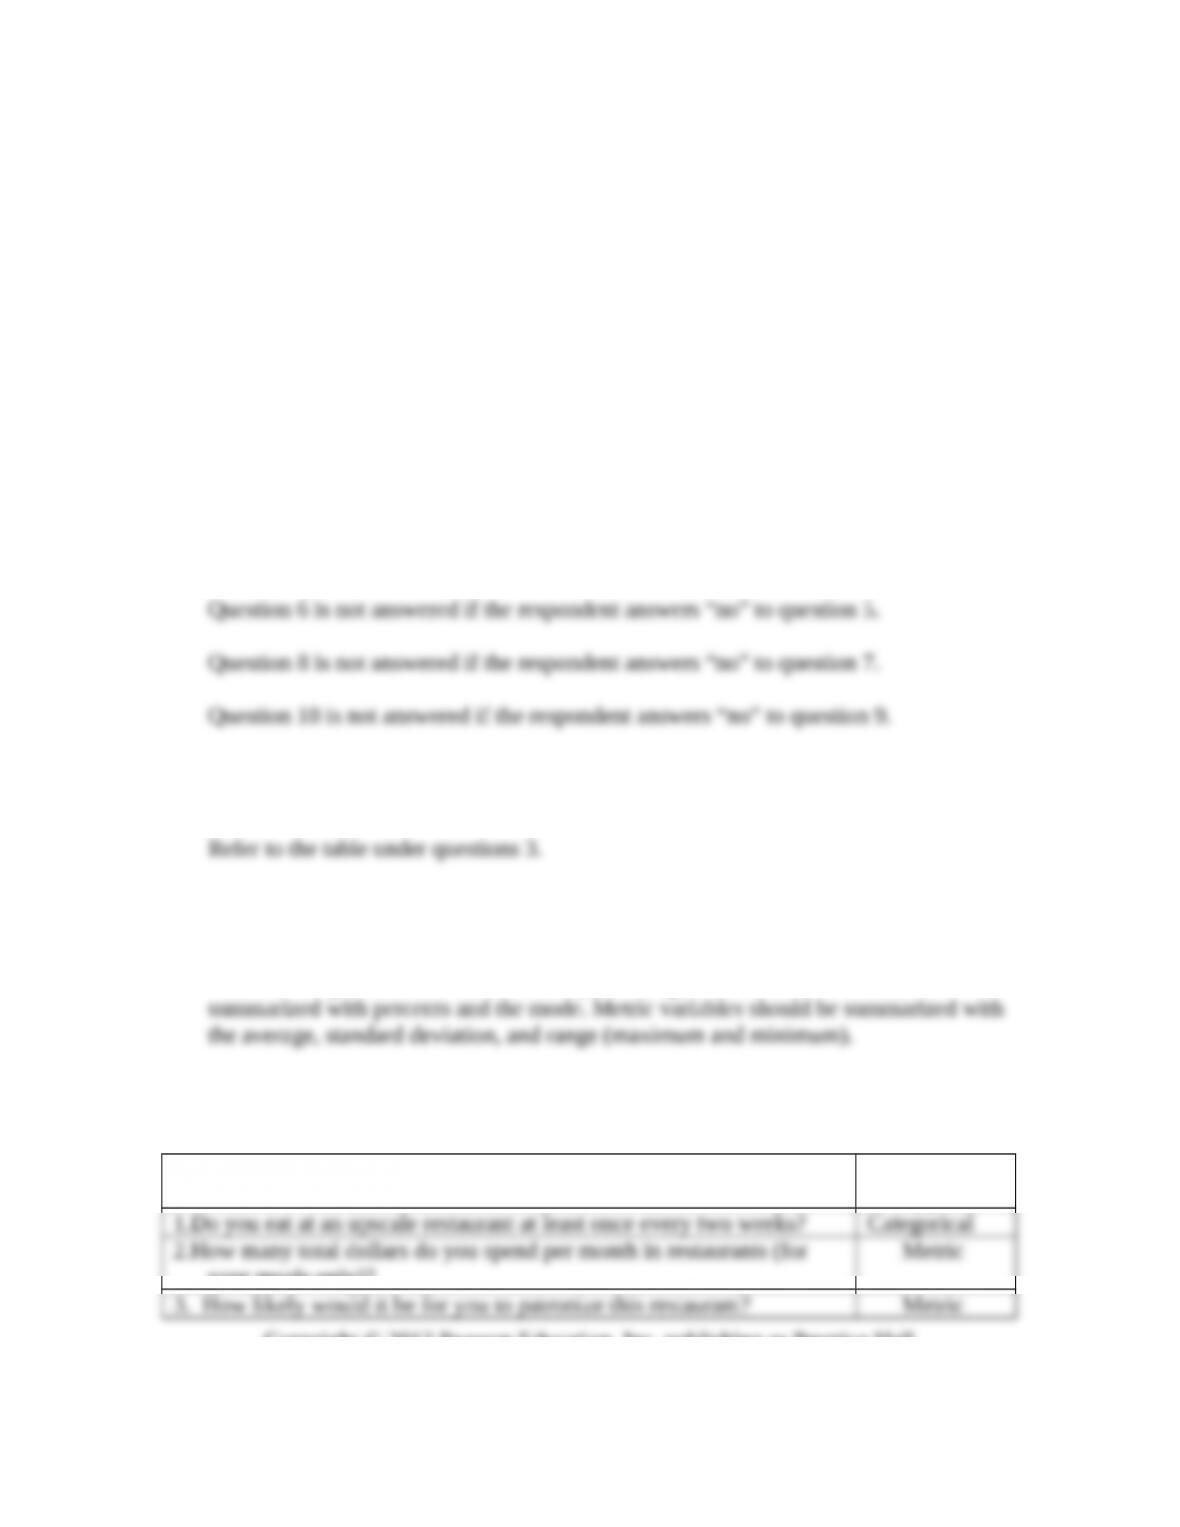
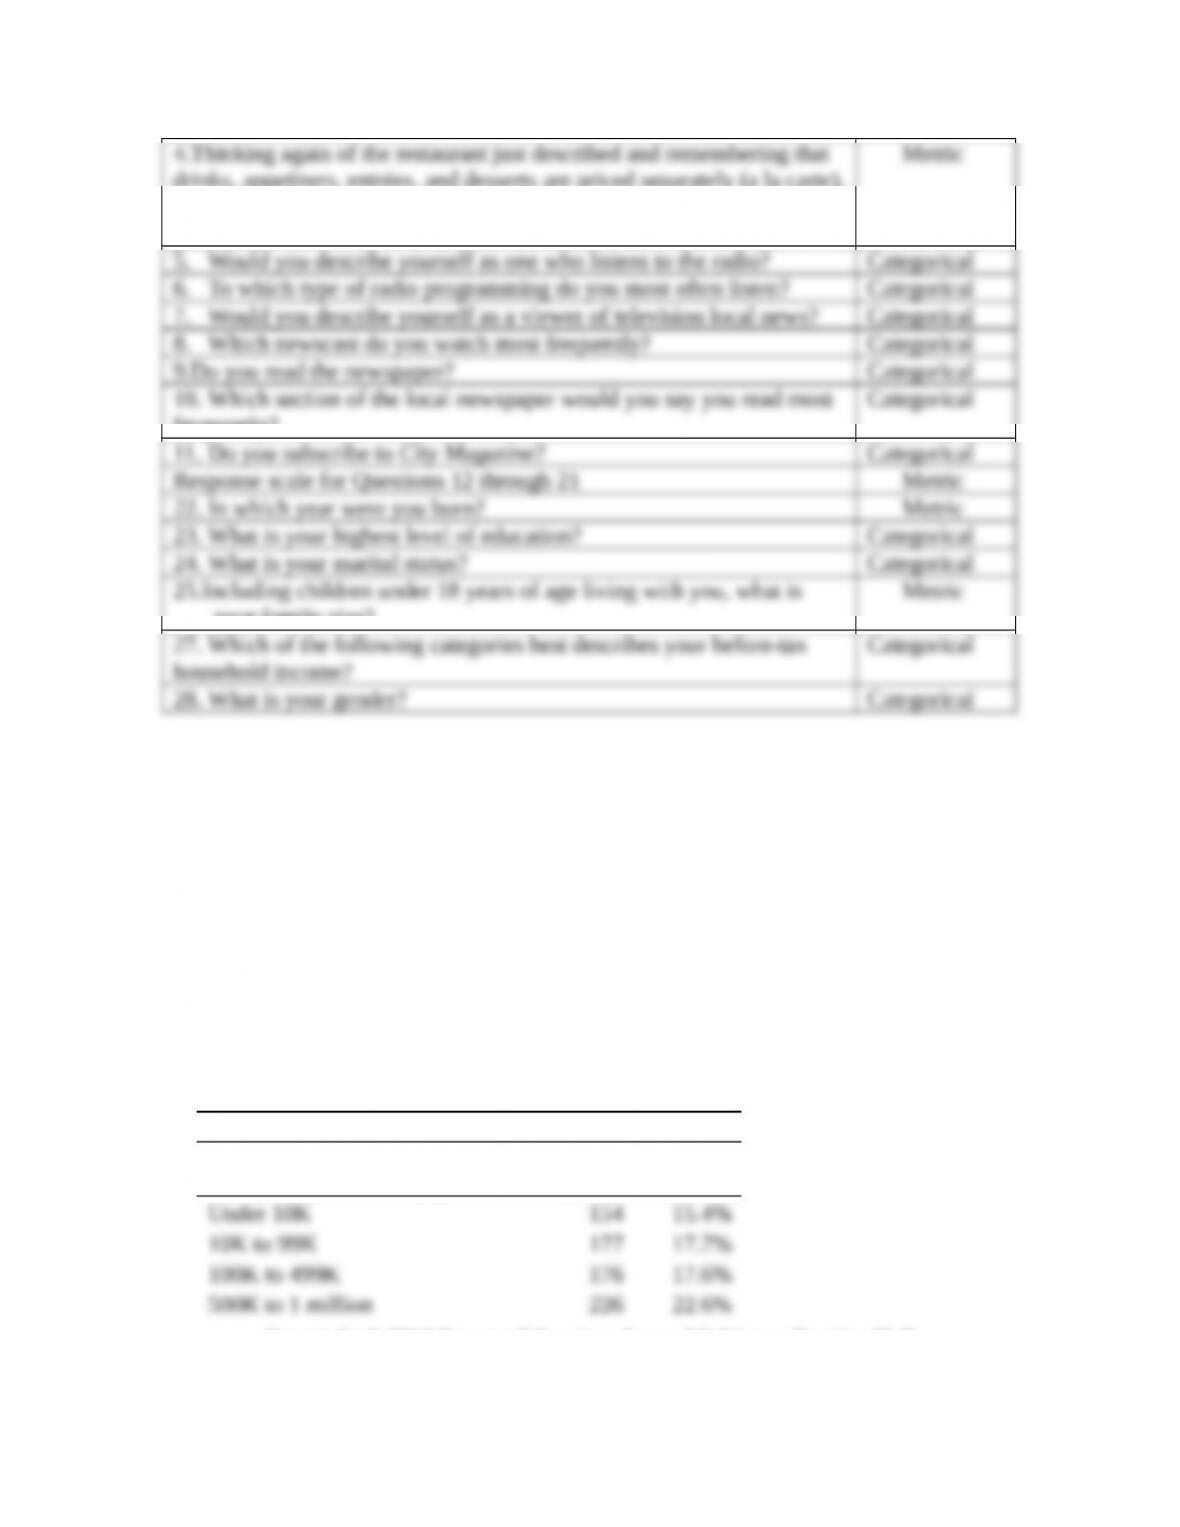
The following table identifies the scale type. Categorical variables should be
The answer is provided below each variable in the following table:
Question
Scale
Type
Copyright © 2012 Pearson Education, Inc. publishing as Prentice Hall
171
your family size?
Case 11.2 Integrated Case: Advanced Automobile Concepts Summarization Analysis
Case Objective: This is the first analysis case using the integrated case. Students will
need to learn how to use and interpret the XL Data Analyst’s
summarization analyses applied to the Advanced Automobile Concepts
survey dataset provided with the textbook. Pie charts are not provided
here to conserve space.
Answers to Case Questions
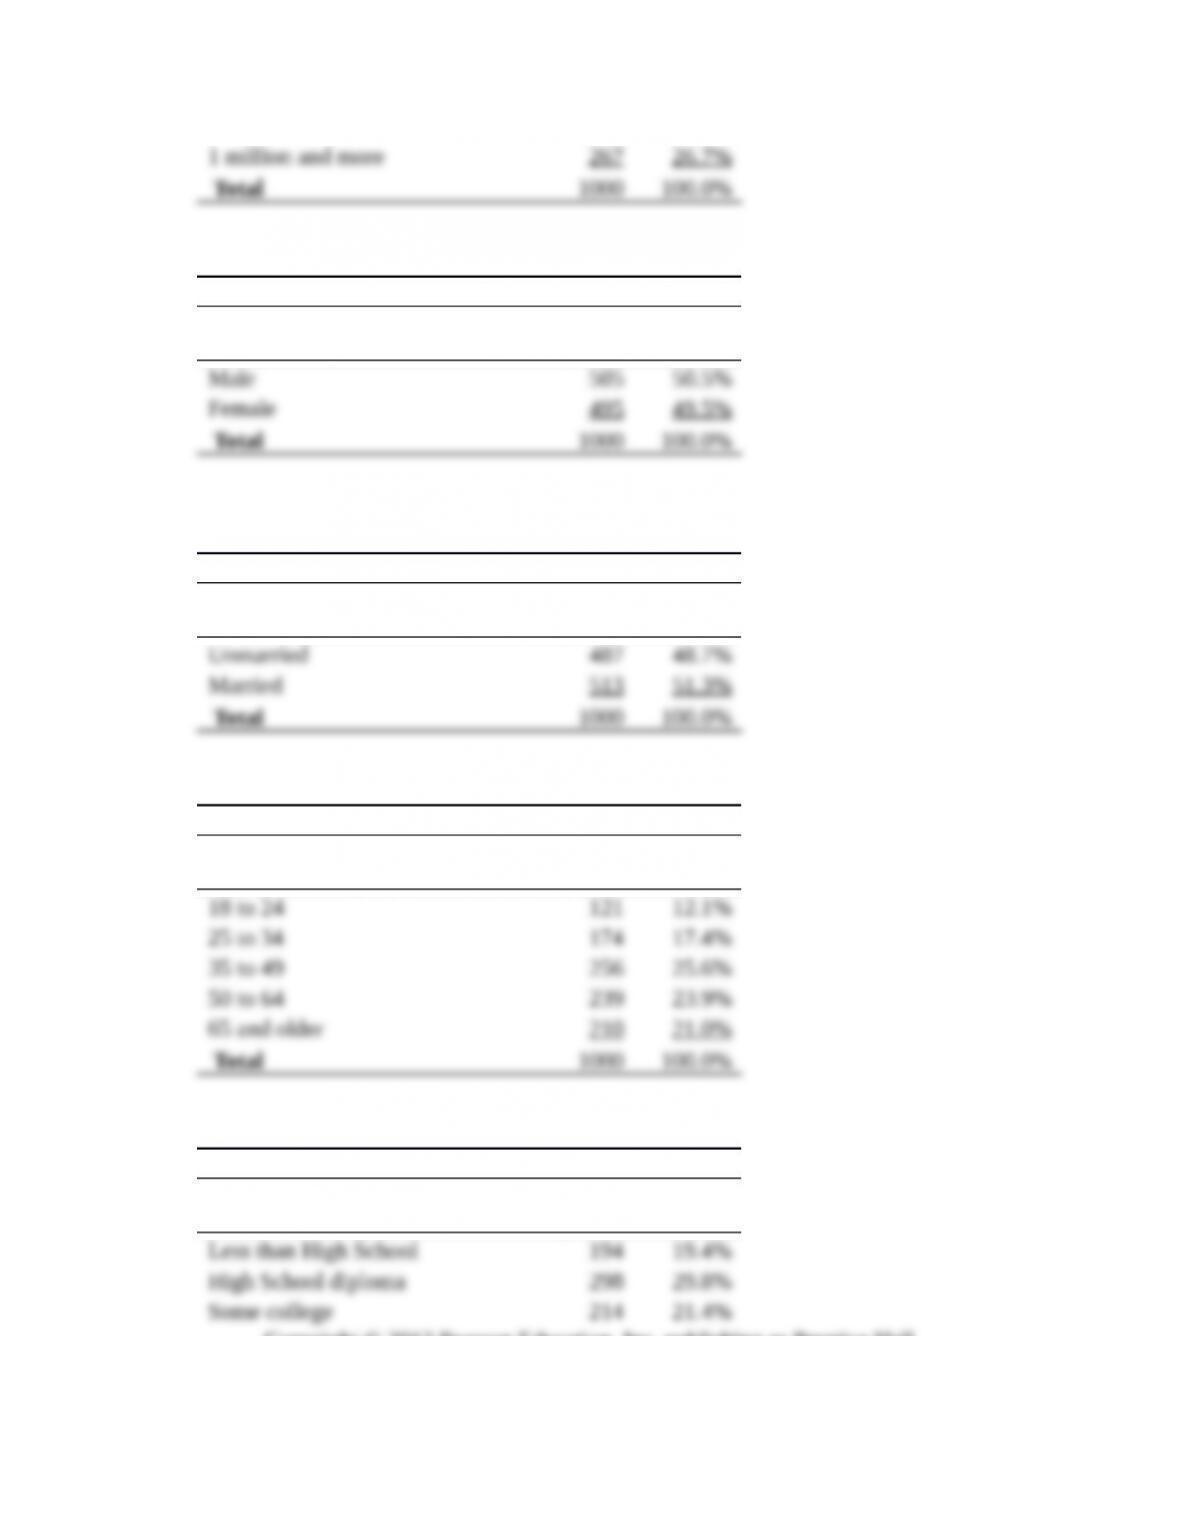
1. What is the demographic composition of the sample?
All demographic variables, except for number of people in the household, are
categorical, so use percents.
Size of home town or city
Category
Frequenc
y Percent
Copyright © 2012 Pearson Education, Inc. publishing as Prentice Hall
172
Gender
Category
Frequenc
y Percent
Age category
Category
Frequenc
y Percent
Level of education
Category
Frequenc
y Percent
Copyright © 2012 Pearson Education, Inc. publishing as Prentice Hall
173
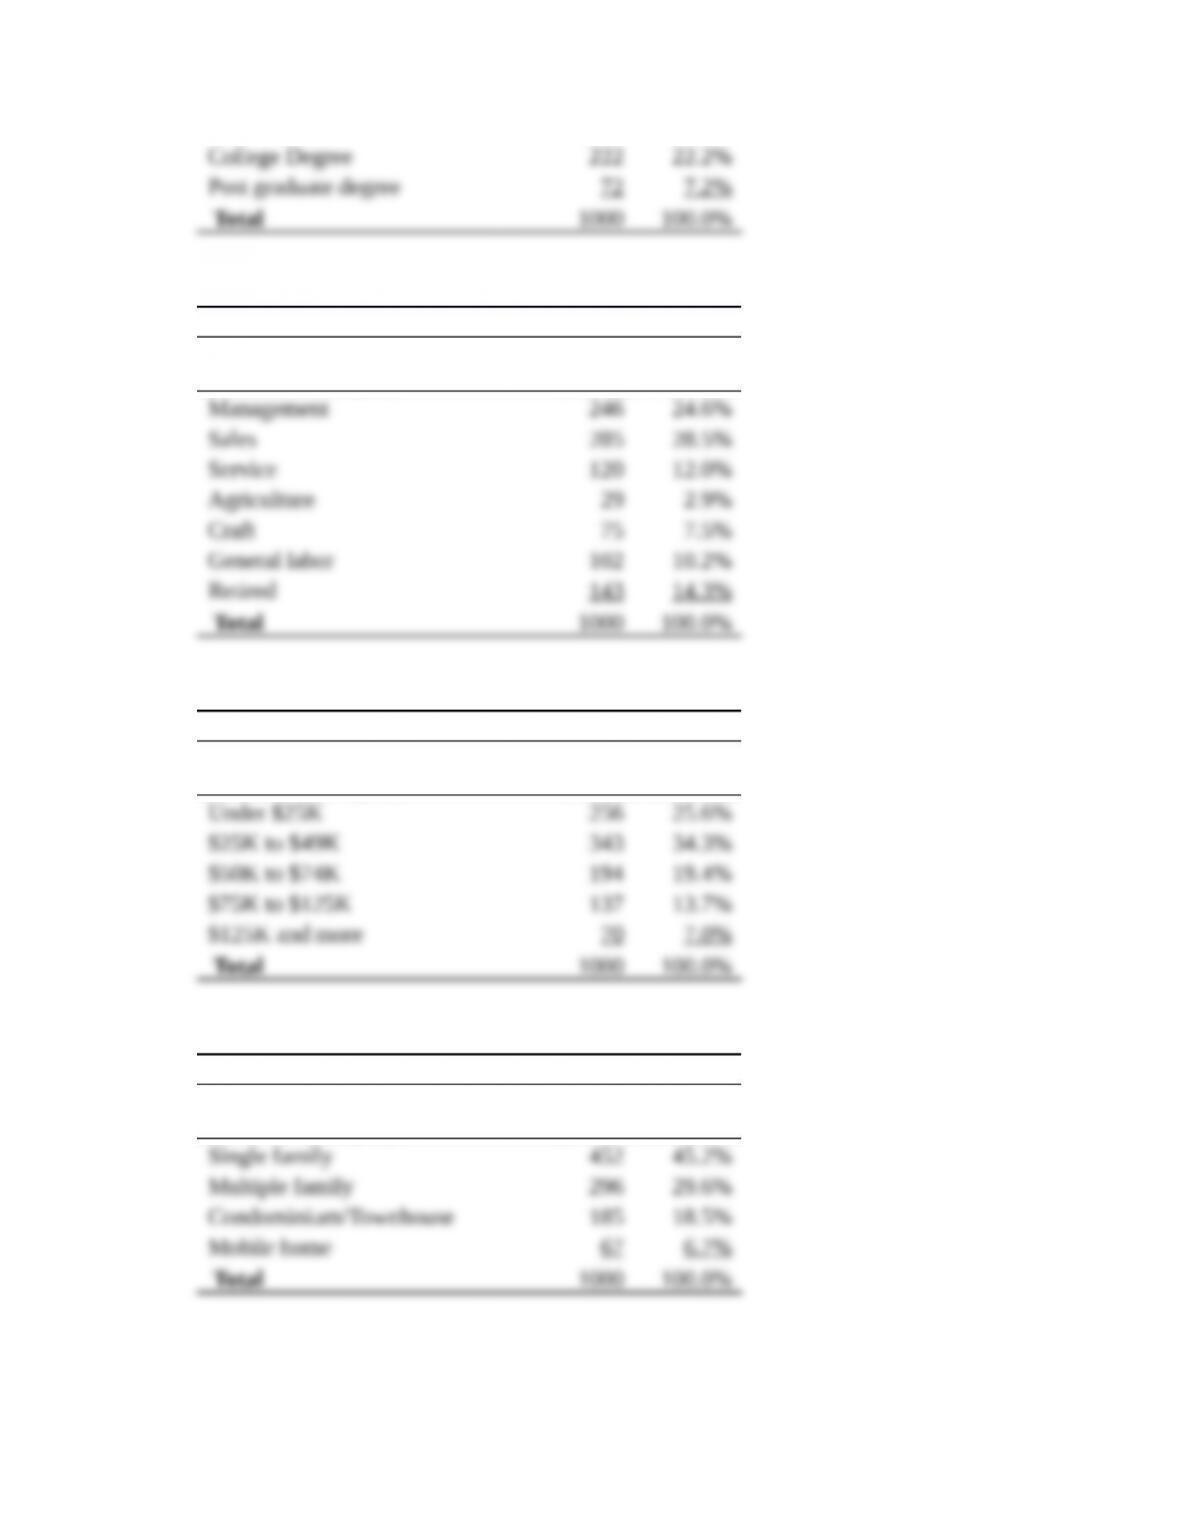
Job category
Category
Frequenc
y Percent
Income category
Category
Frequenc
y Percent
Dwelling type
Category
Frequenc
y Percent
Copyright © 2012 Pearson Education, Inc. publishing as Prentice Hall
174
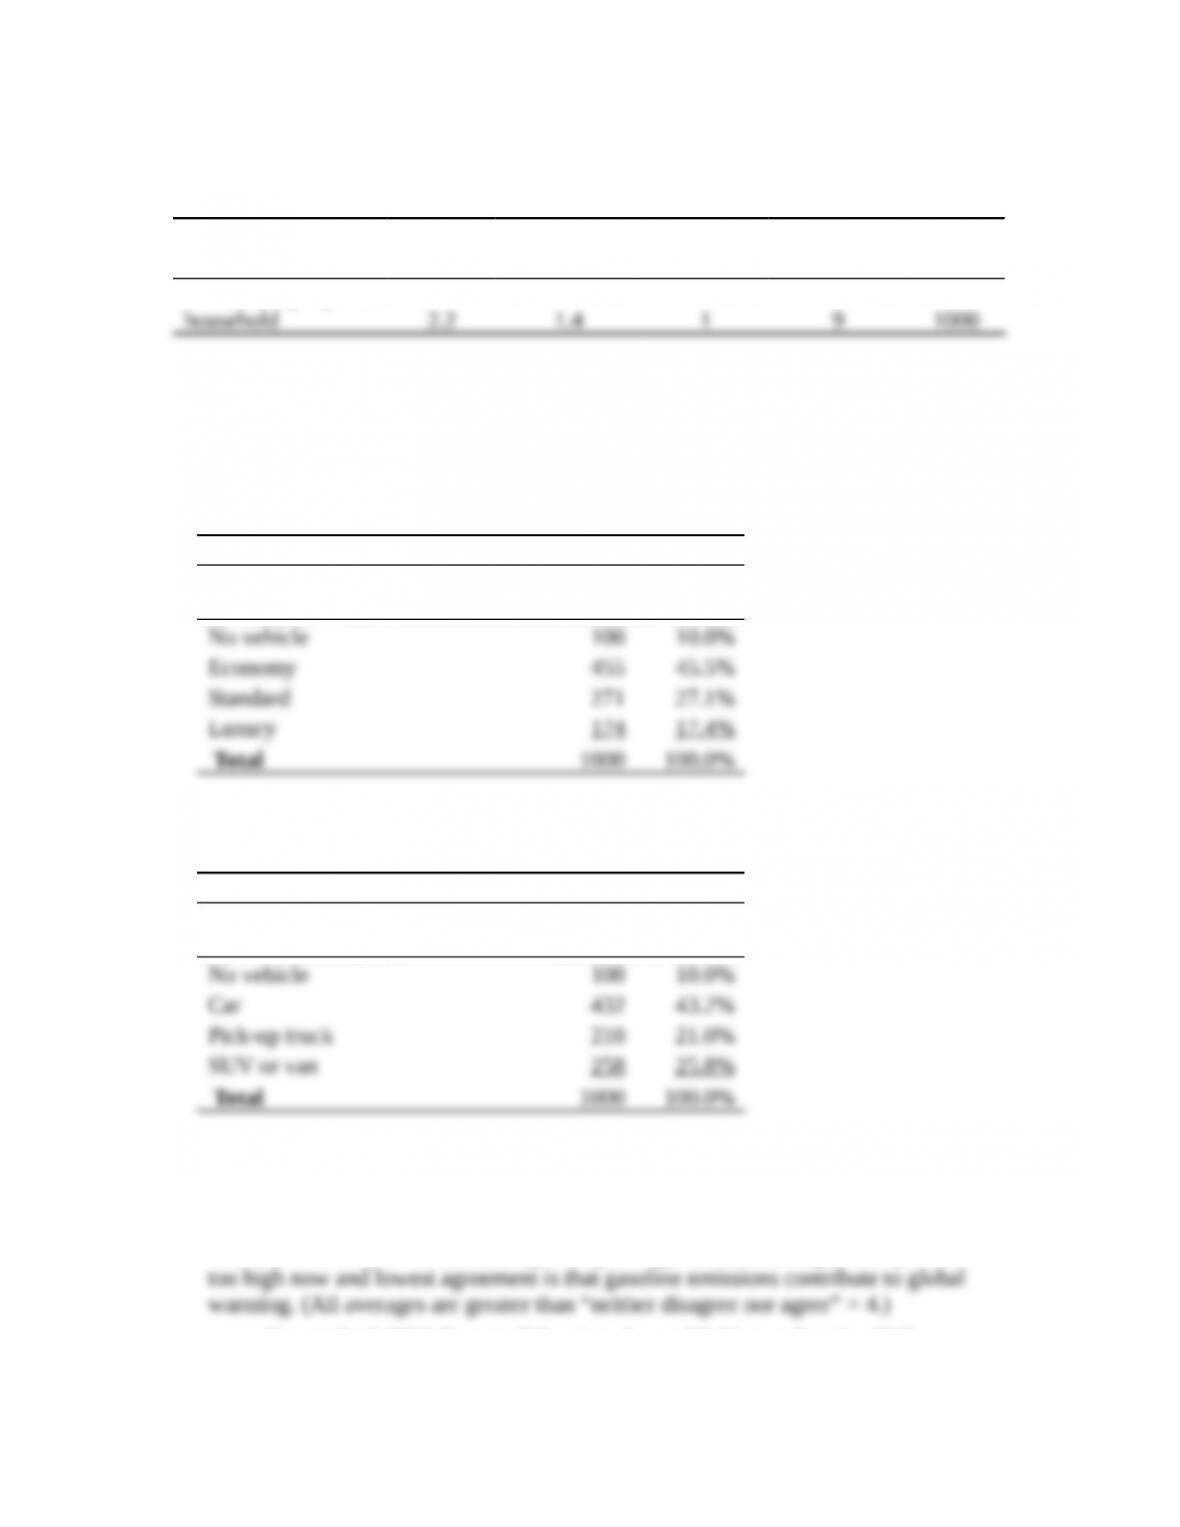
The typical household has about two members.
Variable Average
Standard
Deviation Minimum Maximum Sample
Number of people in
2. What is the automobile ownership profile of respondents in the survey?
The automobile ownership variables are categorical, so use percents. The modes are:
economy price range and car.
Primary vehicle price type
Category
Frequenc
y Percent
Primary vehicle type
Category
Frequenc
y Percent
3. How do respondents feel about (1) global warming and (2) the use of gasoline?
The scales are metric, so use averages. Highest agreement is that gasoline prices are
Copyright © 2012 Pearson Education, Inc. publishing as Prentice Hall
175
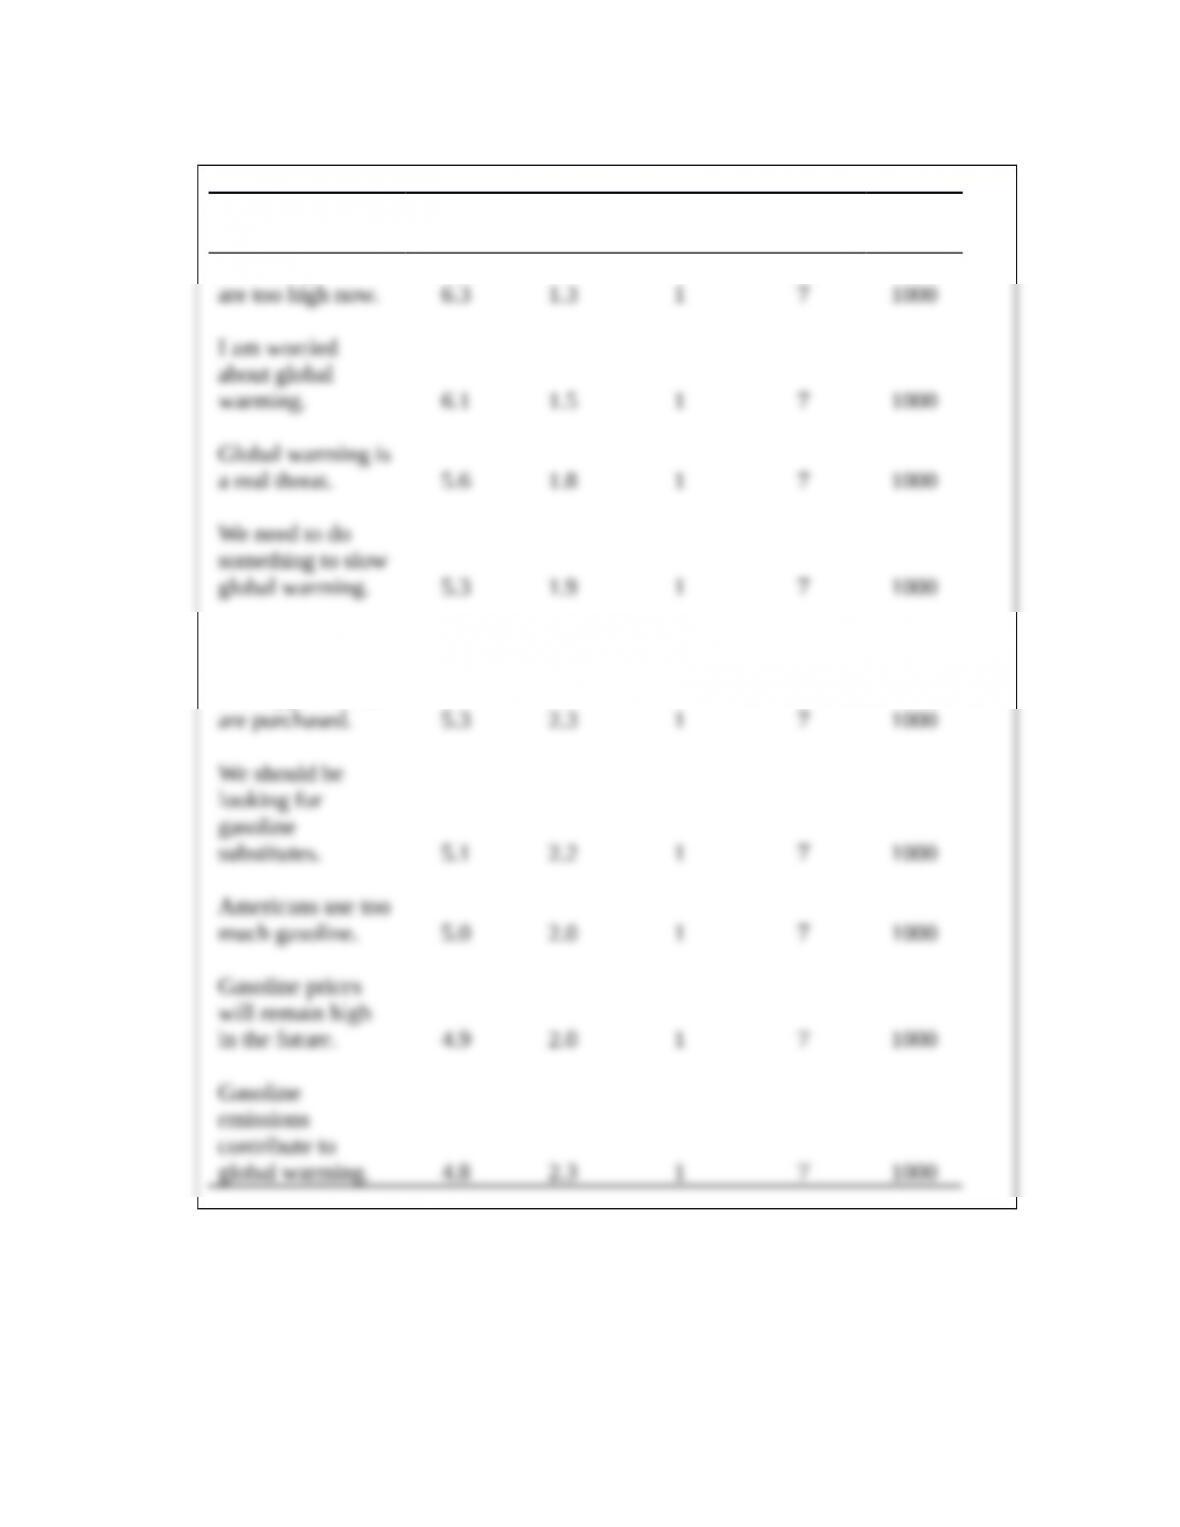
Variable Average
Standard
Deviation Minimum Maximum Sample
Gasoline prices
High gasoline
prices will impact
what type of autos
4. What are the respondents’ opinions about the effects of the use of various kinds of
hybrid vehicles?
Copyright © 2012 Pearson Education, Inc. publishing as Prentice Hall
176
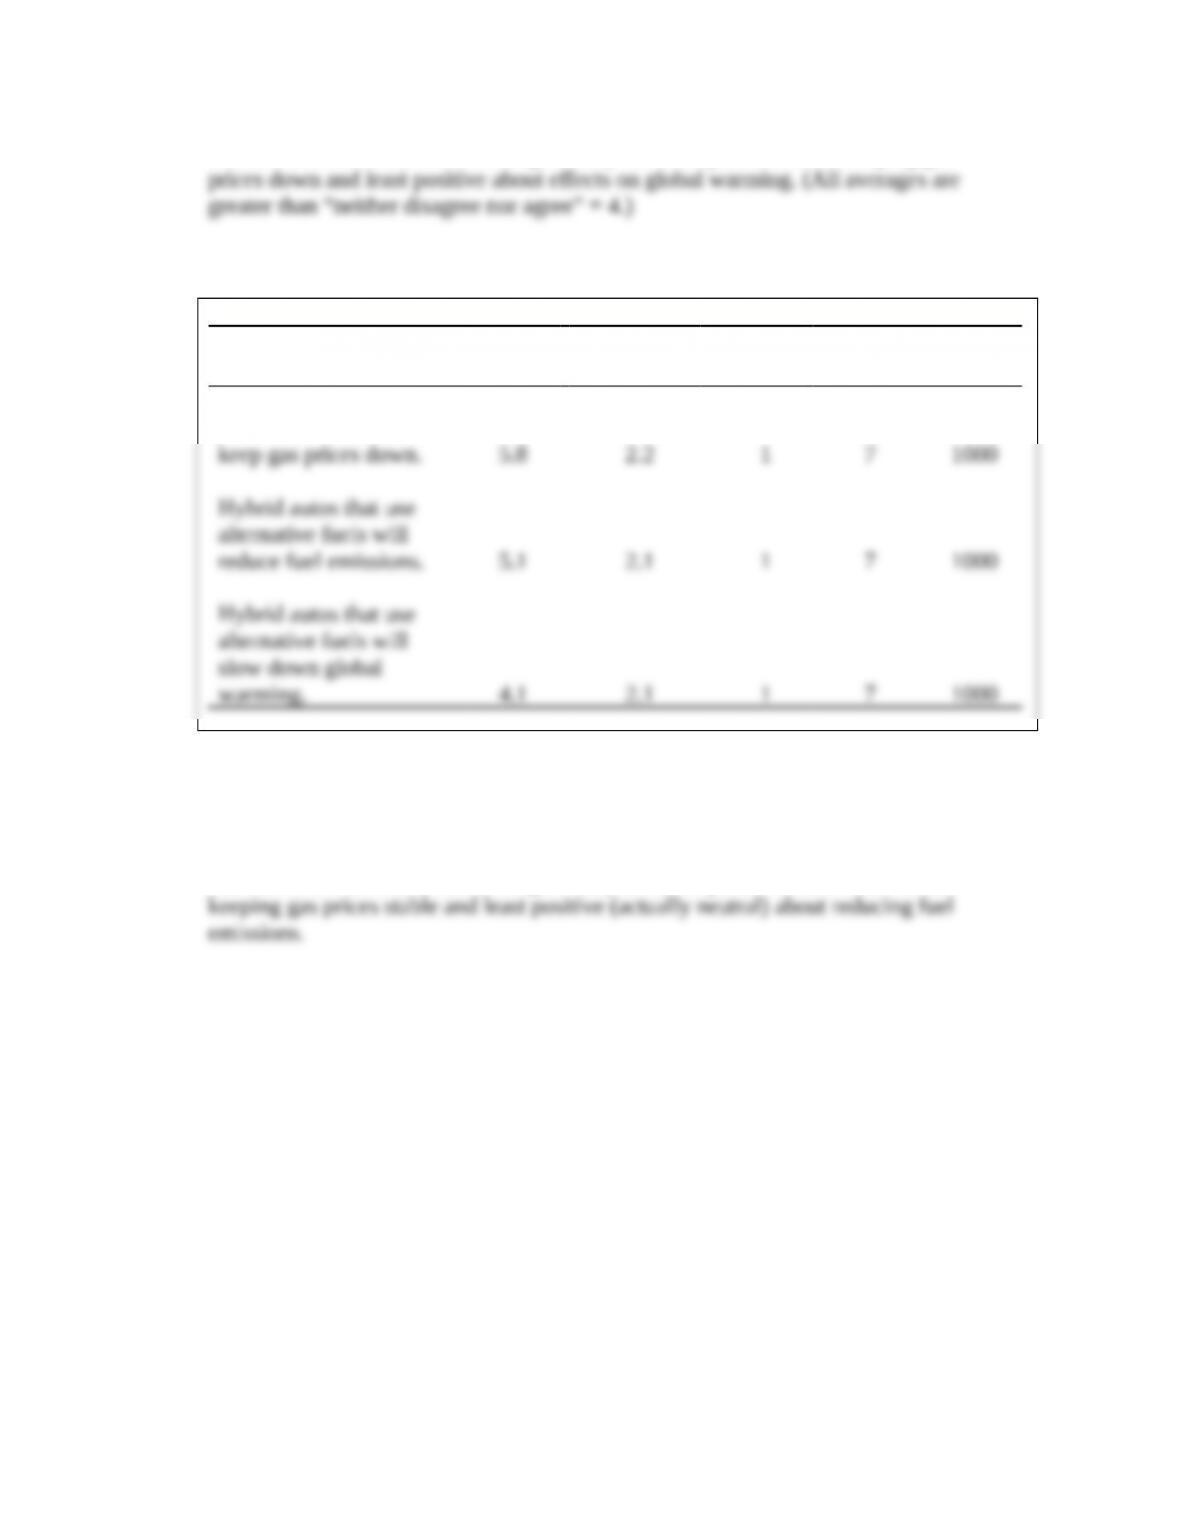
The scales are metric, so use averages. They are most positive about keeping gas
Variable Average
Standard
Deviation Minimum Maximum Sample
Hybrid autos that use
alternative fuels will
5. What size of “new” automobile (very small with very high mpg, small with high mpg,
and hybrid using alternative fuels) do people in the sample believe are likely to have
the most positive effects?
The scales are metric, so use averages. They are most positive about small autos
Copyright © 2012 Pearson Education, Inc. publishing as Prentice Hall
177
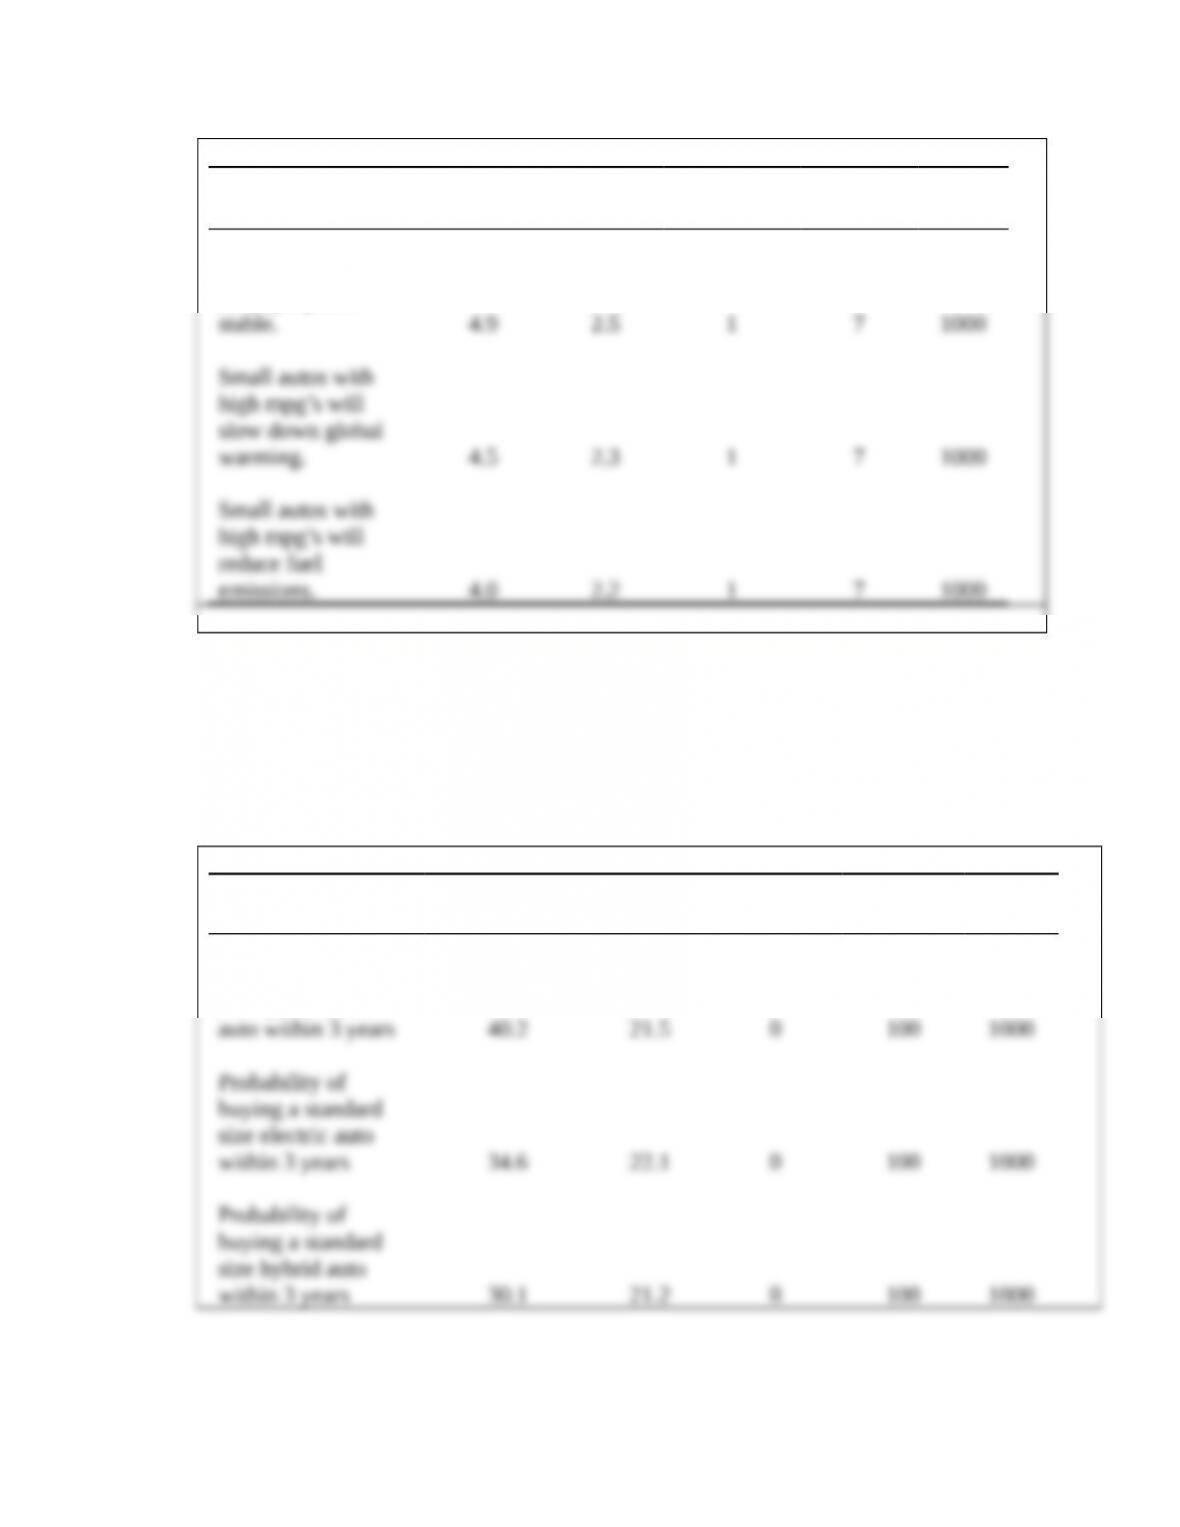
Variable Average
Standard
Deviation Minimum Maximum Sample
Small autos with
high mpg’s will
keep gas prices
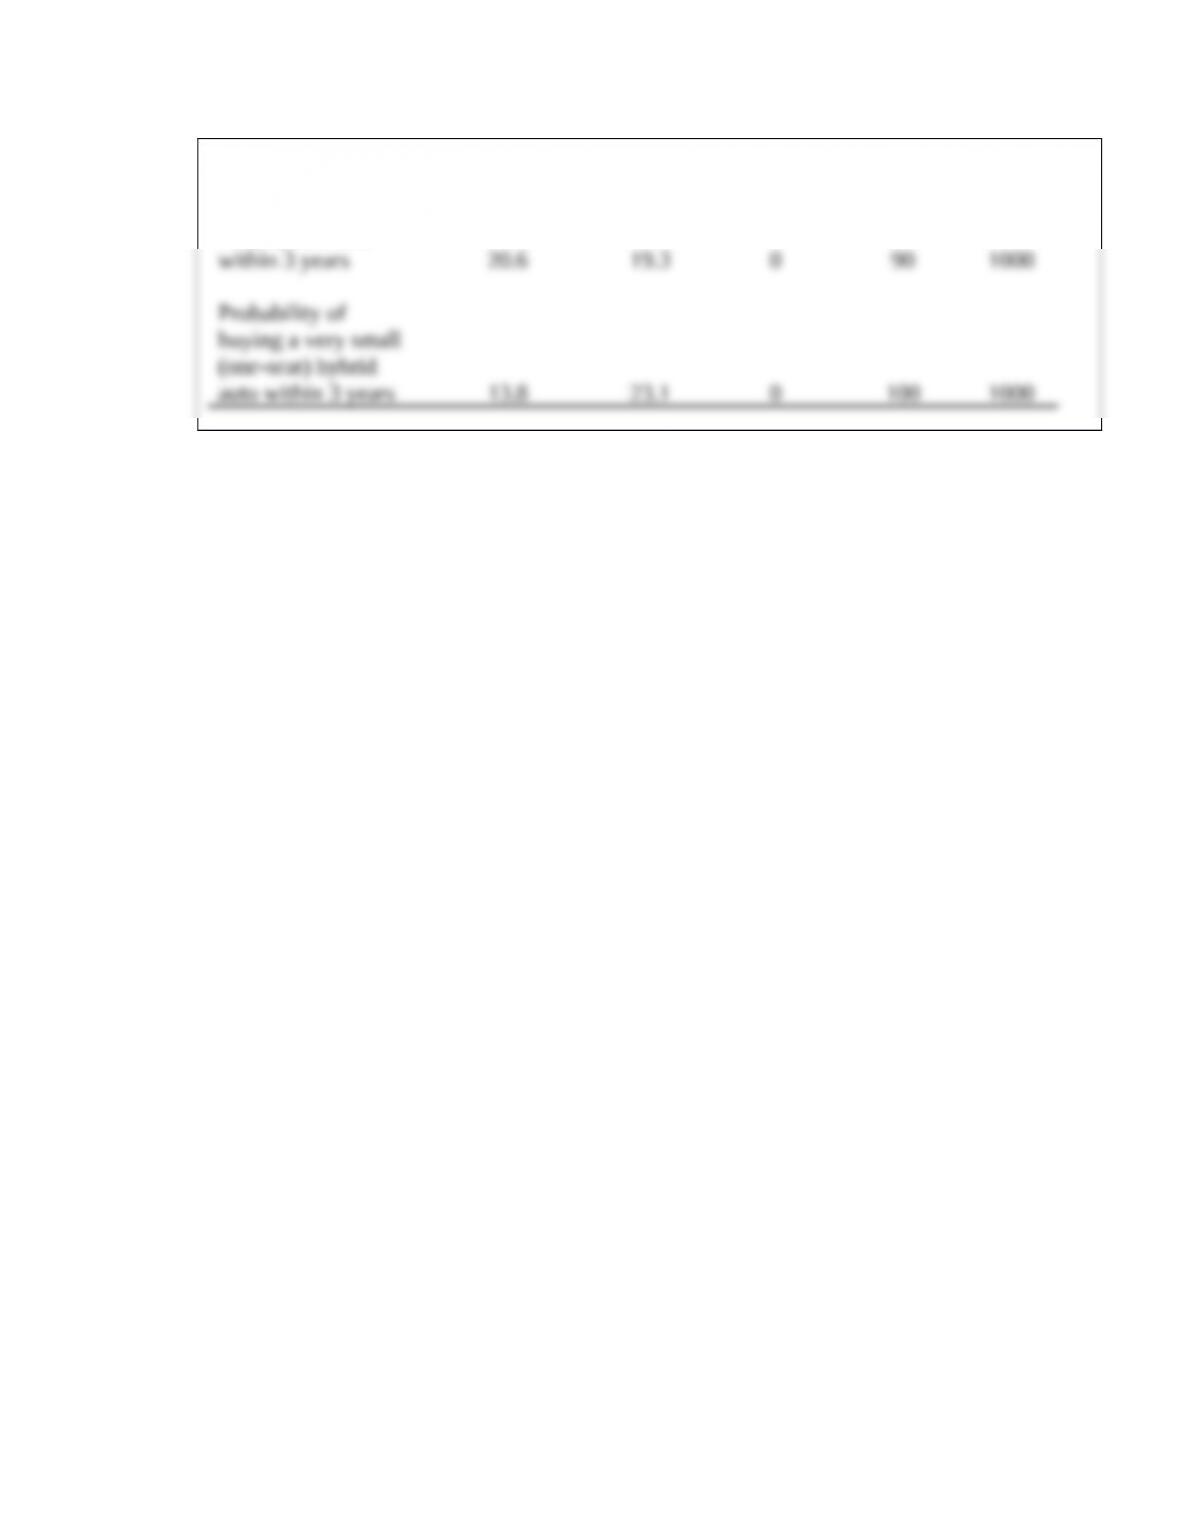
6. What type of hybrid automobile is the most attractive to people in the sample in terms
of likelihood of purchase in the next three years? What type is the least attractive?
Probabilities are metric, so use averages. The most probable/attractive model is the
standard sized synthetic fuel one, and the least probable/attractive model is the very
small (one-seat) hybrid one.
Variable Average
Standard
Deviation Minimum
Maximu
m
Sampl
e
Probability of
buying a standard
size synthetic fuel
Copyright © 2012 Pearson Education, Inc. publishing as Prentice Hall
178
Probability of
buying a small (two-
seat) hybrid auto
Copyright © 2012 Pearson Education, Inc. publishing as Prentice Hall
179