ANSWERS TO REVIEW QUESTIONS
1. What is data analysis?
2. Describe summarization analysis and provide an example.
Summarization analysis is describing the data in the sample with the use of percentages or
3. Describe generalization analysis and provide an example.
Generalization analysis means that the researcher conduct hypotheses tests and/or compute
confidence intervals in order to make statements about the population that the sample
4. Describe differences analysis and provide an example.
With differences analysis, the researcher identifies a categorical variable (such as gender)
5. Describe relationship analysis and provide an example.
Relationship analysis seeks to find useful connections or associations among two or more
variables under study. Using the American Express example, one could investigate if there is
6. With regard to complexity, how do the four types of data analysis compare?
7.With regard to value of the findings, how do the four types of data analysis compare?
8. What is meant by the term central tendency? Why is the central tendency an incomplete
summarization of a variable?
The typical response is referred to as the “central tendency,” and there are two measures of
9. When summarizing a categorical variable, what is the proper measure of central tendency,
and why is it the proper measure? What is the proper measure of variability and why?
The proper measure is the mode because with categorical variables, one should only count
the number of times (or percentage of times) that the category occurs. The proper variability
10. When summarizing a metric variable, what is the proper measure of central tendency, and
why is it the proper measure?
11. Describe how a percentage distribution is computed.
Frequencies themselves are raw counts, and these frequencies are easily converted into per-
centages for ease of comparison. The conversion is arrived at very simply through a quick
12. When summarizing a metric variable, what is the most informative measure of variability,
and why is it the most informative measure?
The most informative measure is the standard deviation (as opposed to the range—minimum
and maximum) because the standard deviation is computed by explicitly comparing every
13. Describe how a standard deviation is computed.
The standard deviation indicates the degree variability in the metric values in such a way as
to be translatable into a normal or bell-shaped curve distribution. Calculate the average, then
14. With reference to the formula, show how the standard deviation takes into account the
typicality of every respondent.
Every respondent’s value is compared (subtracted) to the mean, so every respondent’s
15. What is the relationship between a standard deviation and a normal curve?
The relationship is described below.
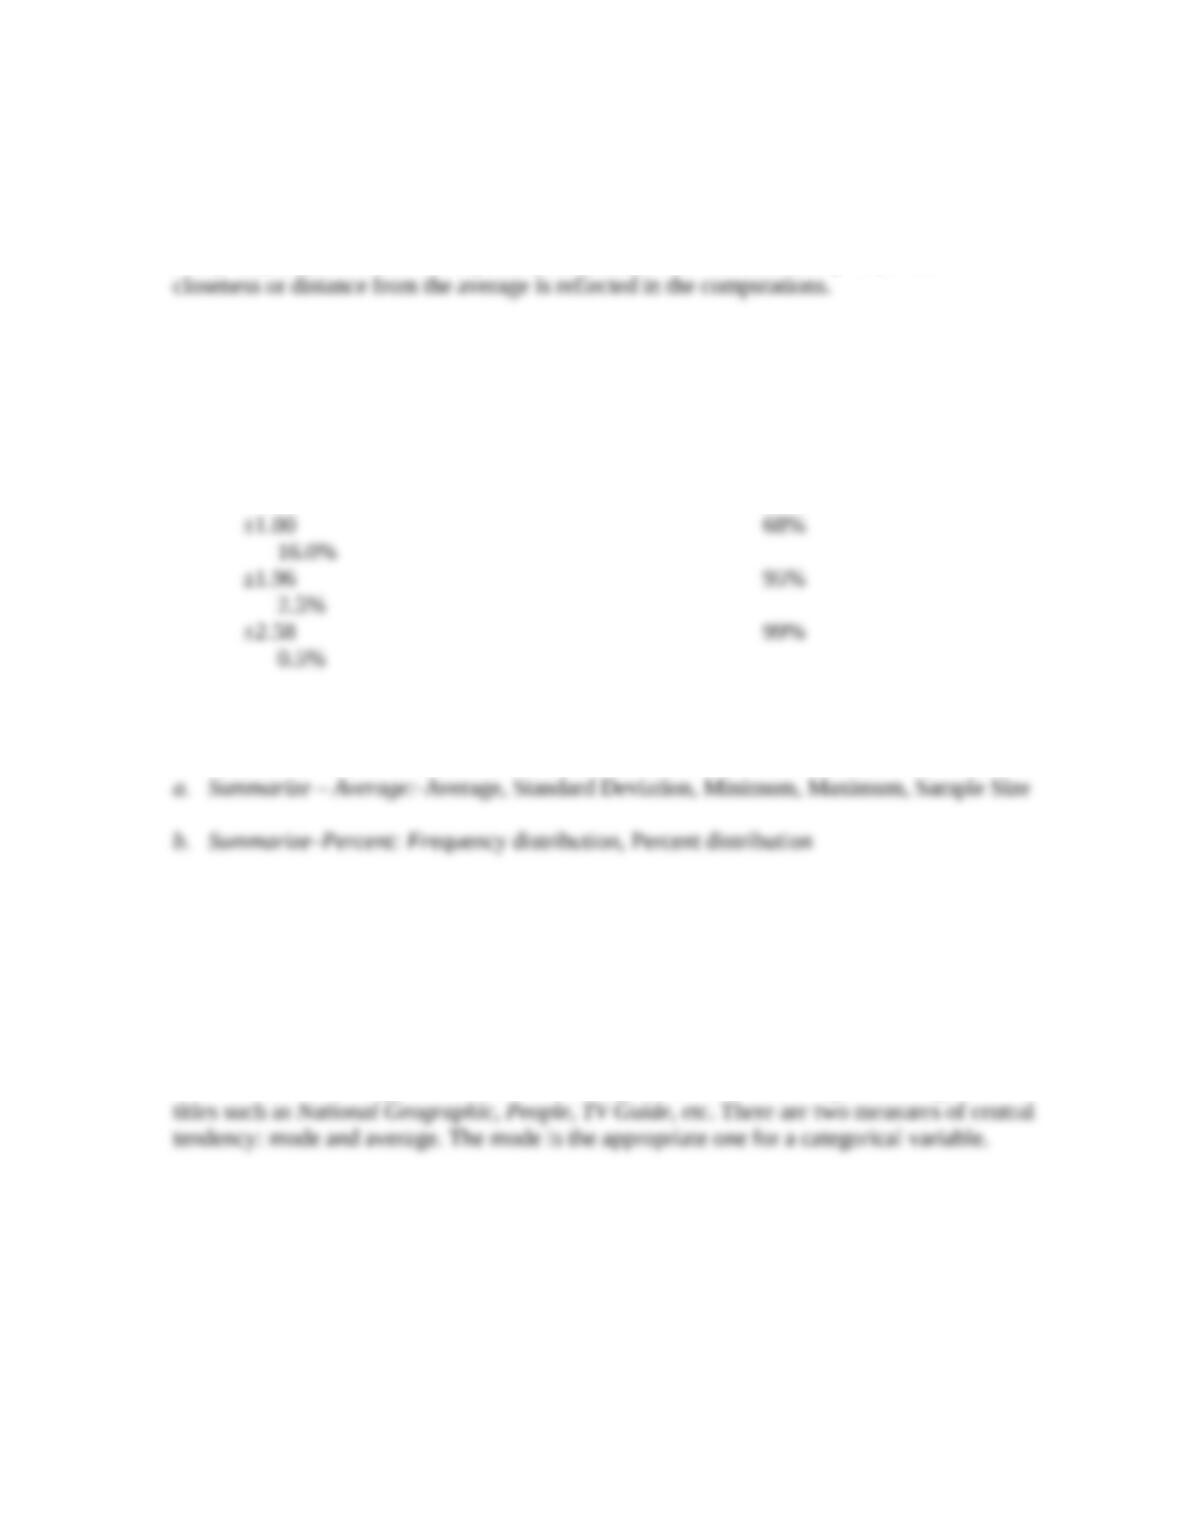
Number of Standard Percent of Area Percent of Area
Deviations from the Mean Under Curve to Right (Or Left)
16. What output is generated by the XL Data Analyst with the following types?
ANSWERS TO APPLICATION QUESTIONS
17.In a survey on magazine subscriptions, respondents write in the names of magazines they
subscribe to regularly. What measures of central tendency can be used? Which is the most
appropriate and why?
This is a case of a categorical variable as the respondents will be writing down magazine
18. A manager has commissioned research on a special marketing problem. He is scheduled to
brief the board of directors on the problem’s resolution in video conference tomorrow
morning. The research director works late that night in the downtown San Francisco
headquarters and completes the summarization data analysis, which will be sufficient for the
presentation. However, less than an hour before the manager calls him for an early-morning
briefing on the survey’s basic findings. The researcher looks around in his office and an idea
flashes in his head. He immediately grabs a blank questionnaire. What is he about to do to
facilitate the quick communication of the study’s basic findings to the manager?
The researcher realizes that the manager can probably understand simple central tendency
concepts such as the mode and the average, plus a percentage distribution is readily
comprehended by most mangers. So, the researcher will compute and write in “average” with
19. A professor asks his students how many hours they studied for the last exam. He finds that
the class average is 10.5 hours and the standard deviation is 1.5 hours. The minimum is 2
hours, and the maximum is 20 hours. How would you describe the typical student’s study
time for this professor’s last exam?
One could use the standard deviation interpretation based on a normal curve that is provided
in Table 11.5
The average (10.5 hours) ±1 standard deviation (1.5 hours) pertains to 68 percent of the class,
and this is a range of 9 to 12 hours. Ninety-five percent of the students are ±1.96 times the
20. In a survey, Valentine’s Day rose buyers are asked to indicate what color of roses they
purchased for their special friends. The following table summarizes the findings.
What color roses did you purchase last
Valentine’s Day?
Category Frequency Percent
Yellow Roses 66 17.1%
White Roses 78 20.3%
Red Roses 159 41.3%
Mixed colors 82 21.3%
Total 385 100.0%
Describe the central tendency and variability apparent in this analysis.
Red roses are the most ordered (mode of 41.3 percent), but they are not ordered by a majority
21. An entrepreneur is thinking about opening an upscale restaurant. To help assess the market
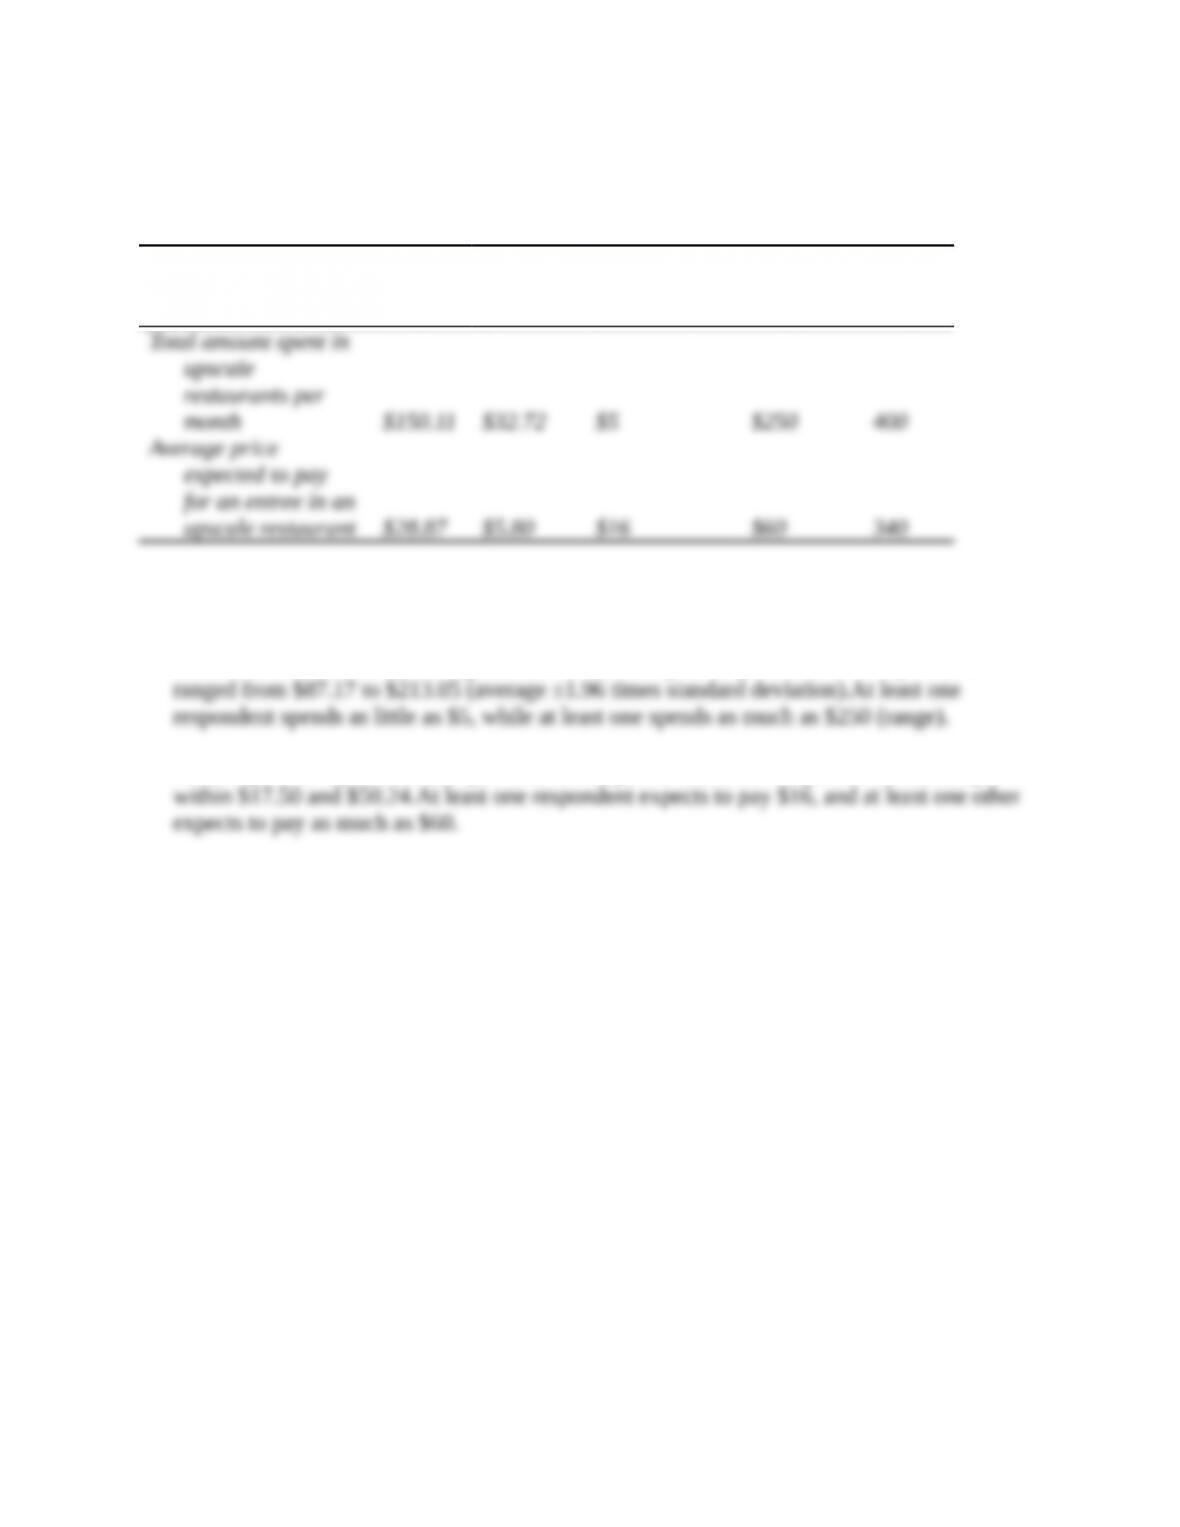
size, a researcher conducts a survey of individuals in the geographic target market who
patronize upscale restaurants. The findings of the summarization analysis for two questions
on the survey follow.
Variable
Averag
e
Standard
Deviatio
n Minimum
Maximu
m
Sampl
e
Describe the central tendency and variability apparent in this analysis.
The 400 upscale restaurant patrons in the survey spend about $150 per month, on average, at
these restaurants, but there is a good deal of variability as 95 percent of the respondents
With respect to expected entrée price, the average is $28.87, and 95 percent of the sample is