Process Technology Equipment
Chapter 2 Process Drawings and Equipment
Standards
Page 1
CHAPTER 2 Process Drawings and Equipment Standards
Table of Contents
Contents
Page
Chapter Overview
2
Class Preparation Checklist
2
Chapter Objectives
3
Agenda
4
Lesson Plan
5
2.1 Common Process Drawings and Their Uses
2.2 Block Flow Diagram (BFD)
7
7
2.3 Process Flow Diagram (PFD)
2.4 Piping and Instrumentation Diagram (P&ID)
2.5 Plot Plan
2.6 Common Information Contained on Process
Drawings
8
8
10
11
2.7 Equipment Standards
16
Summary and Wrap-Up
16
Suggested Student Activities
17
End of Chapter Review Questions
17
Clicker Questions
Appendix
27
30
Process Technology Equipment
Chapter 2 Process Drawings and Equipment
Standards
Page 2
CHAPTER 2 Process Drawings and Equipment Standards
Chapter Overview
Diagrams or process drawings are used to provide process technicians with a visual
description and explanation of the processes, equipment, and other important items in a
facility. Process drawings for a process technician are like maps for hikers in the deep
woods. Process diagrams show process technicians what they will encounter in the
process unit and how to navigate around the process flow of a facility.
There are many different types of drawings, each of which represents different aspects
of the process and different levels of detail. Looking at combinations of these drawings
provides a more complete picture of the processes and the facility. Without process
drawings, it would be difficult for process technicians to understand a process and how
it operates.
When examining process drawings, it is important to remember that all drawings share
three common functions:
1. Simplifying (using common symbols to make processes easy to understand)
2. Explaining (describing how all the parts or components of a system work
together)
3. Standardizing (using a common set of lines and symbols to represent
components).
Diagrams also are used extensively by process technicians for learning a process, for
troubleshooting, at start-up and shutdown, and after initial commissioning.
To be considered proper industrial drawings, process drawings must meet several
requirements. These include specific, universal rules about how lines are drawn, how
proportions are used, what measurements are used, and what components are
included.
Class Preparation Checklist
1. Familiarize yourself with the chapter content.
2. Bring cutaways or other hands-on teaching aids if available.
3. Copy and distribute any fill-in-the-blank handouts for today’s content.
4. Safety Minute prepared or assigned
5. Review the PowerPoint slides associated with this chapter (if used) and
make sure that your computer is correctly set up to navigate the slide deck
smoothly.
6. Request the appropriate A/V equipment (if needed) and make sure that
your computer is correctly synched with the projector to avoid any delays in
the classroom.
Process Technology Equipment
Chapter 2 Process Drawings and Equipment
Standards
Page 3
Chapter Objectives
2.1 Explain the purpose of diagrams, including why, when, and where they are used
(NAPTA Diagrams).
2.6 Identify symbols and common elements on drawings used for process equipment
and instrumentation (NAPTA Diagrams).
2.7 Explain the purpose of equipment standards (NAPTA Diagrams).
Process Technology Equipment
Chapter 2 Process Drawings and Equipment
Standards
Page 4
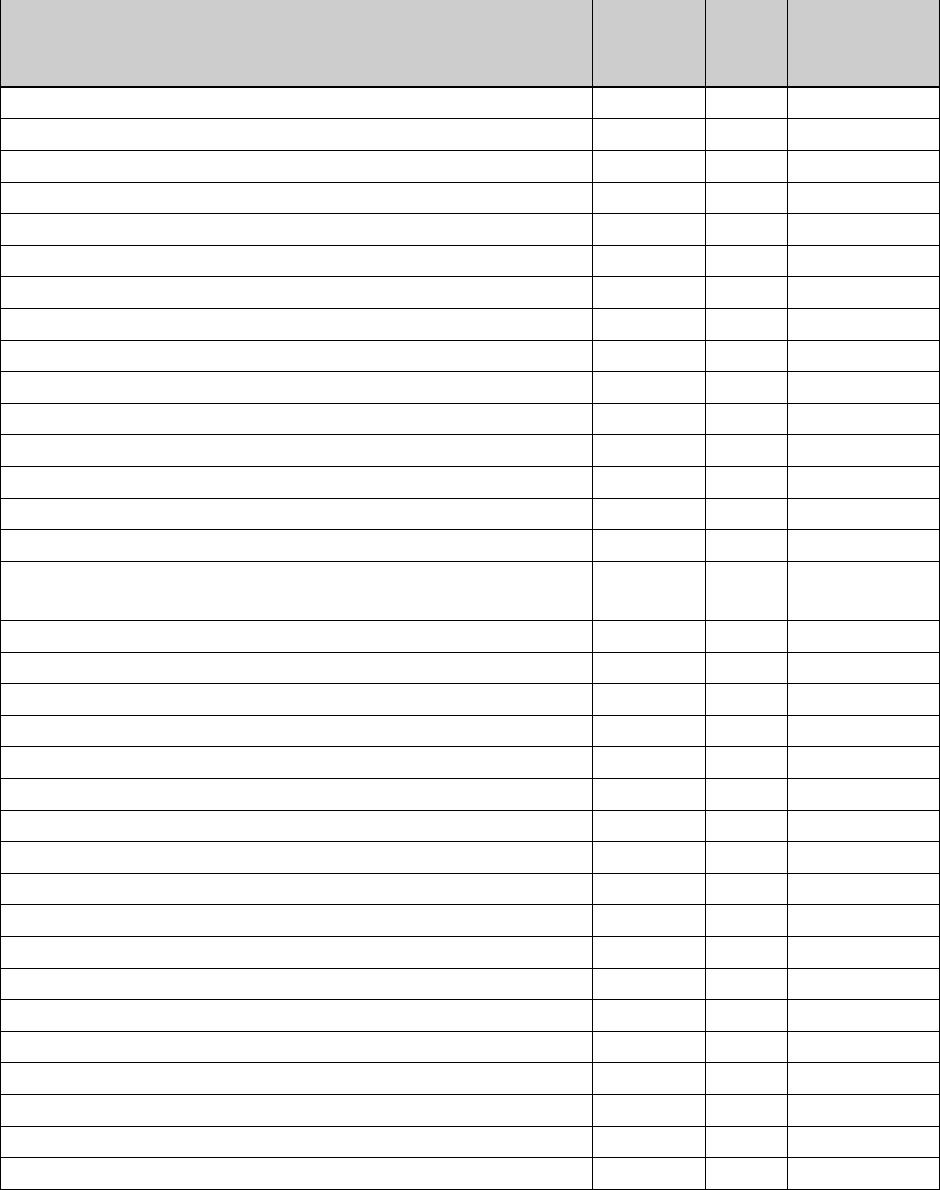
Class Agenda
Activity
Minutes
PPTs
Handouts
(title, if
any)
1. Welcome to Class
1
1
2. Introduction and Agenda
2
2
3. Safety Minute
2
3
4. Objectives
1
4
5. Objectives (cont.)
1
5
6. Terms
5
6
7. Common Process Drawings and Their Uses
1
7
8. Block Flow Diagram (BFD)
2
8
9. Process Flow Diagram (PFD)
2
9
10. Piping and Instrumentation Diagram (P&ID)
3
10
11. Utility Flow Diagram (UFD)
1
11
12. Electrical Diagram
1
12
13. Isometric Drawing
1
13
14. Plot Plan
1
14
15. Other Drawings
1
15
16. Common Information Contained on Process
Drawings
1
16
17. Legend
1
17
18. Title Block
1
18
19. Application Block
1
19
20. Symbols—Pumps, Blower, Compressors
1
20
21. Symbols—Cooling Towers
1
21
22. Symbols—Vessels, Towers, or Reactors
1
22
23. Valve Symbols
2
23
24. Valve Symbols (cont.)
2
24
25. Actuator Symbols
1
25
26. Electrical Equipment Symbols
1
26
27. Instrumentation Symbols
1
27
28. Legend with Instrument Symbols
2
28
29. Sample ISA Instrument Tag Number
2
29
30. ISA Functional Identification Labels
1
30
31. ISA Functional Identification Labels (cont.)
1
31
32. Instrument Tag Letters
1
32
33. Equipment Standards
1
33
34. Summary and Wrap-Up
3
34
Process Technology Equipment
Chapter 2 Process Drawings and Equipment
Standards
Page 5
Chapter 2 Lesson Plan
Welcome Everyone to Class
Time: 1 minute
Resources: Slide 1
Introduction and Agenda
Time: 2 minutes
Resources: Slide 2
Sample Instructor Script:
Diagrams or process drawings are used to provide process technicians with a visual
description and explanation of the processes, equipment, and other important items in a
facility. Process diagrams show process technicians what they will encounter in the
process unit and how to navigate around the process flow of a facility.
There are many different types of drawings, each of which represents different aspects
of the process and different levels of detail. Looking at combinations of these drawings
provides a more complete picture of the processes and the facility.
When examining process drawings, it is important to remember that all drawings share
three common functions:
Diagrams also are used extensively by process technicians for learning a process, for
troubleshooting, at start-up and shut-down, and after initial commissioning.
Process Technology Equipment
Chapter 2 Process Drawings and Equipment
Standards
Page 6
● Announce who has responsibility for today’s Safety Minute.
● Have the student present the Safety Minute.
● Announce who is presenting the Safety Minute next class.
Objectives
Time: 1 minute
Sample Instructor Script:
● Identify a plot plan and explain the purpose of equipment layout drawings (plot
plans).
● Identify symbols and common elements on drawings used for process equipment
and instrumentation.
● Explain the purpose of equipment standards.
Terms
Time: 5 minutes
Resources: Slide 6
Process Technology Equipment
Chapter 2 Process Drawings and Equipment
Standards
Page 7
2.1 Common Process Drawings and Their Uses
Time: 1 minute
Resources: Slide 7
Sample Instructor Script:
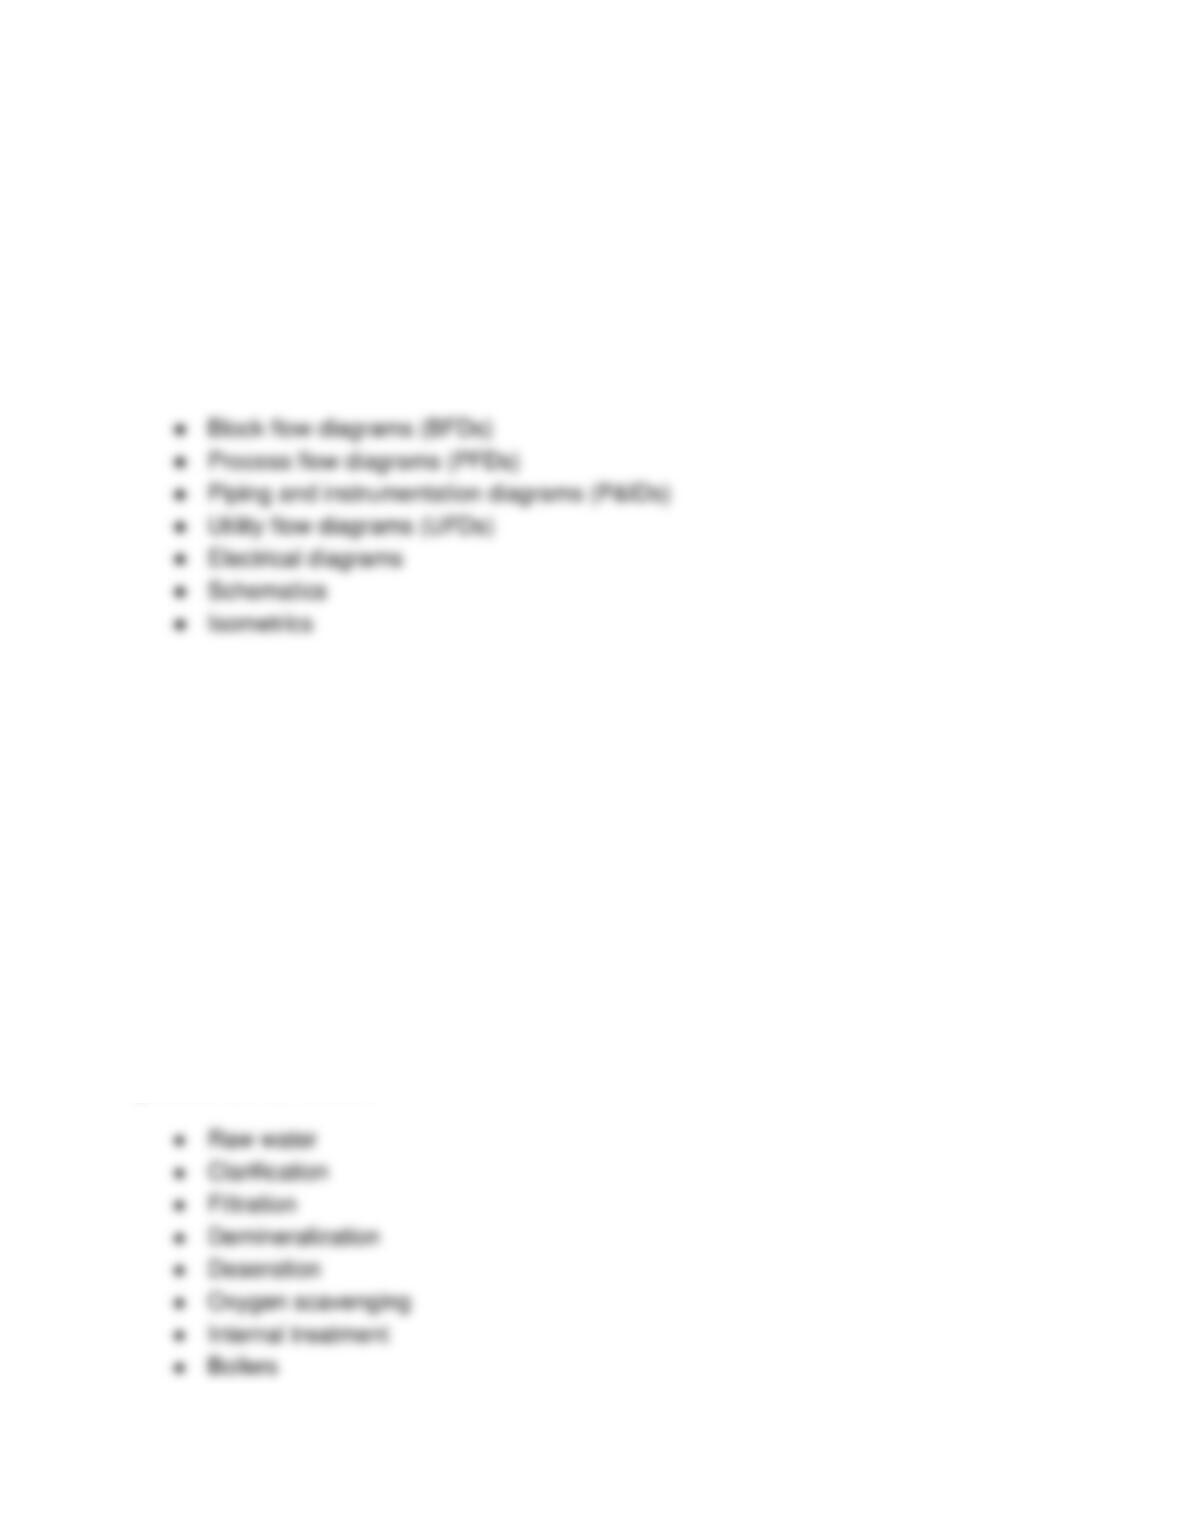
Process technicians must recognize a wide variety of drawings and understand how to
use each one. The most commonly encountered drawings are:
Process technicians are exposed to different types of industrial drawings on the job. The
two most common types of drawings are process flow diagrams (PFDs) and piping and
instrumentation diagrams (P&IDs).
2.2 Block Flow Diagram (BFD)
Time: 2 minutes
Resources: Slide 8
Sample Instructor Script:
Block flow diagrams (BFDs) are simple drawings that show a general overview of a
process and contain few specifics. BFDs use blocks to represent sections of a process
and use flow arrows to show the order and relationship of each component.
The BFD in this slide represents a boiler feedwater treatment process. The steps in the
process are as follows:
Process Technology Equipment
Chapter 2 Process Drawings and Equipment
Standards
Page 8
2.3 Process Flow Diagram (PFD)
Time: 2 minutes
Resources: Slide 9
2.4 Piping and Instrumentation Diagram (P&ID)
Time: 3 minutes
Resources: Slide 10
Sample Instructor Script:
Piping and instrumentation diagrams (P&IDs), sometimes referred to as process and
instrument drawings, are similar to PFDs. However, P&IDs show more detailed process
information, such as equipment, piping, flow arrows, materials of construction, and
insulation. Additional information on a P&ID includes equipment numbers, piping
specifications, and complete and detailed instrumentation. This slide shows an example
of a P&ID.
Process Technology Equipment
Chapter 2 Process Drawings and Equipment
Standards
Process technicians must recognize symbols used in their facilities and also be able to
interpret process flows and instrument and equipment designations.
2.4.1 Utility Flow Diagram (UFD)
Time: 1 minute
Resources: Slide 11
Sample Instructor Script:
2.4.2 Electrical Diagram
Time: 1 minute
Resources: Slide 12
Sample Instructor Script:
Since most processes rely on electricity, it is important for process technicians to
Process Technology Equipment
Chapter 2 Process Drawings and Equipment
Standards
Page 10
2.4.3 Isometric Drawing
Time: 1 minute
Resources: Slide 13
Sample Instructor Script:
2.5 Plot Plan
Time: 1 minute
Resources: Slide 14
Sample Instructor Script:
Plot plans (also called equipment location drawings) show the layout and dimensions of
equipment, units, and buildings. They are drawn to scale so that everything is of the
correct relative size. For example, plot plans show the location of machinery like pumps
and heat exchangers in an equipment room. On a larger scale, a plot plan shows the
location and dimensions of process units, buildings, roads, and other site constructions
such as fences. A site plot plan also shows elevations and grades of the ground
surface. This slide shows an example of a plot plan.
Process Technology Equipment
Chapter 2 Process Drawings and Equipment
Standards
2.5.1 Other Drawings
Time: 1 minute
Resources: Slide 15
Sample Instructor Script:
Along with the drawings mentioned previously, process technicians also might
encounter other types of drawings, such as elevation diagrams, process schematics,
loop diagrams, and logic diagrams.
2.6 Common Information Contained on Process Drawings
Time: 1 minute
2.6.1 Legend
Time: 1 minute
2.6.2 Title Block
Time: 1 minute
Resources: Slide 18
Process Technology Equipment
Chapter 2 Process Drawings and Equipment
Standards
Page 12
2.6.3 Application Block
Time: 1 minute
2.6.4 Symbols—Pumps, Blowers, Compressors
Time: 1 minute
Resources: Slide 20
2.6.5 Symbols—Cooling Towers
Time: 1 minute
Resources: Slide 21
Sample Instructor Script:
Here are some symbols of cooling towers:
2.6.6 Symbols—Vessels, Towers, or Reactors
Process Technology Equipment
Chapter 2 Process Drawings and Equipment
Standards
Page 13
2.6.7 Valve Symbols
Time: 2 minutes
Resources: Slide 23
Sample Instructor Script:
2.6.8 Valve Symbols (cont.)
Time: 2 minutes
Resources: Slide 24
Sample Instructor Script:
Process Technology Equipment
Chapter 2 Process Drawings and Equipment
Standards
Page 14
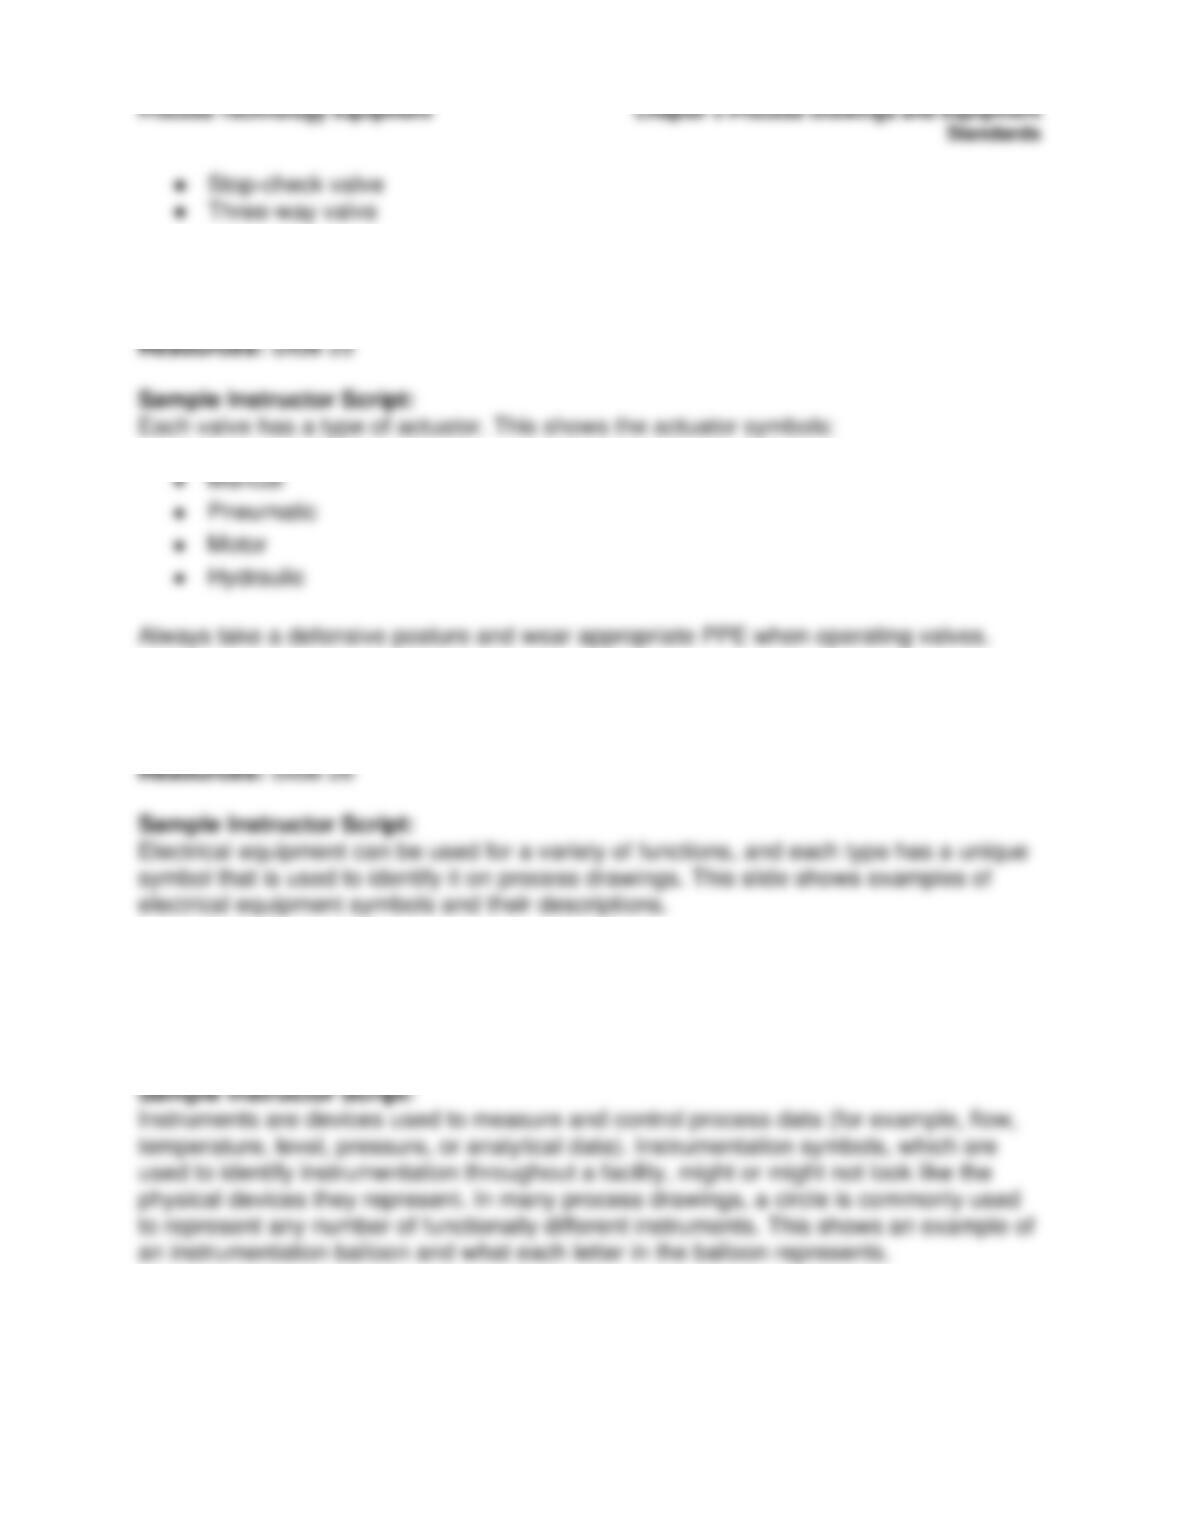
2.6.9 Actuator Symbols
Time: 1 minute
2.6.10 Electrical Equipment Symbols
Time: 1 minute
2.6.11 Instrumentation Symbols
Time: 1 minute
Resources: Slide 27
2.6.12 Legend with Instrument Symbols
Time: 2 minutes
Process Technology Equipment
Chapter 2 Process Drawings and Equipment
Standards
Page 15
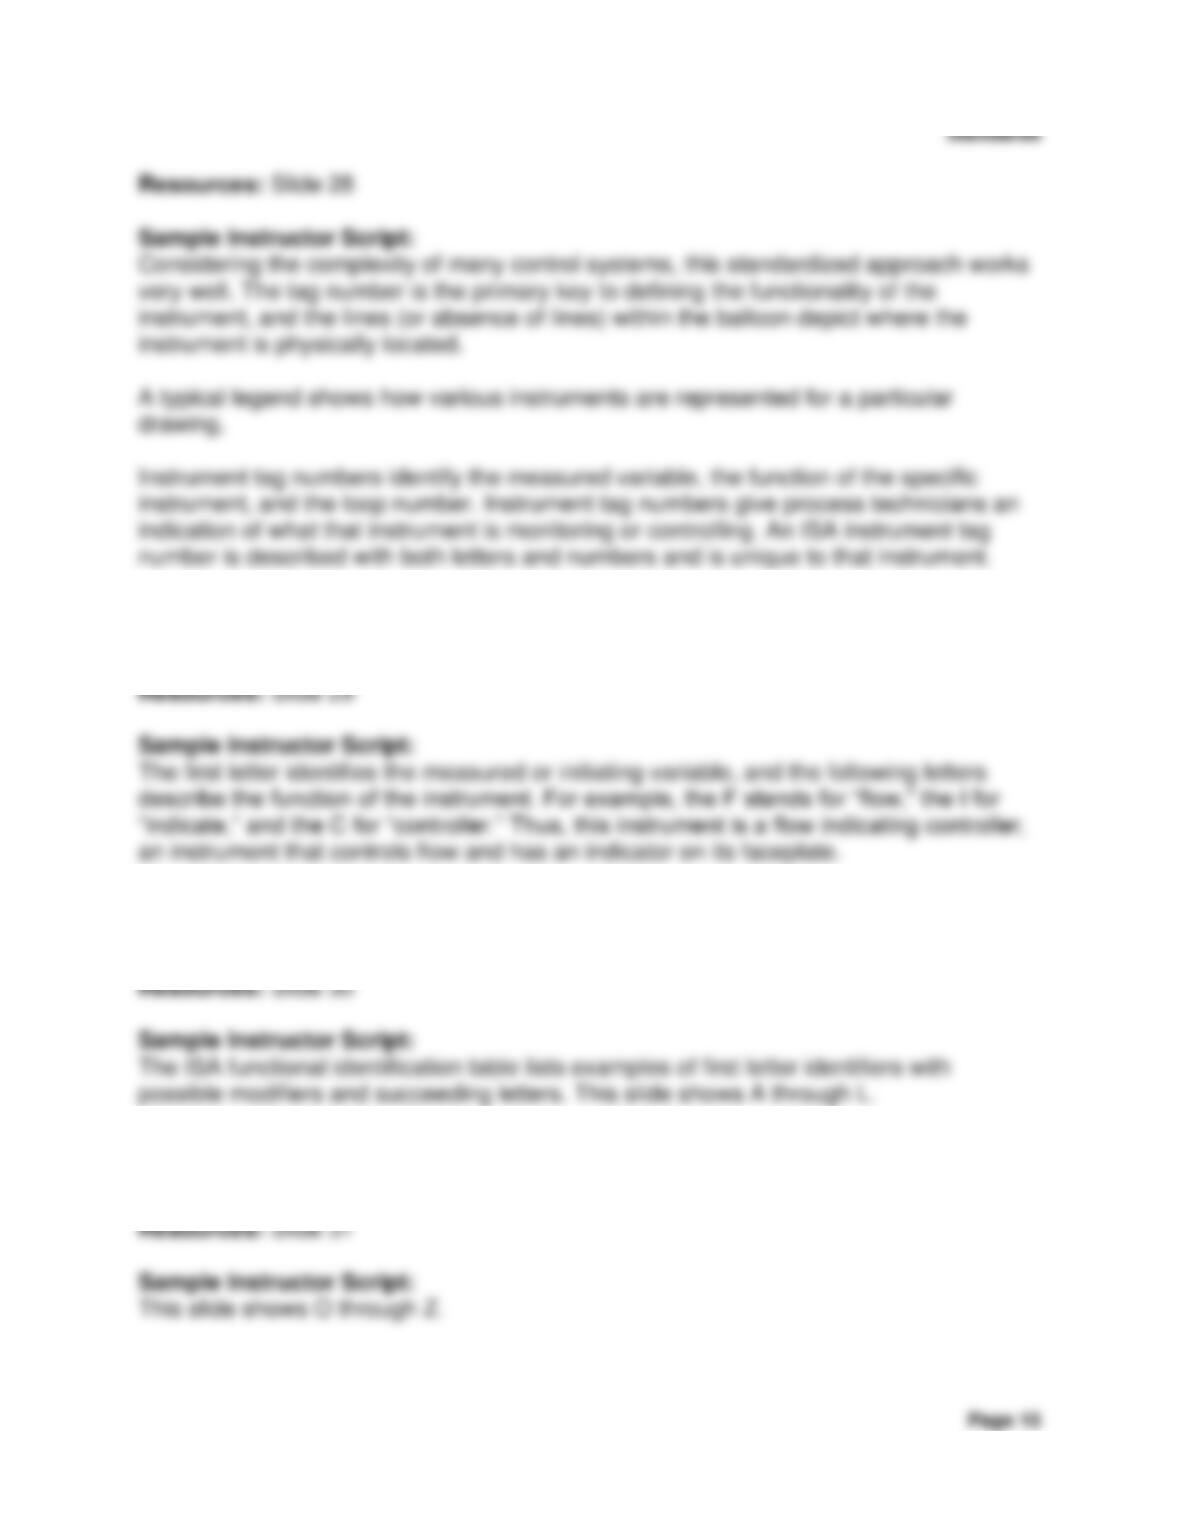
2.6.13 Sample ISA Instrument Tag Number
Time: 2 minutes
2.6.14 ISA Functional Identification Labels
Time: 1 minute
2.6.15 ISA Functional Identification Labels (cont.)
Time: 1 minute
Process Technology Equipment
Chapter 2 Process Drawings and Equipment
Standards
Page 16
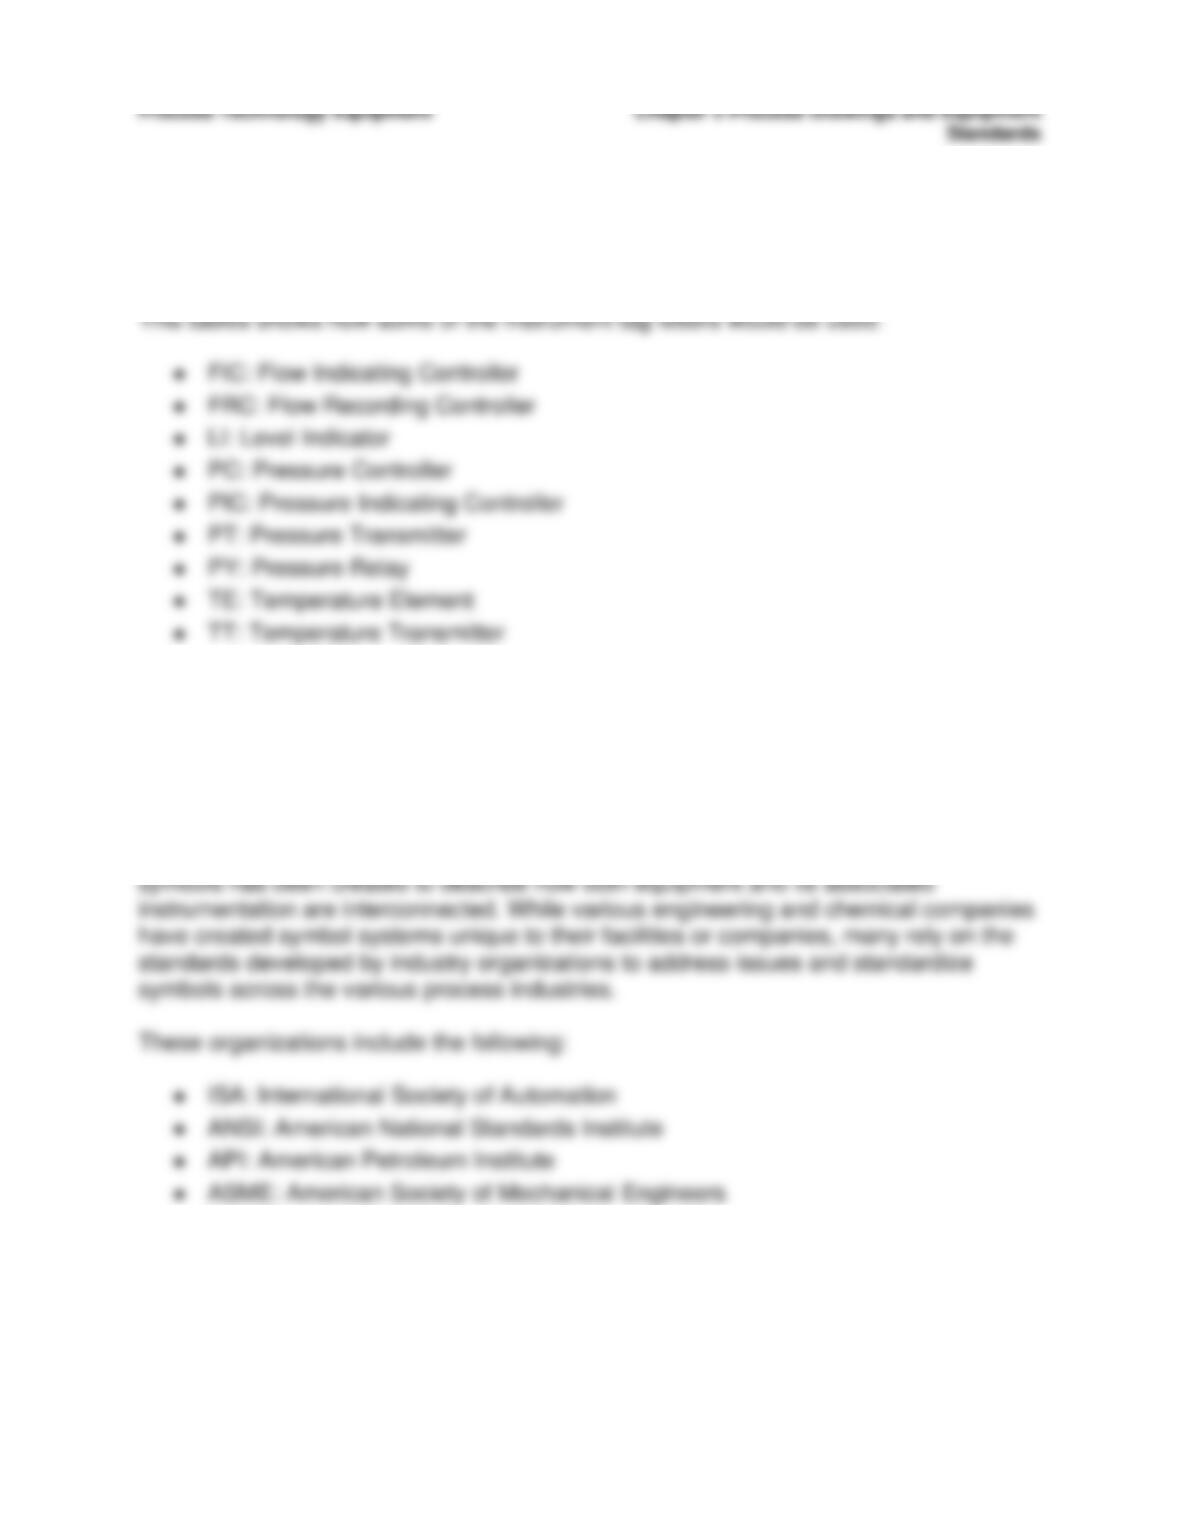
2.6.16 Instrument Tag Letters
Time: 1 minute
Resources: Slide 32
Sample Instructor Script:
2.7 Equipment Standards
Time: 1 minute
Resources: Slide 33
Sample Instructor Script:
With the development of process drawings and equipment standards, a system of
● NEC: National Electric Code
● OSHA: Occupational Safety and Health Administration
Summary and Wrap-Up
Time: 3 minutes
Process Technology Equipment
Chapter 2 Process Drawings and Equipment
Standards
Resources: Slide 34
Sample Instructor Script:
Let’s summarize today’s lesson and consider what we will be doing in the next class.
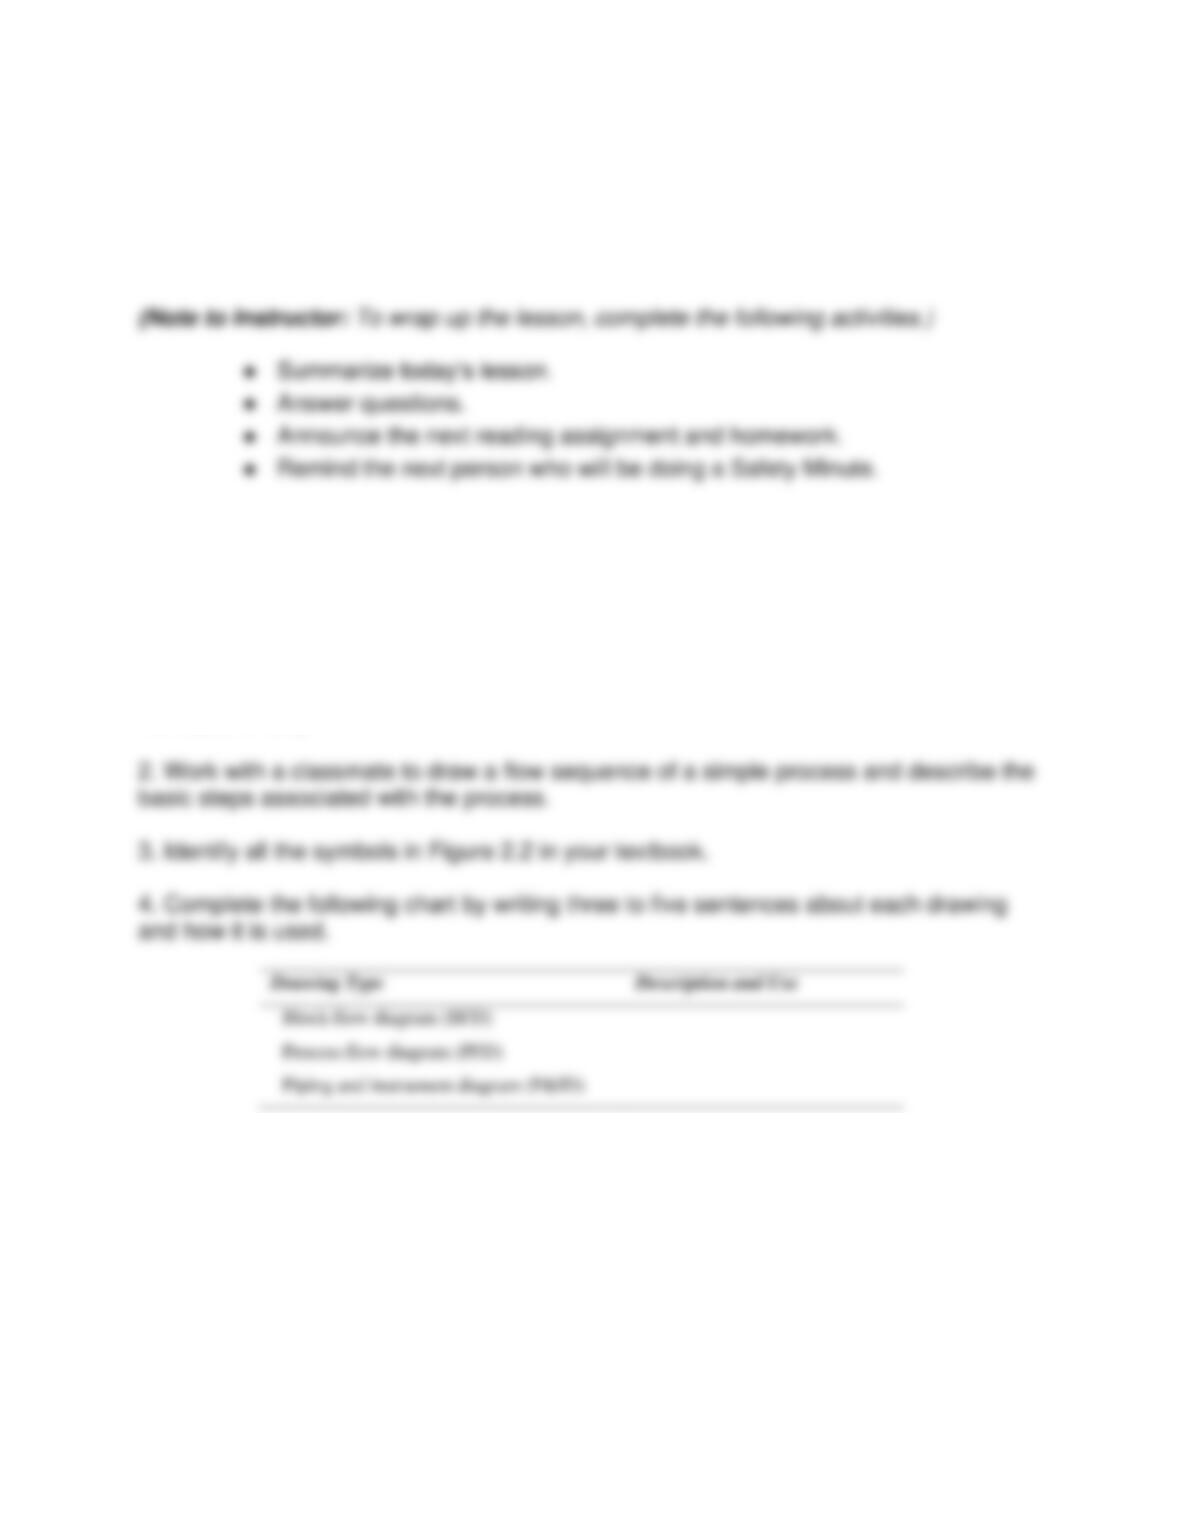
Suggested Student Activities
(Note to Instructor: Time permitting, do the activities listed below or possibly assign
them as homework. Be sure to remind students what to read for the next class.)
1. Write a paper about one or more instrumentation standards (for example, ANSI, API,
ASME, and ISA).
Process Technology Equipment
Chapter 2 Process Drawings and Equipment
Standards
C. Path of the process
D. Sequence of the process
2. What do flow arrows in a block flow diagram show?
A. Power sources required by the process
B. The starting point of the process
C. Sections of a process
D. The order of the steps
3. What process drawing is one of the most common types of drawings?
A. Schematics
B. Electrical diagrams
C. Block flow diagrams
D. Piping and Instrument diagrams