Problems and Solutions for Chapter 2
Problem 2-1
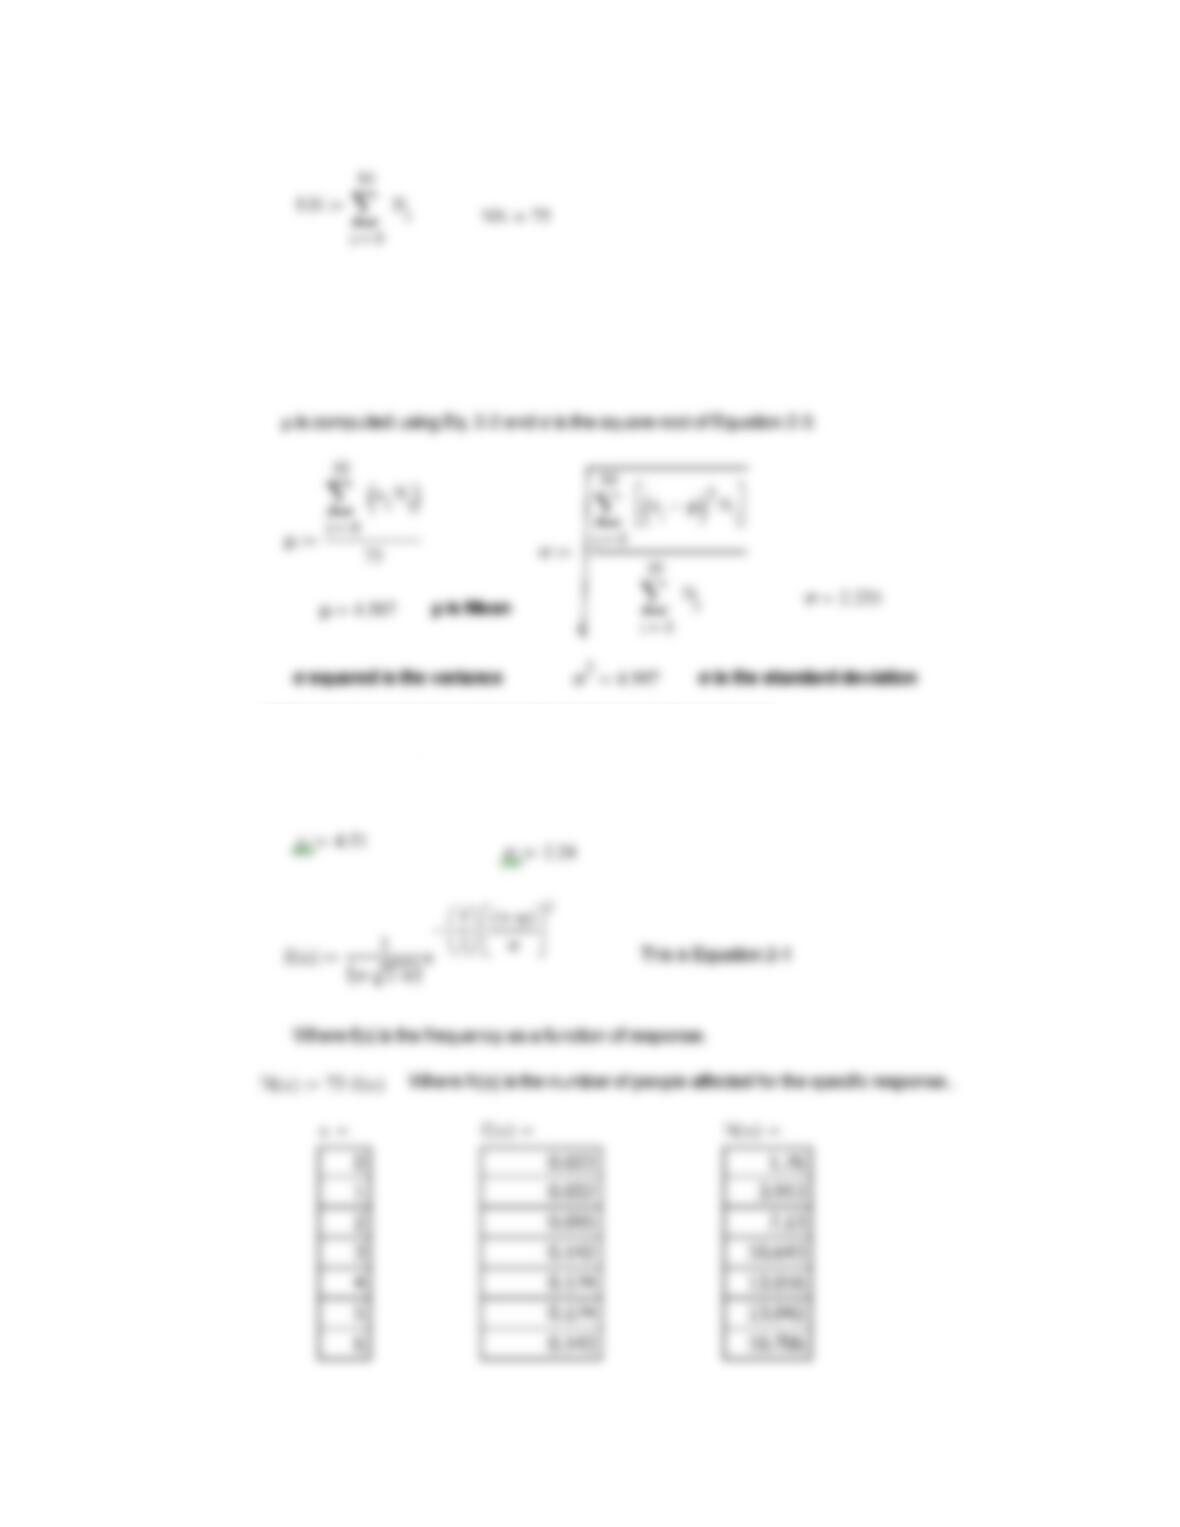
Using the data provided in Example 2-1, determine the a) mean, and
variance, b) frequency as a function of the response, c) number affected as a
function of the of the response, and d) show graphs for the frequency and
number affected.
Solution 2-1
Note to instructor: A few of these problems are easy, but they give
you an opportunity to have the students use the correct tools for making
calculations. In this case we are using MathCad, but you can use
whatever tool that you prefer.
a) Determine the mean and variance. N is the nuimber with the
specific response
10
—————————————————————————————–
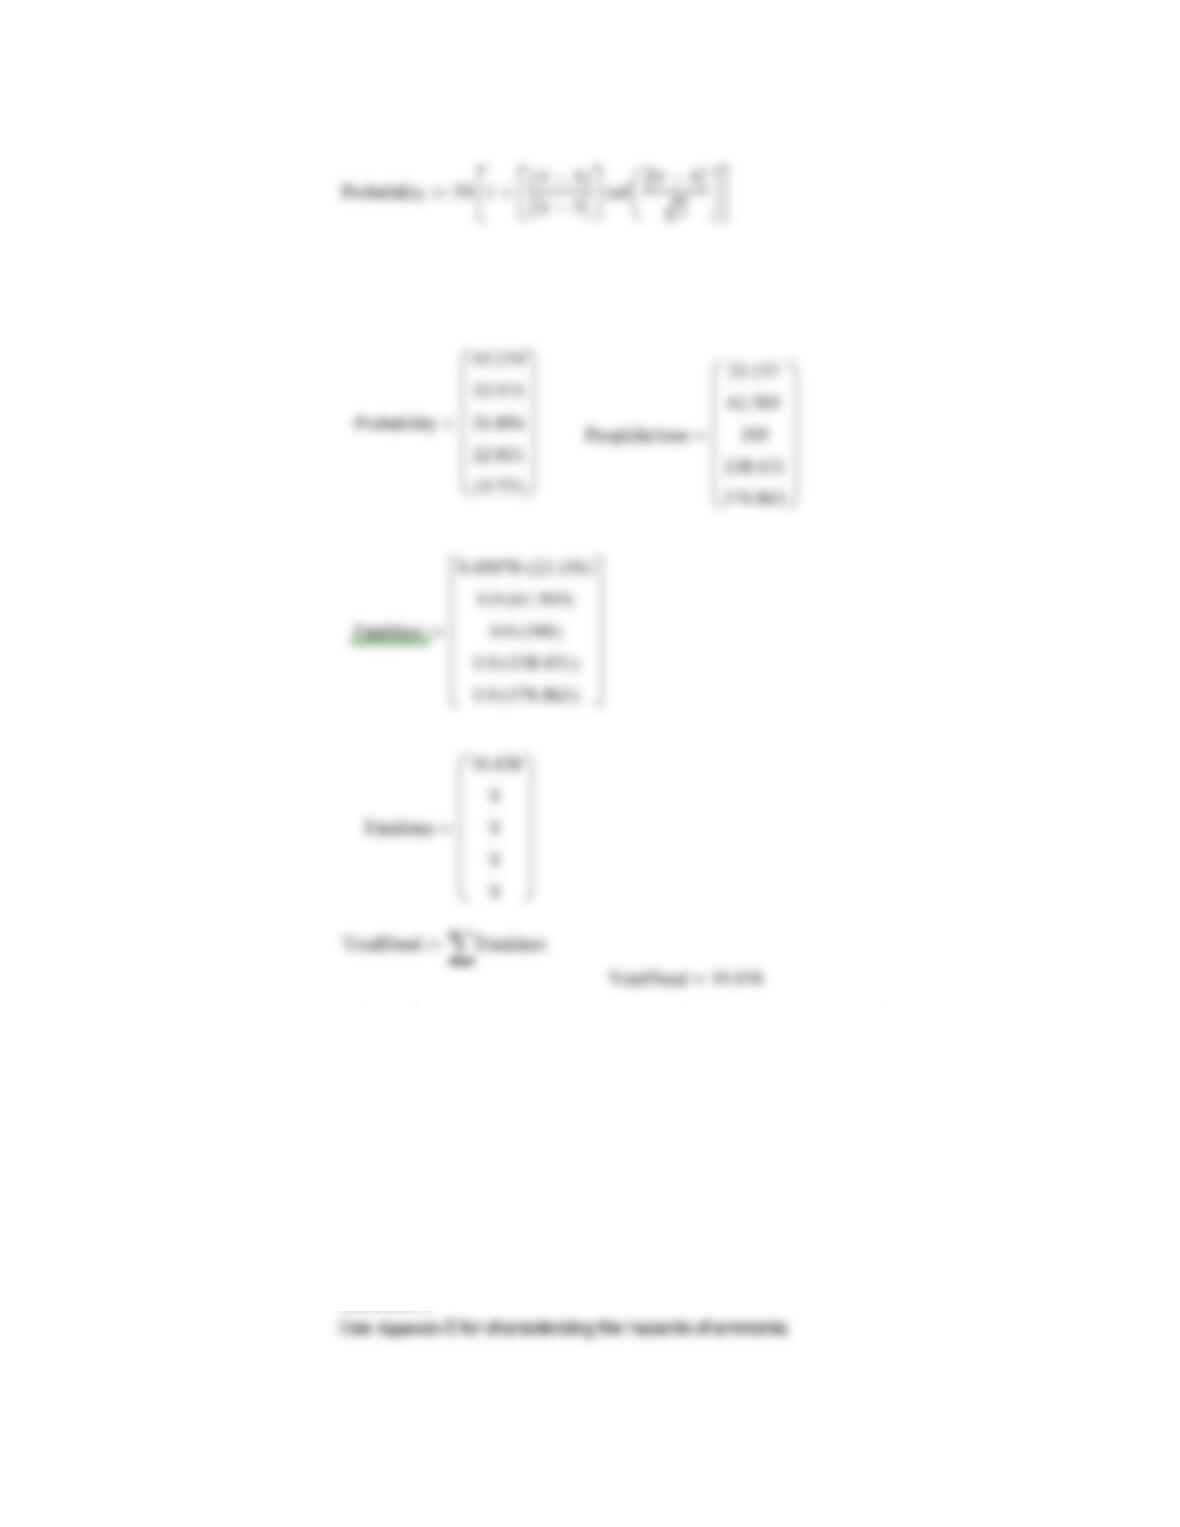
b) determine the frequency as a function of the response
0
1
2
3
4
5
6
0.023
0.052
0.095
0.142
0.174
0.174
0.143
1.76
3.913
7.13
10.643
13.016
13.042
10.706
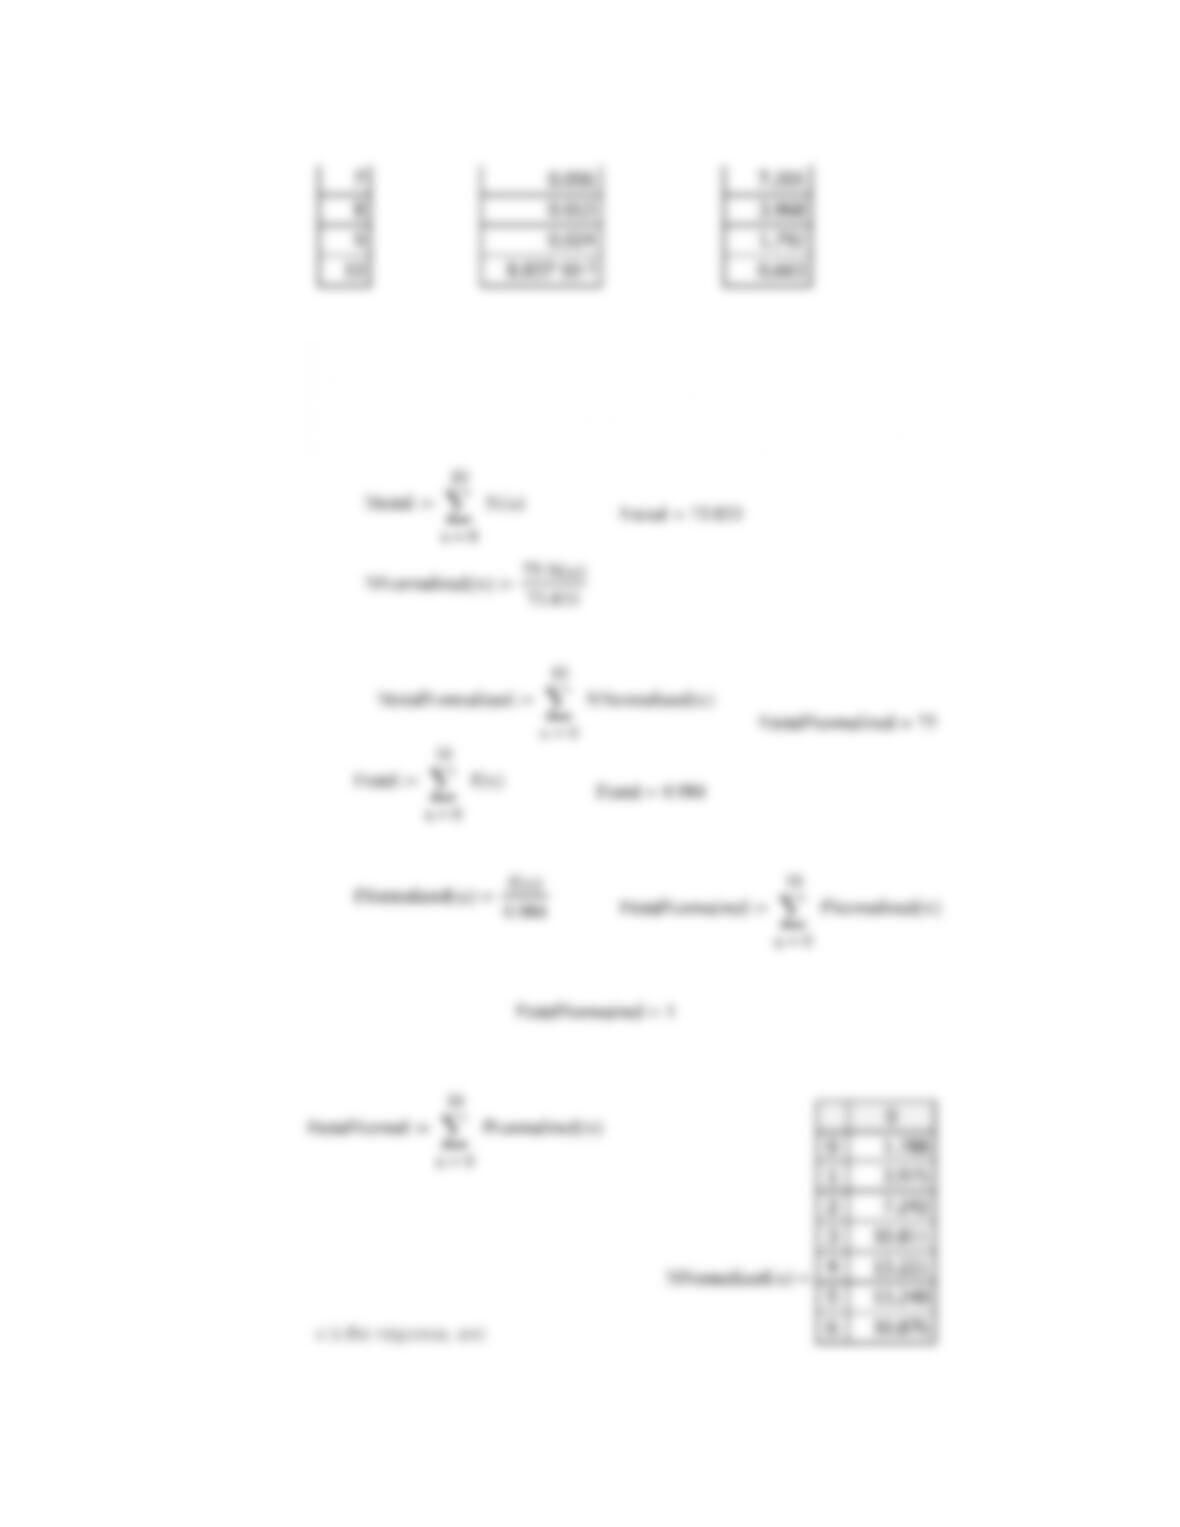
c) determine the number affected as a function of the of the response
10
5
6
13.248
10.876
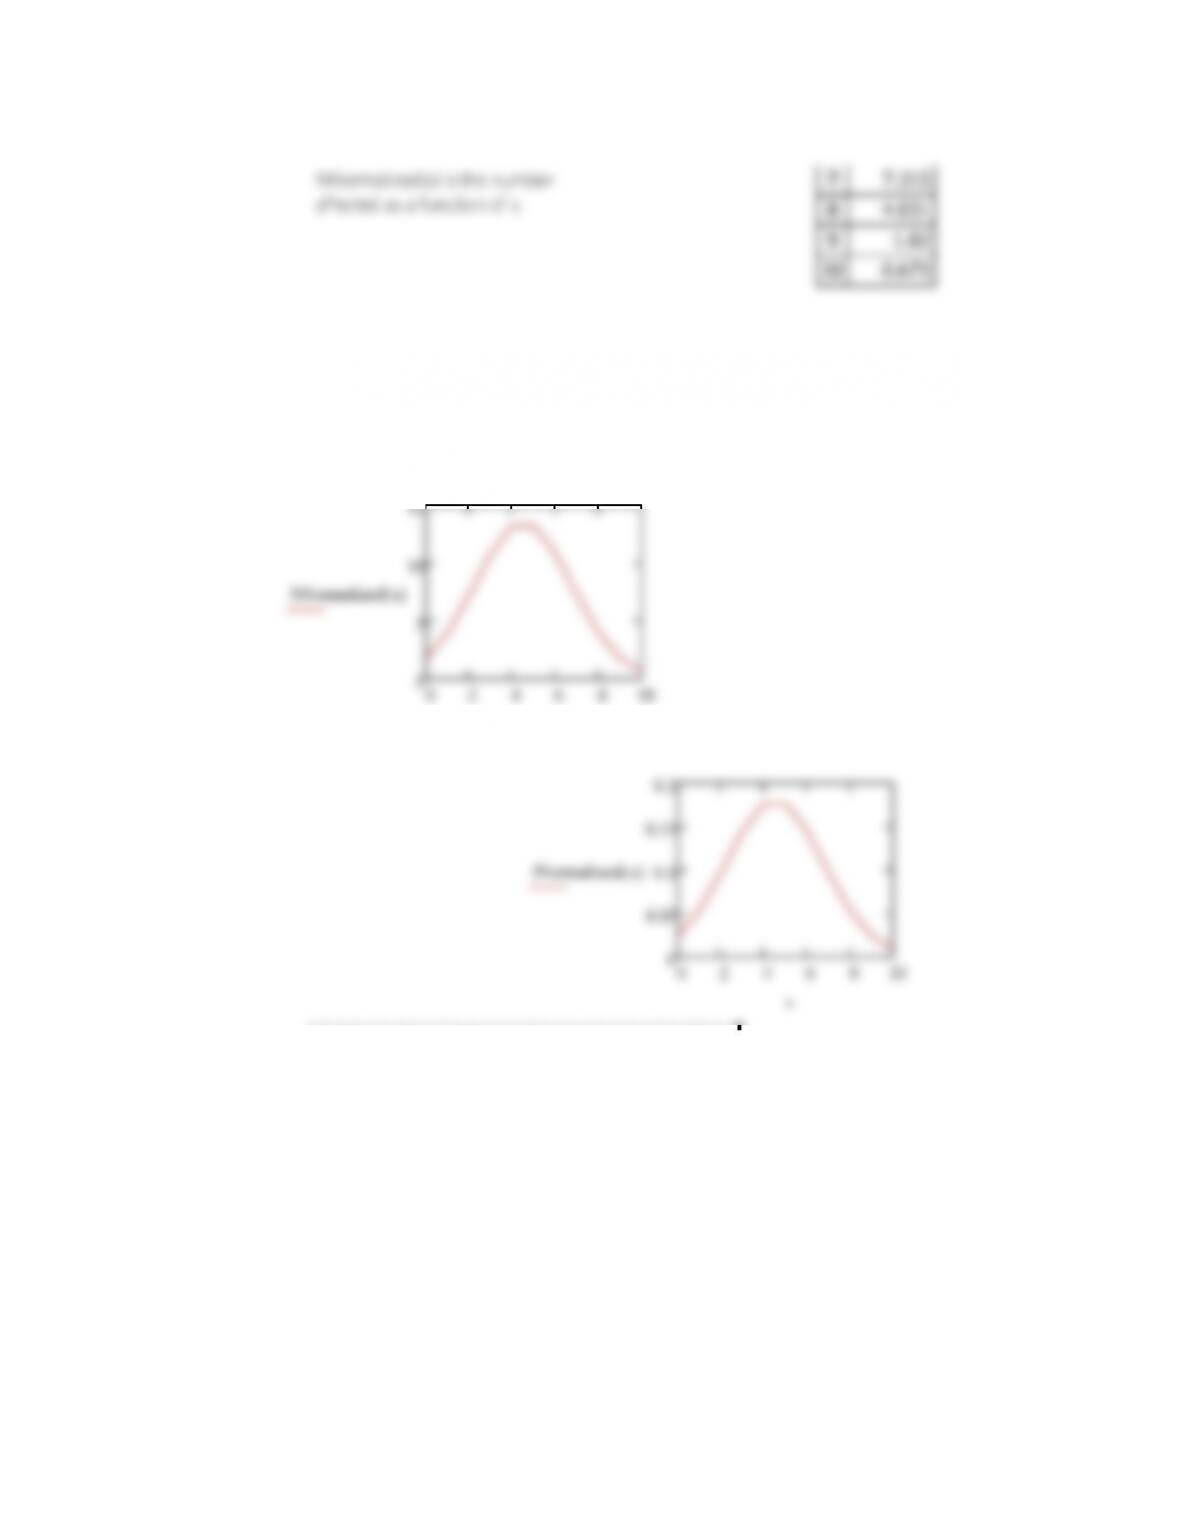
d) show graphs for the frequency and number affected as a function of response.
0 2 4 6 8 10
0
5
10
15
NNormalized x()
x
0
0.05
0.1
0.15
0.2
fNormalized x()
End of Problem 2–1.
————————————————
Problem 2-2
Using the data provided in Example 2-1, and a) determine the accumulated
frequency between minus infinity and infinity (using Equation 2-1), b) between the
mean and infinity (using Equation 2–10, c) between the mean plus the two
standard deviations and infinity (Equation 2-1), and d) state your conclusions.
Solution 2-2
a) Determine the accumulated frequency between minus infinity and infinity
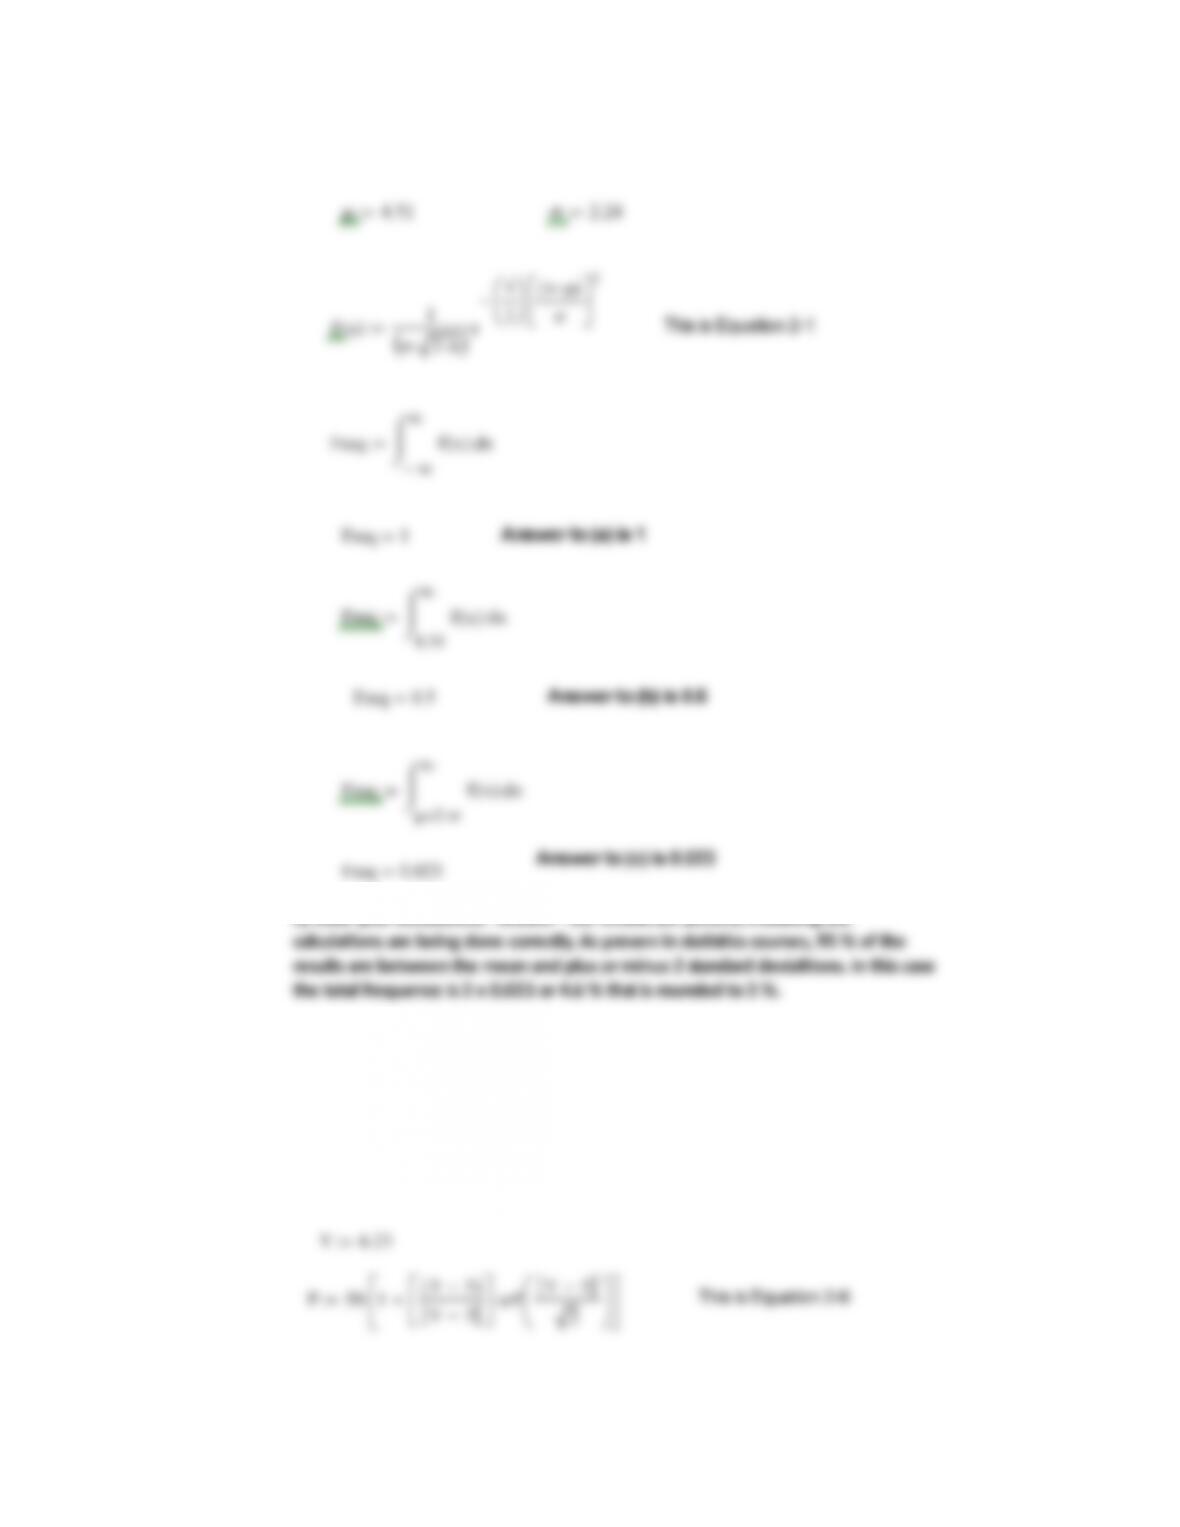
d) State your conclusions. Answer – the results are perfect, indicating the
End of Problem 2–2.
————————————————
Problem 2-3
Using Equation 2–6 determine the probability for probits of 4.39, 5.25, and 6.23.
Solution 2-3
Y5
erf Y5
2
____________
Looking at the details as shown below:
_________
If your computing program does not have an error function, then go
down the following path:
Results
Probit P P1 P2 Table 2-4 Prob.
End of Problem 2–3
_______________________________________________________
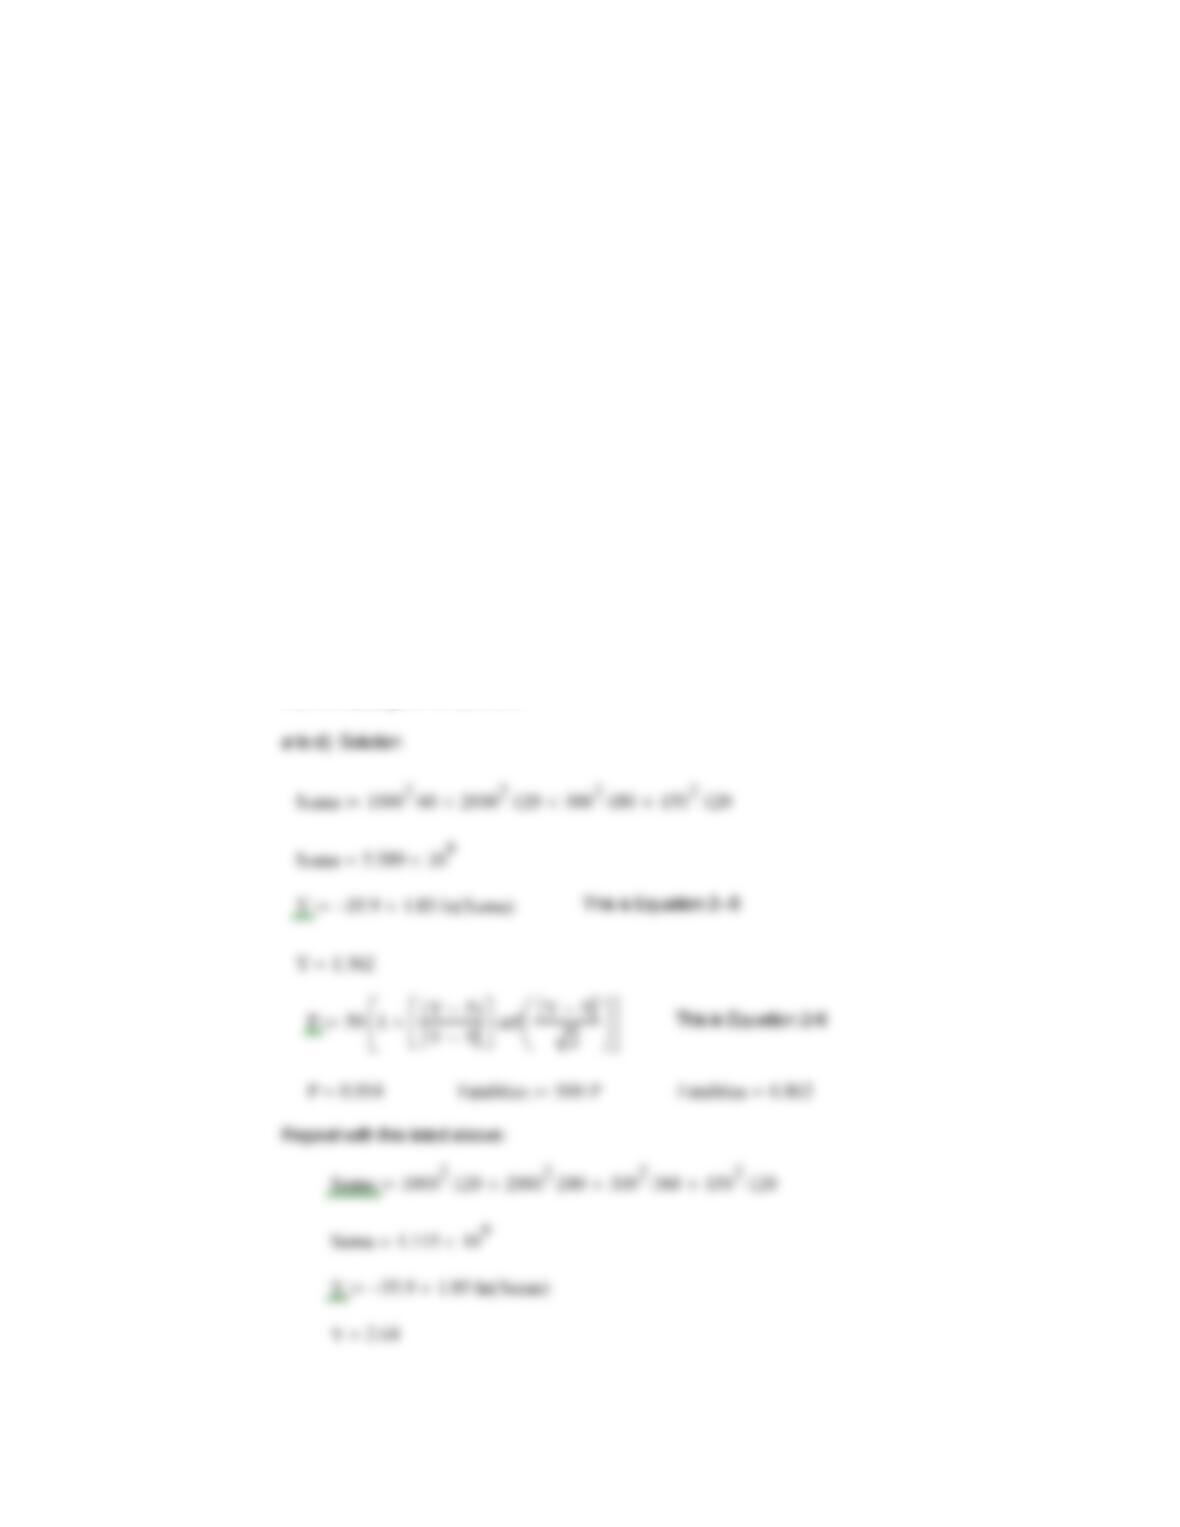
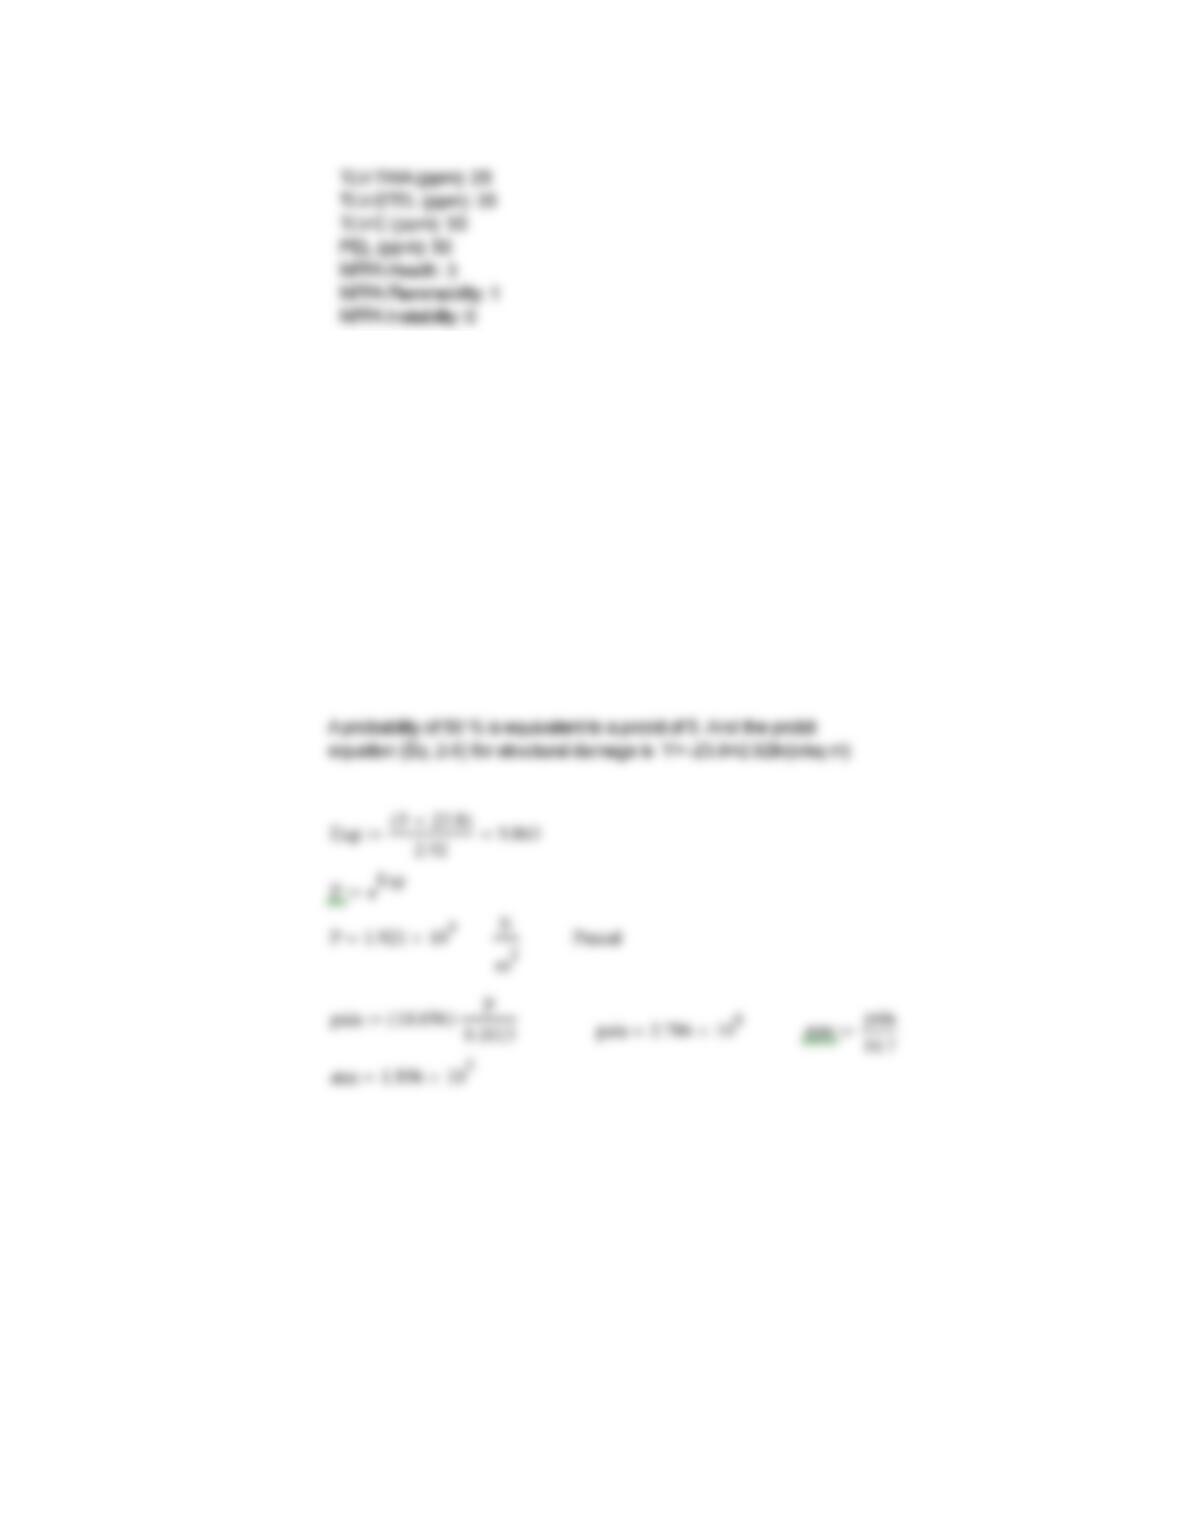
Problem 2-4. A blast produces a peak overpressure of 47,000 N/m2. What
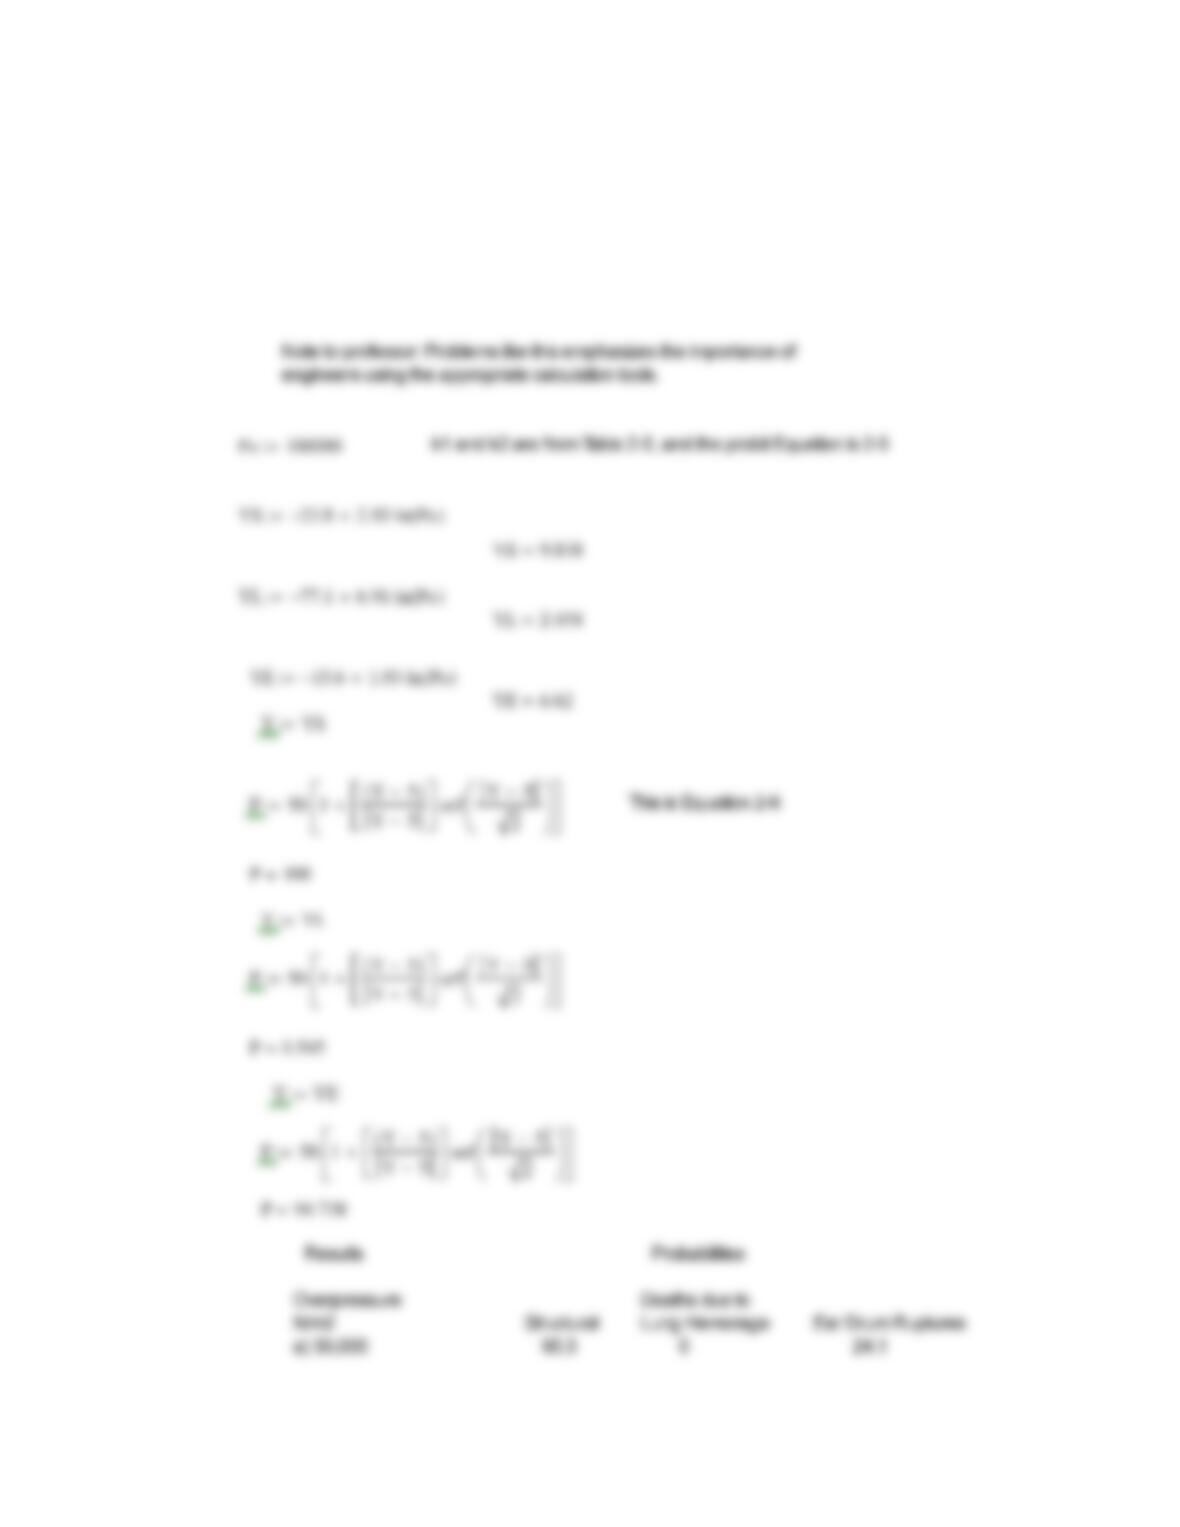
fraction of structures will be damaged by exposure to this overpressure? What
fraction of people exposed will die as a result of lung hemorrhage? What fraction
will have eardrums ruptured? What conclusions about the effects of this blast can
be drawn? Repeat this problem with 30,000, 80,000, and 100,000 N/m2.
Solution.
End of Problem 2–4
___________________________________________________
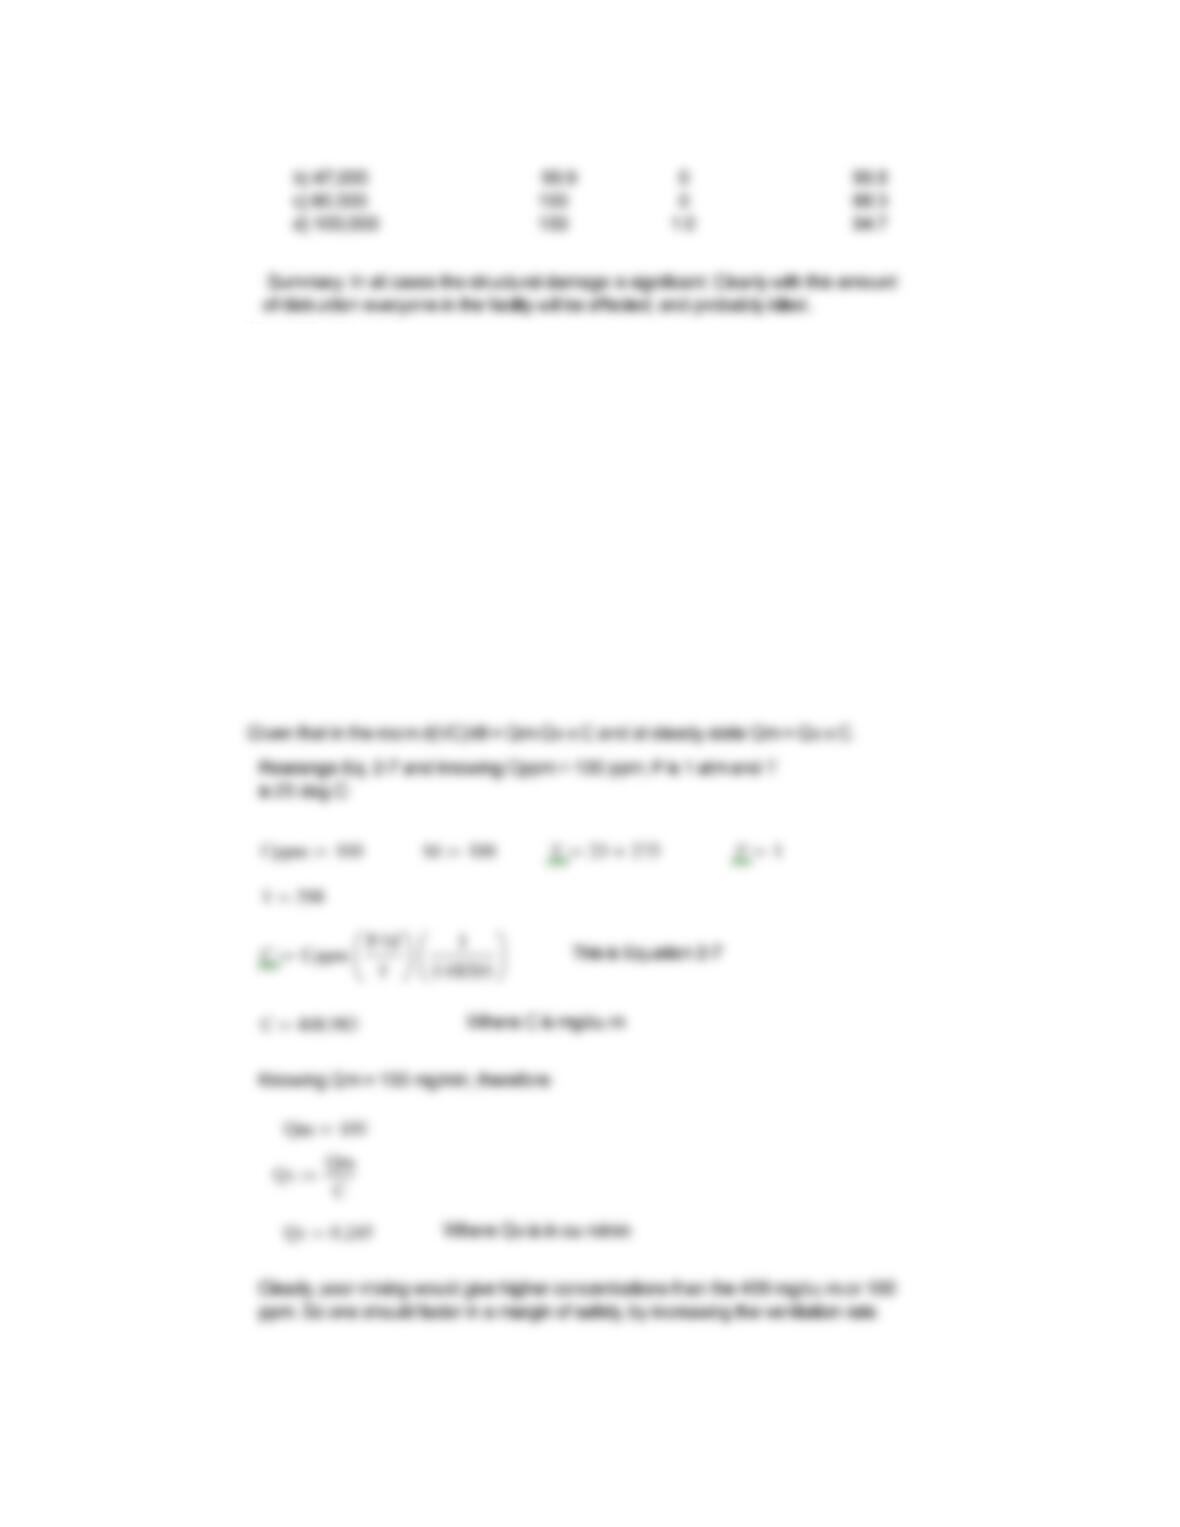
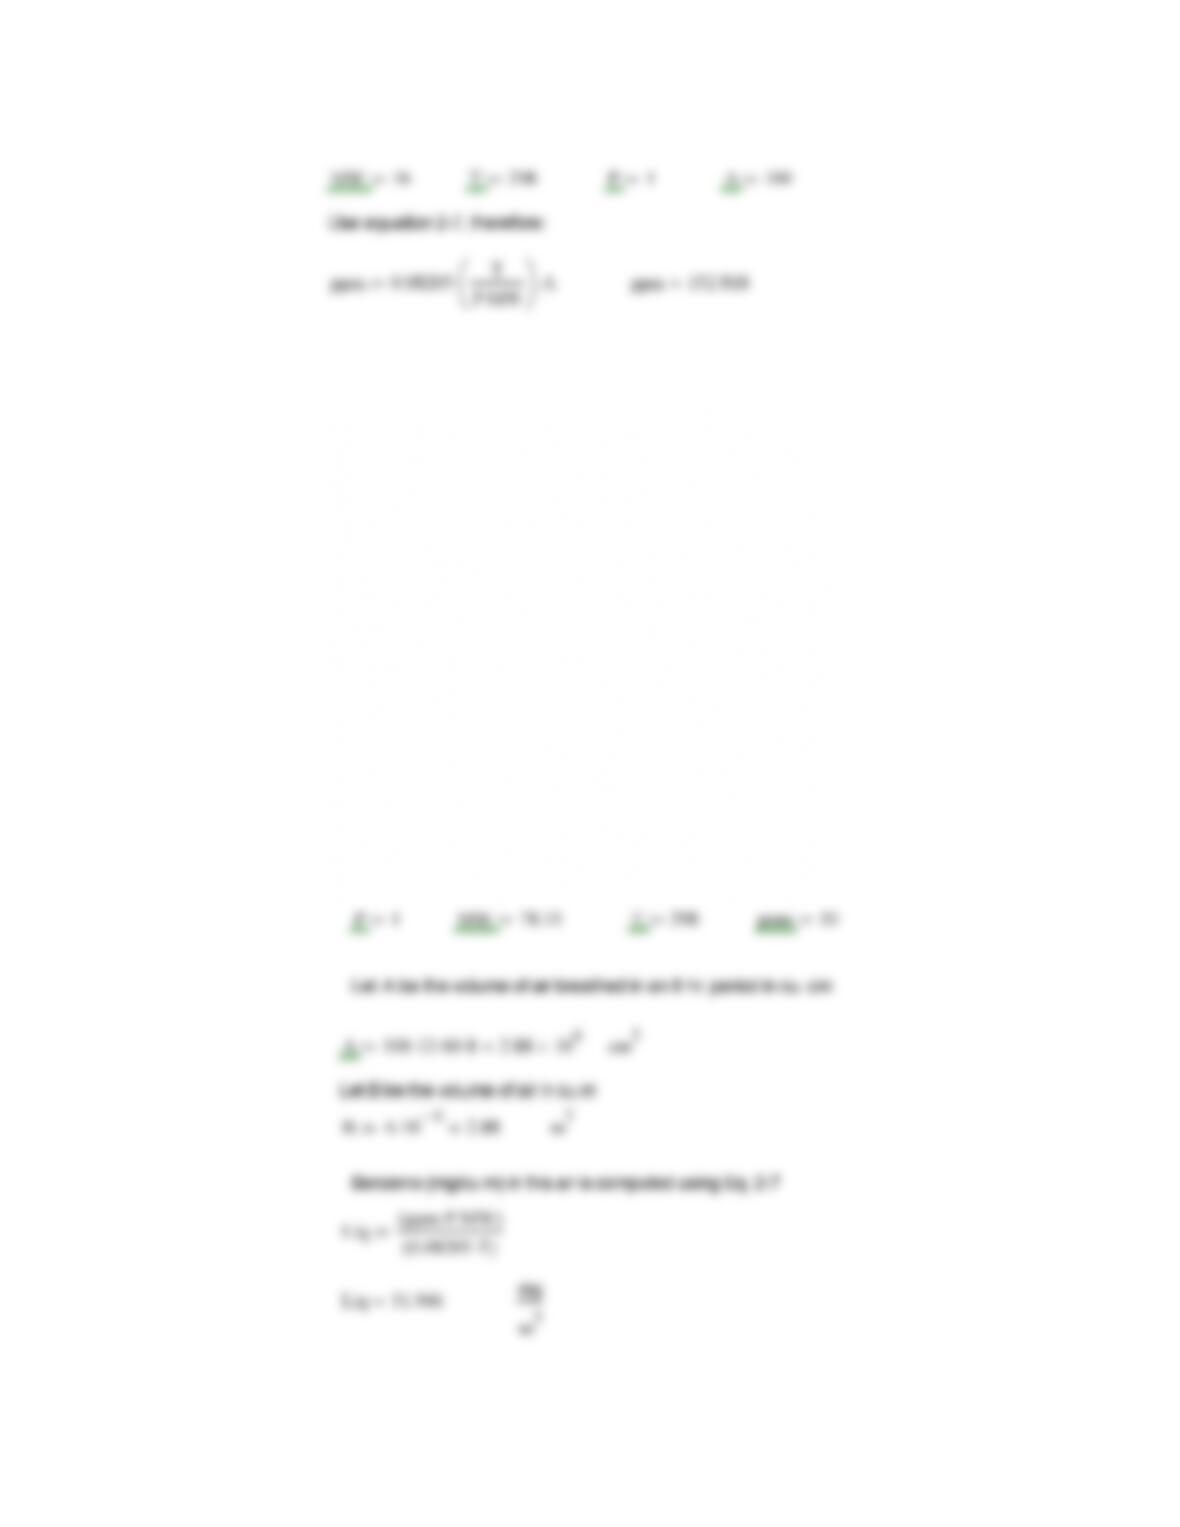
Problem 2-5. A volatile substance evaporates from an open container into a room
of volume 28.3 m3. The evaporation rate is 100 mg/min. If the air in the room is
assumed to be well mixed, how many m3/min of fresh air must be supplied to ensure
that the concentration of the volatile is maintained below its TLV is 100 ppm? The
temperature is 25 deg. C, and the pressure is 1 atm. The volatile molecular weight of
100. Under most circumstances the air in a room cannot be assumed to be well
mixed. How would poor mixing affect the quantity of air required?
Solution for 2-5.
End of Problem 2-5.
Problem 2-6.
If 500 workers in a plant are exposed to the following concentrations of ammonia
for the given number of hours, how many deaths will be expected?
a to d) 1000 ppm for 1 hr., 2000 ppm for 2 hr., 300 ppm for 3 hr., and 150 ppm
for 2 hr.
Repeat this problem with the concentrations given in a., but assume the
times are 2, 4, 6, and 2 hours.
Solution 2-6.
Use the data given in Table 2-5:
End of Problem 2-6.
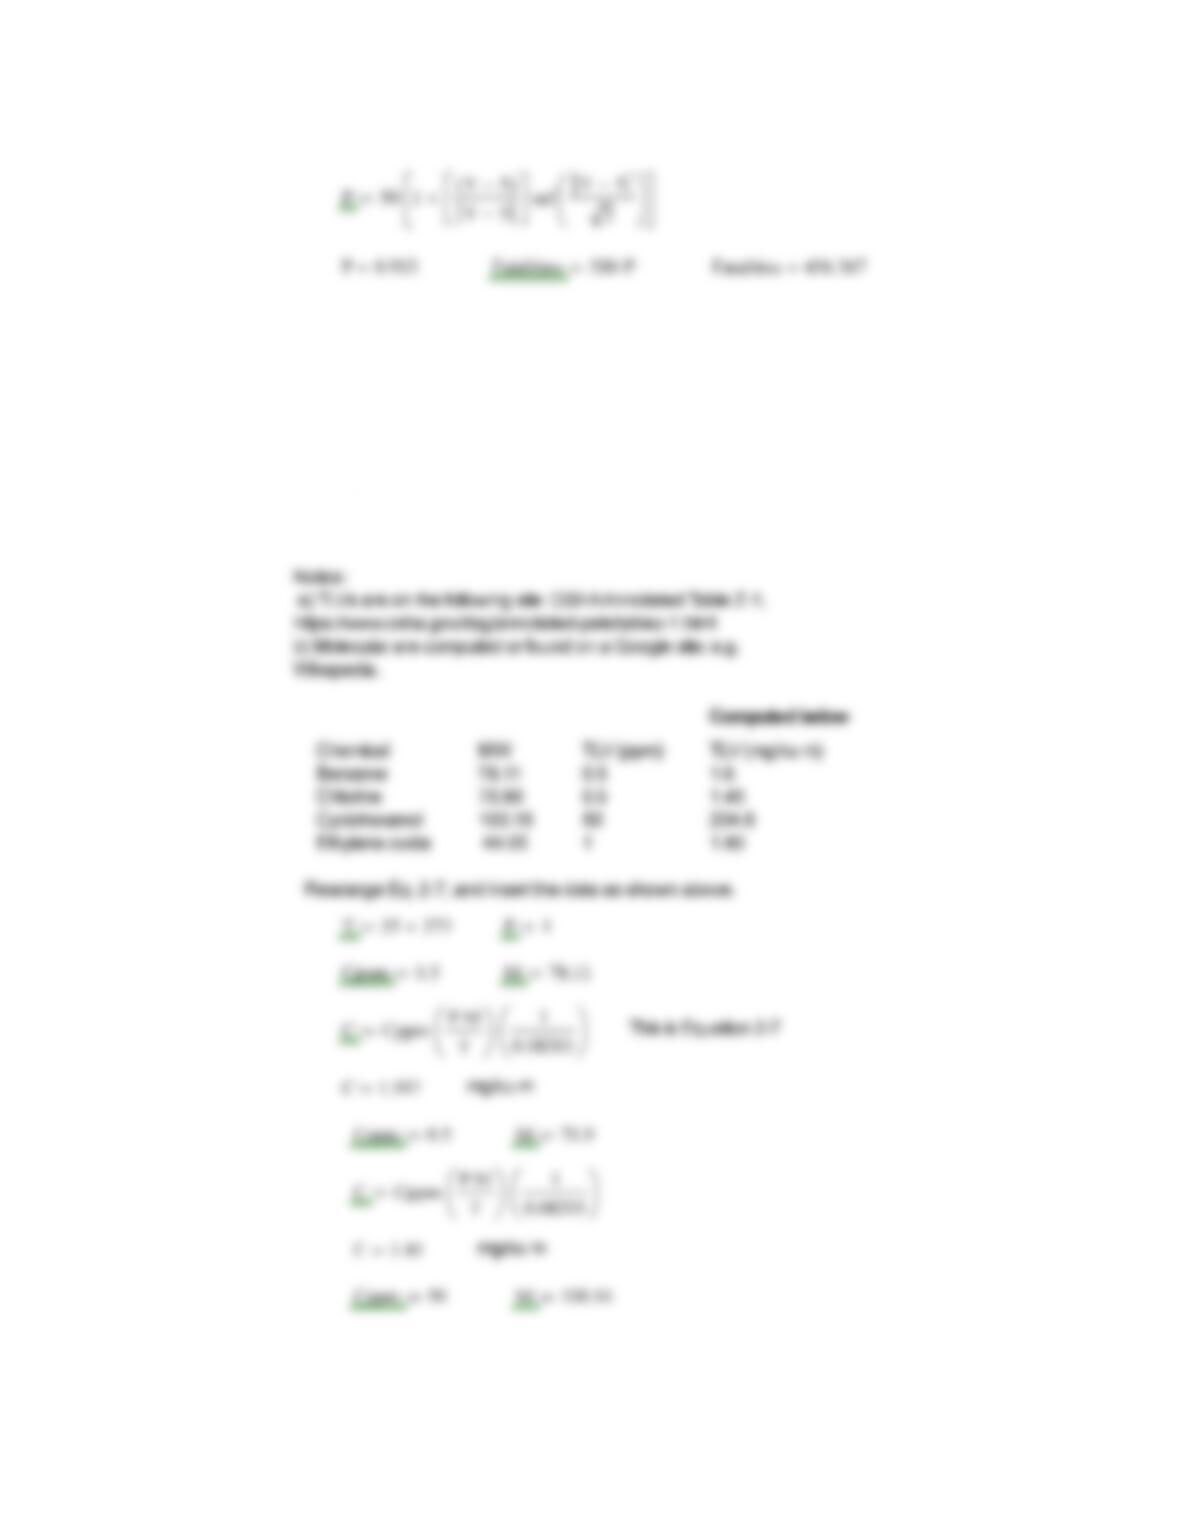
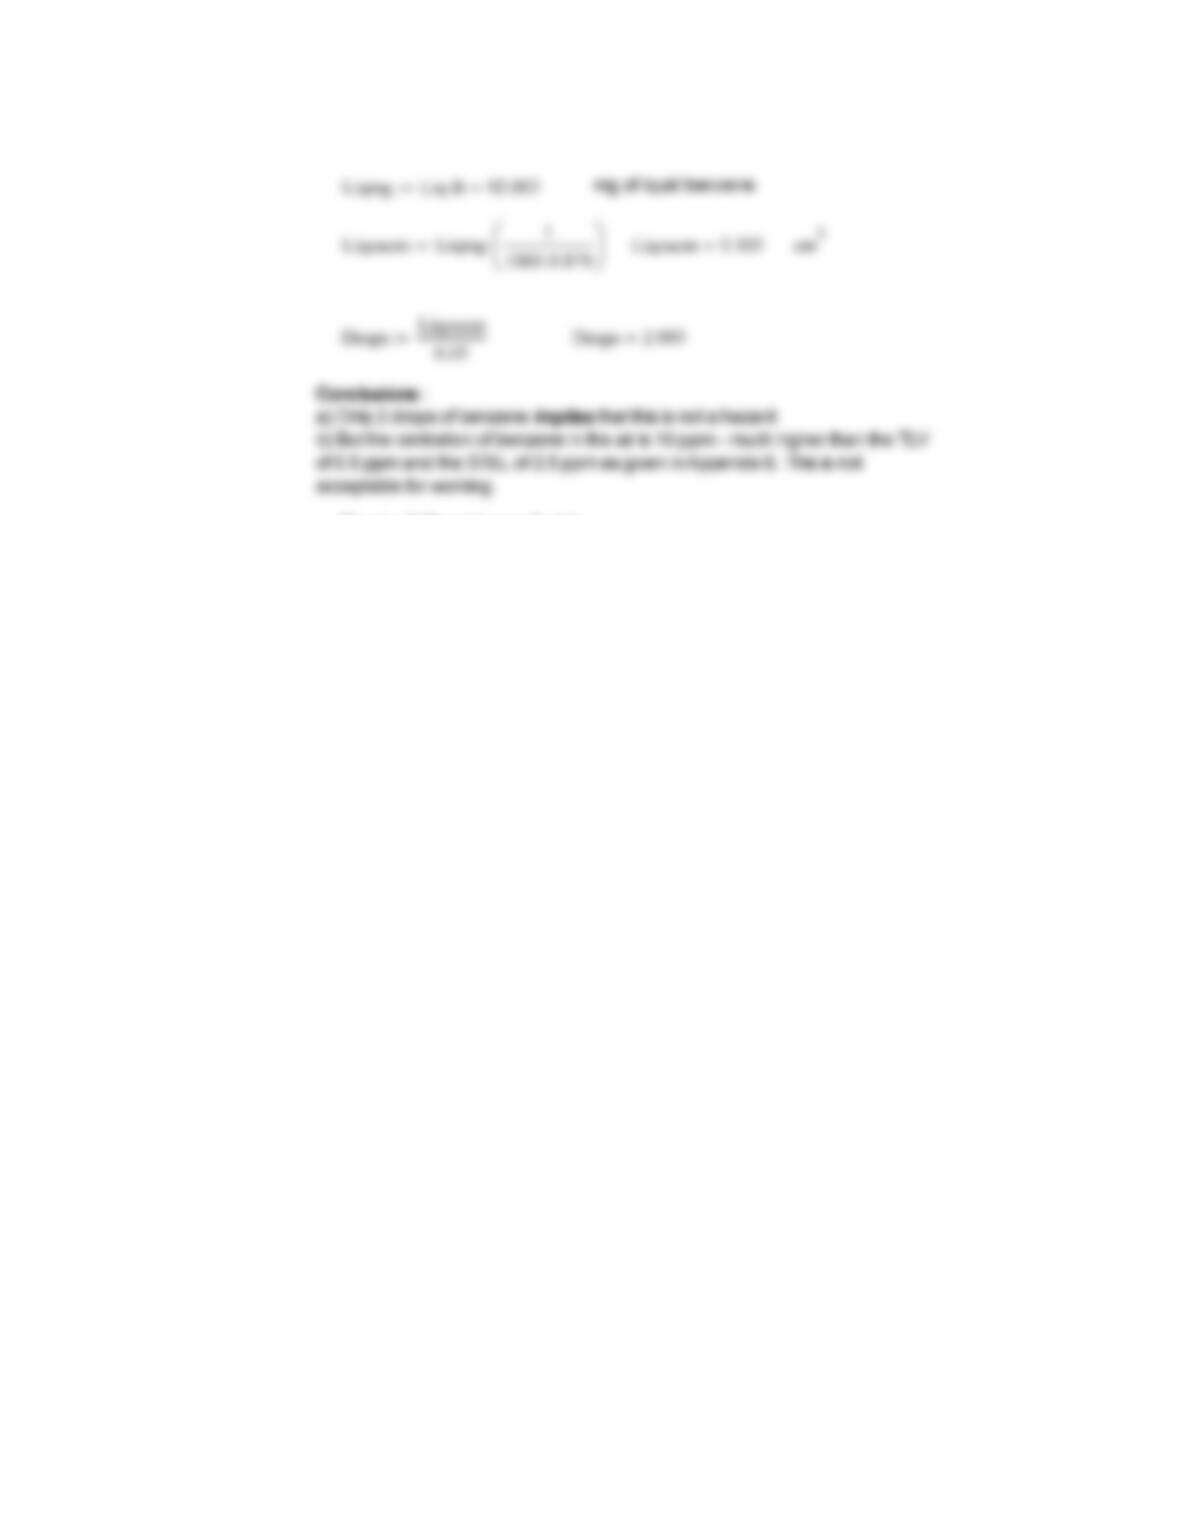
Problem 2-7. Use OSHA data for TLVs and convert TLV in ppm to mg/ m3 for benzene,
chlorine, cyclohexanol, and ethylene oxide. Assume a temp of 25 deg. C and pressure of 1 atm.
Solution 2-7.
T
0.08205
C 1.801mg/cu m End of Problem 2-7.
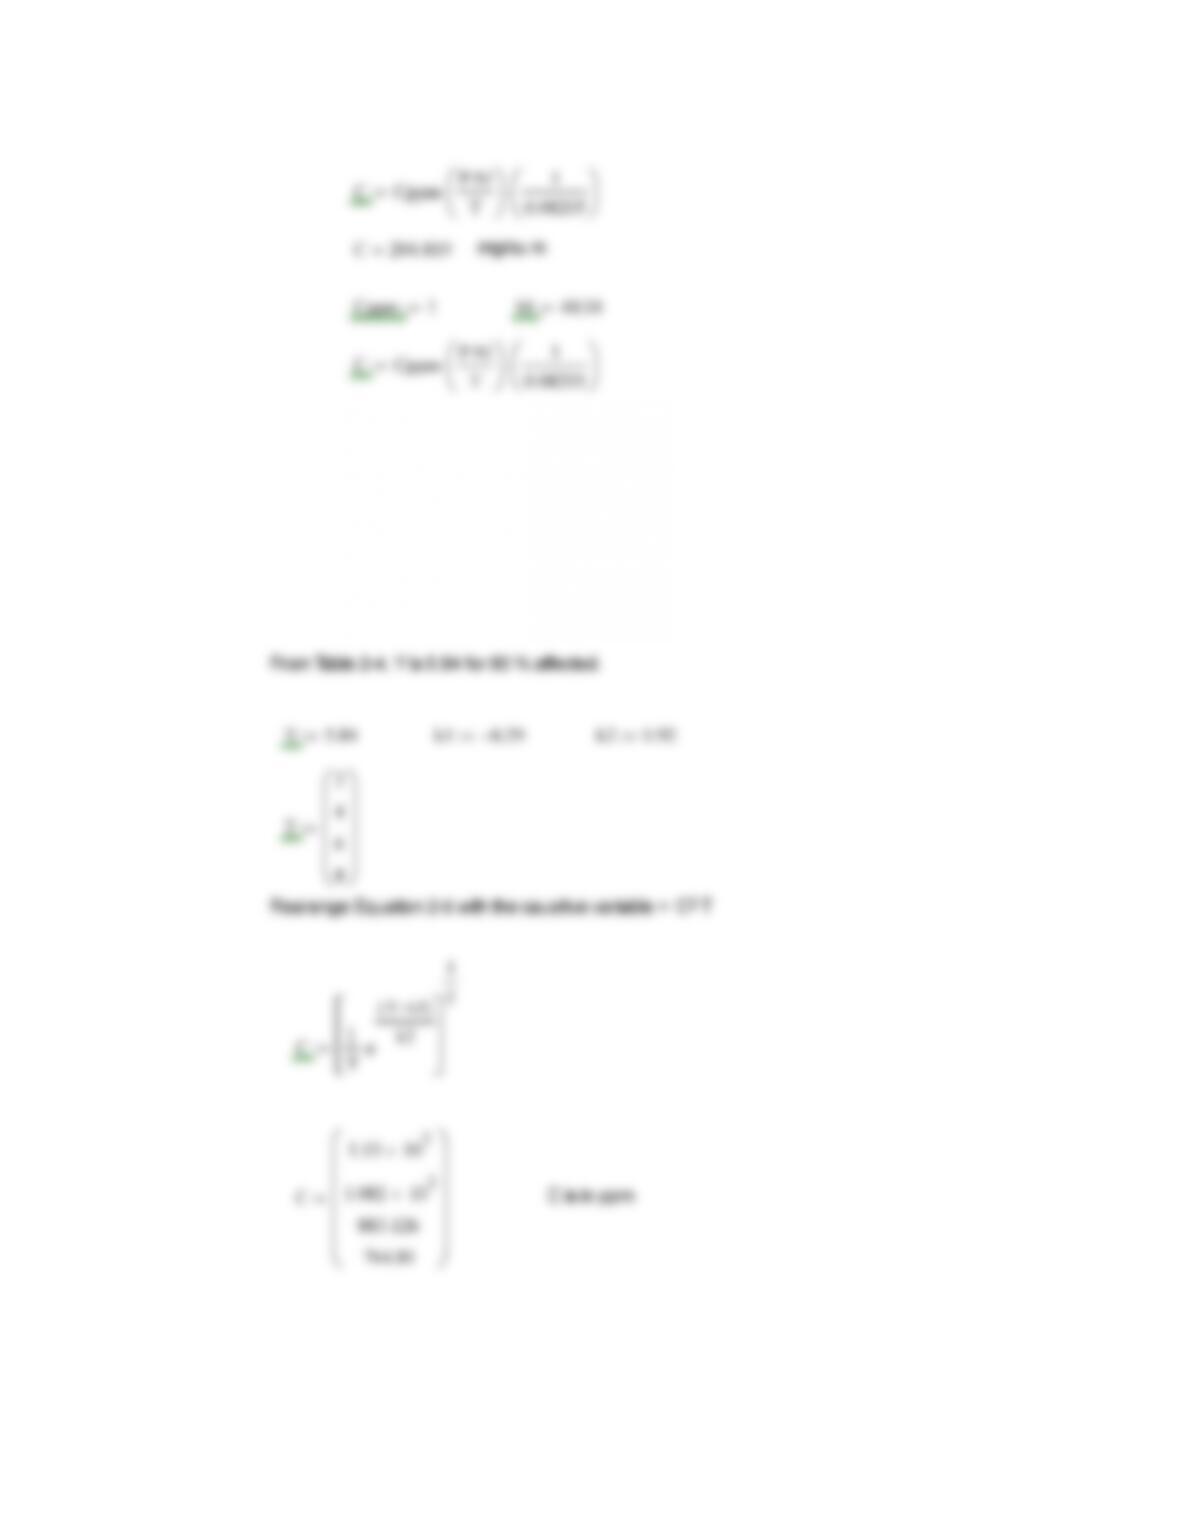
Problem 2-8. Estimate four exposure concentrations in ppm that will result in
fatalities for 80% of the exposed individuals if they are exposed to chlorine for 2, 4,
6, 8 min.
Solution 2-8.
883.126
764.81
End of Problem 2-8.
Problem 2-9. Determine the deaths resulting from the following exposures
to chlorine: a) 200 ppm for 150 min, b) 100 ppm for 50 min, and c) 50 ppm for
20 min.
Solution 2-9.
YA 5
erf YA 5
2
End of Problem 2-9.
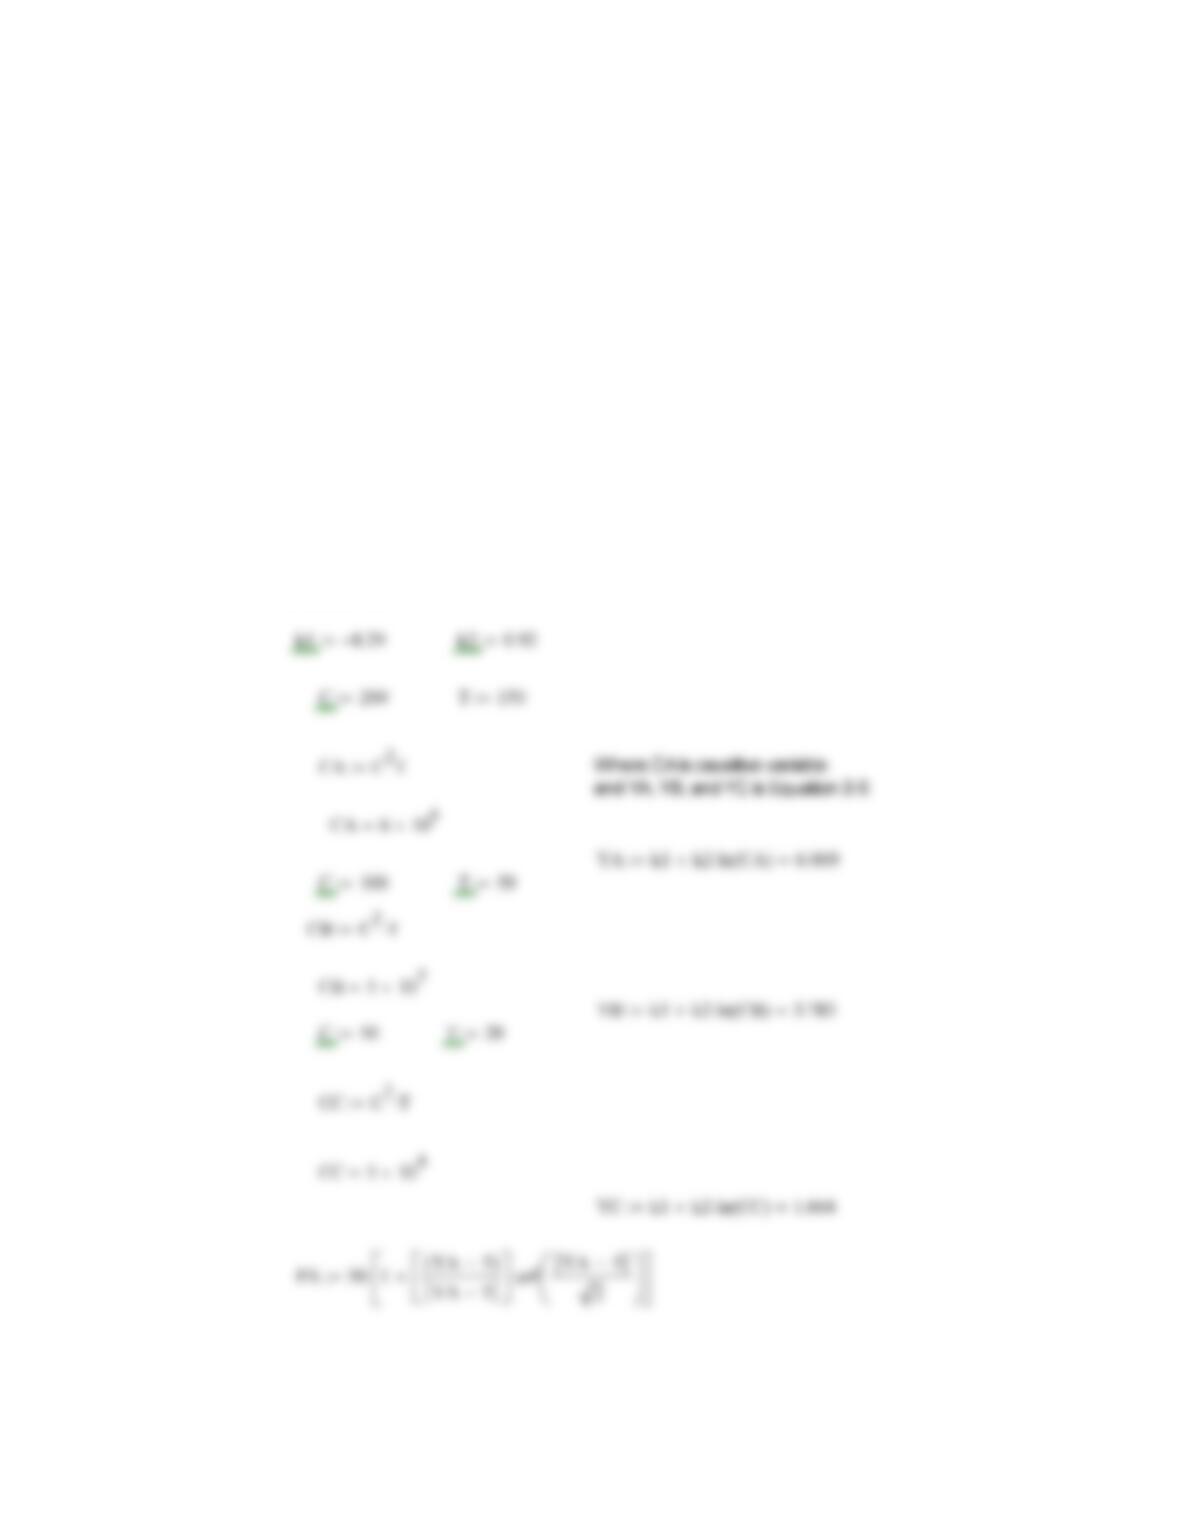
Problem 2-10. The peak overpressure expected as a result of the
explosion of a tank in a plant facility is approximated by the equation
log 7.1094 1.8log ,Pr
Where P is the overpressure in N/m
2
and r is the distance from
the blast in meters. The plant employs 500 people who work in
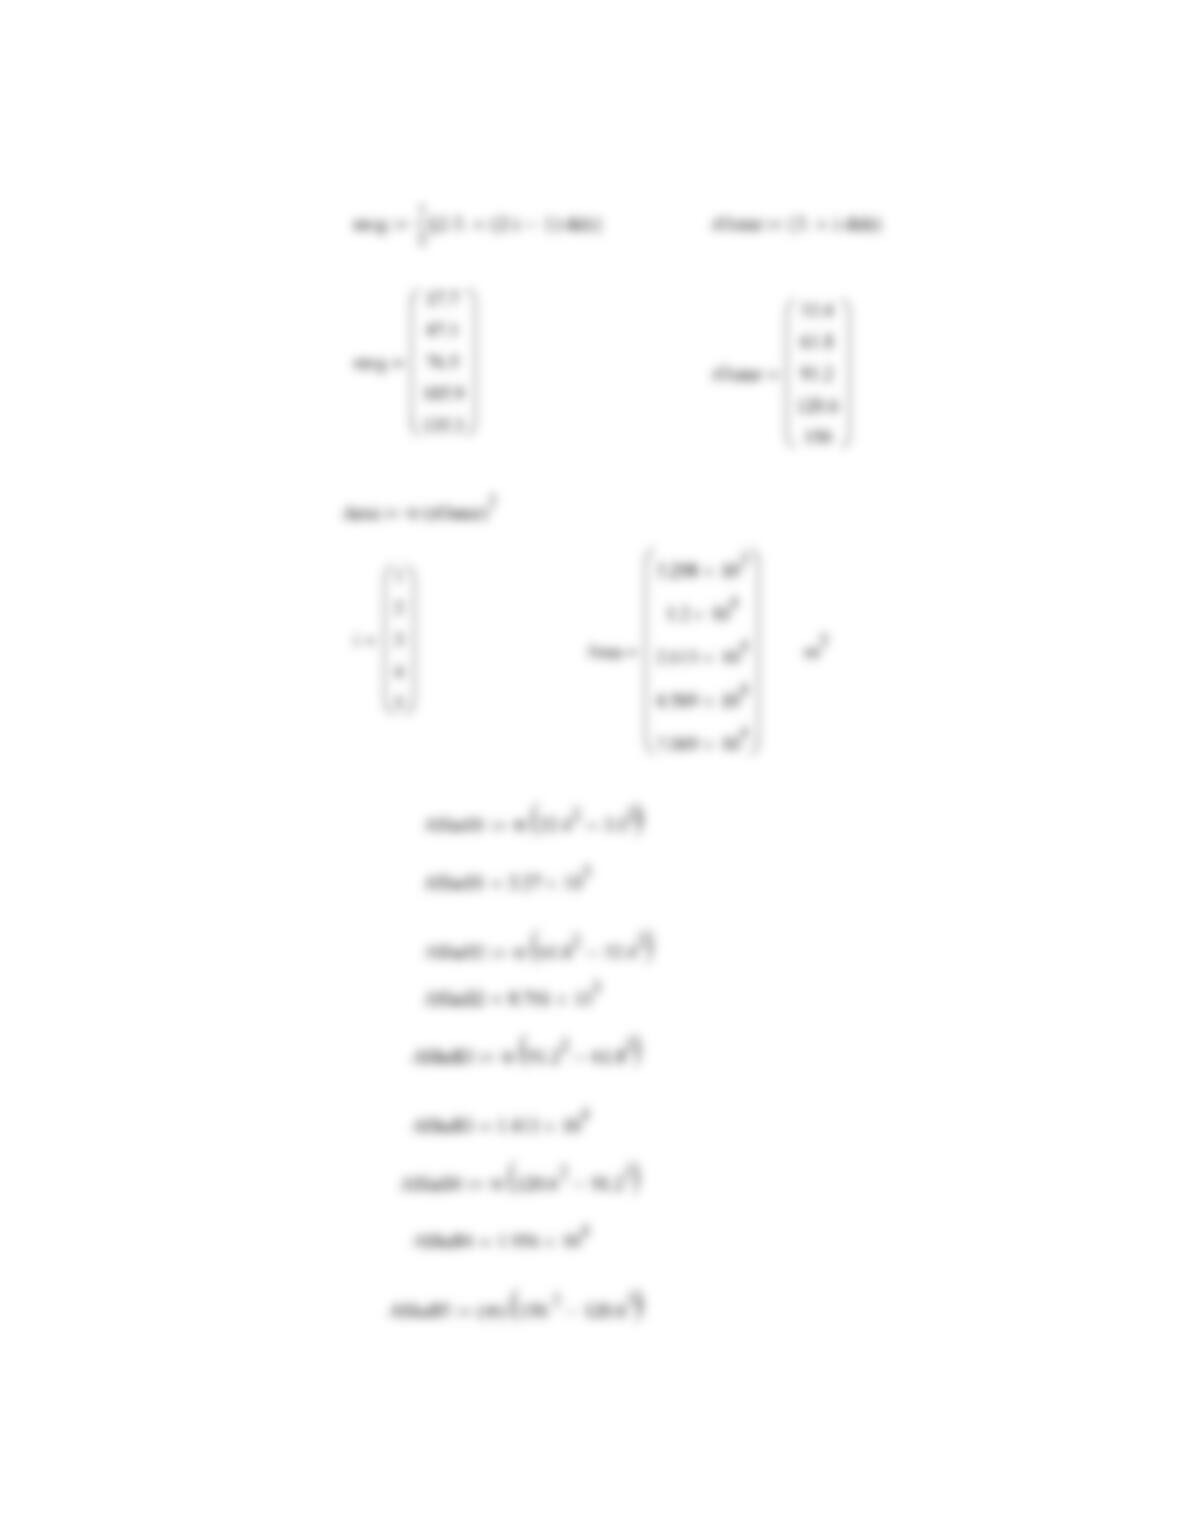
an area from 3 to 150 m from the potential blast site. Estimate
the number of fatalities due to lung hemorrhage as a result of
this blast. Assume there are 5 shells around the center and the
people are evenly distributed through the area.
Solution.
5
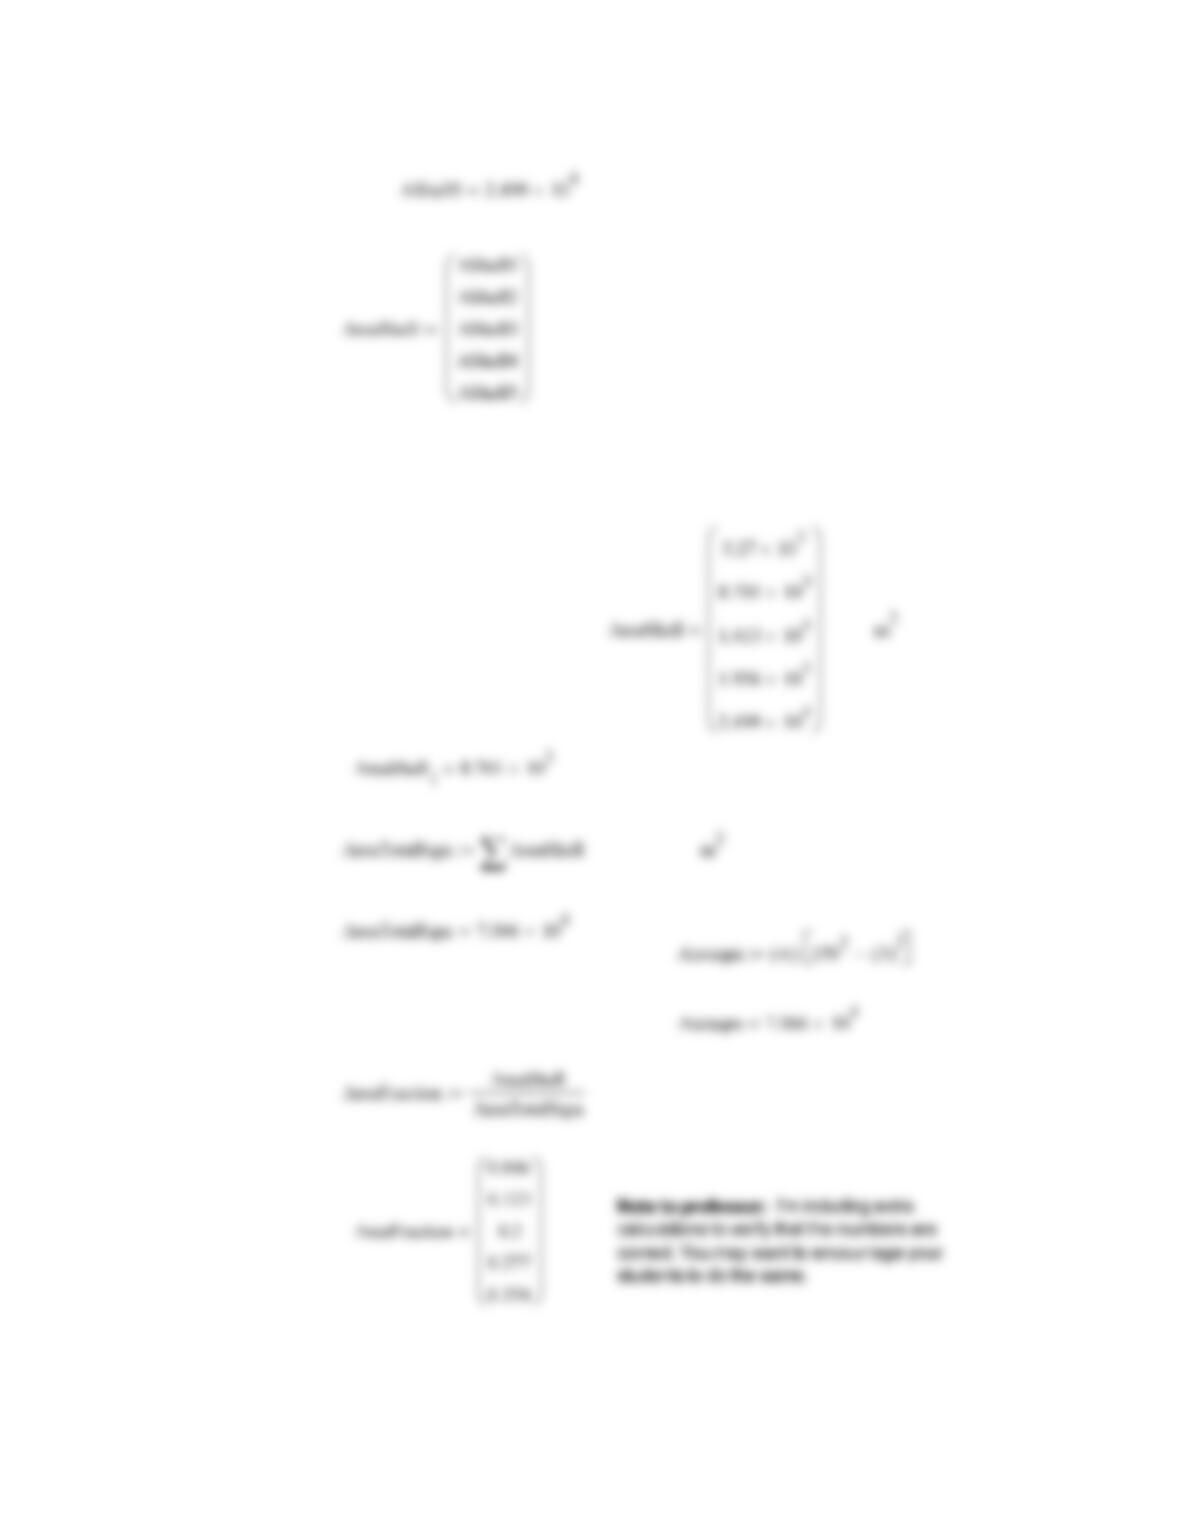
correct. You may want to encourrage your
students to do the same.
0.277
0.354
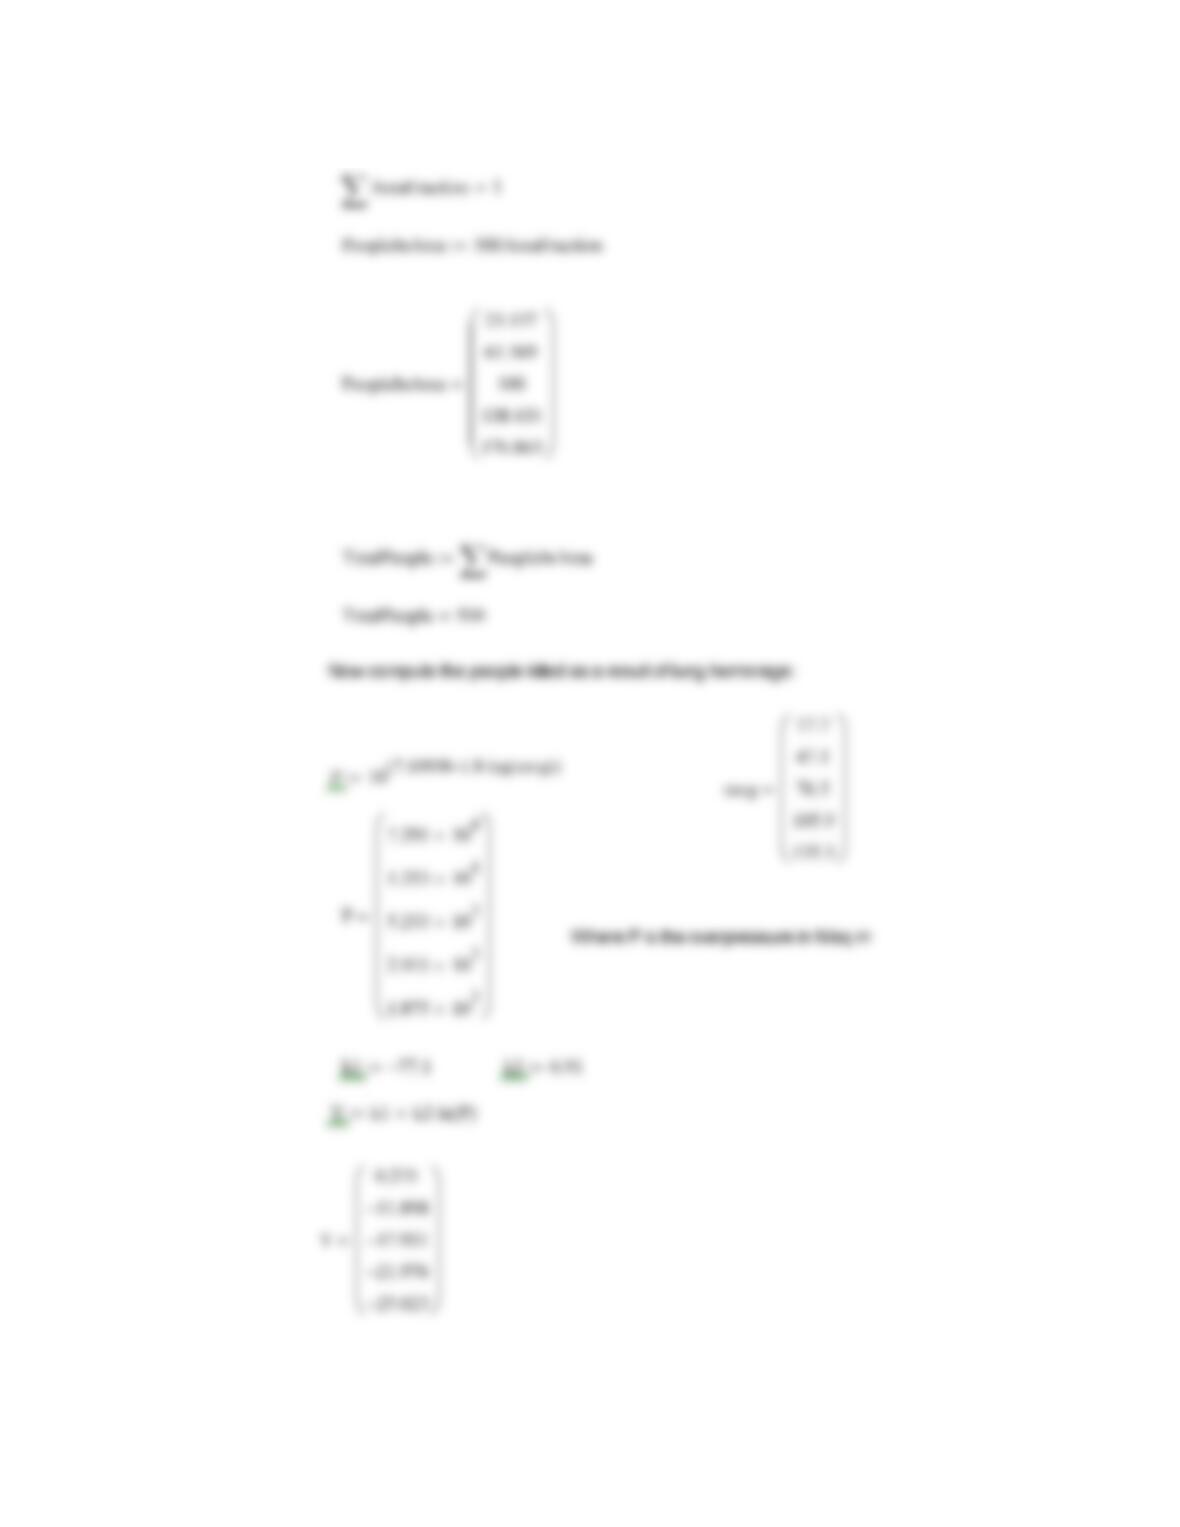
21.976
25.023
Y5
erf Y5
2
Note: The negative Probits correspond to a Probability of ZERO.
45.239
32.975
23.137
61.569
Note to Professor: You should ask the students to repeat the calculation
with more shells; at some point the answer should stabalize.
End of Problem 2-10
Problem 2-11. Use this book’s appendix to determine the hazardous
properties of ammonia; i.e. TLV-TWA, TLV-STEL, TLV-C, PEL, and the
NFPA daimond ratings.
Solution.
End of Problem 2-11
Problem 2-12. At what overpressure (Pa and psi) would 50% of
structures be damaged?
Solution.
End of Problem 2-12
Problem 2-13. For methane in air at 1 atm and 298 K, how many ppm
is 100 mg/m3?
Solution.
PMW
End of Problem 2-13
Problem 2-14. Humans breathe about 500 ml of air per breath and take
about 12 breaths per minute during normal activities. If a person is
exposed to an atmosphere containing benzene at a concentration of 10
ppm (by volume), how many grams of benzene will be deposited in the
lungs during an 8–hour shift if all the benzene that enters remains in the
lungs? How many drops of liquid is this? A drop of liquid contains about
0.05 cm3. The specific gravity of benzene is 0.879. If you were the
worker, would this be acceptable?
Solution.
End of Problem 2-14