D-32 ⚫ PART 2 ⚫ ManagingCustomer Demand
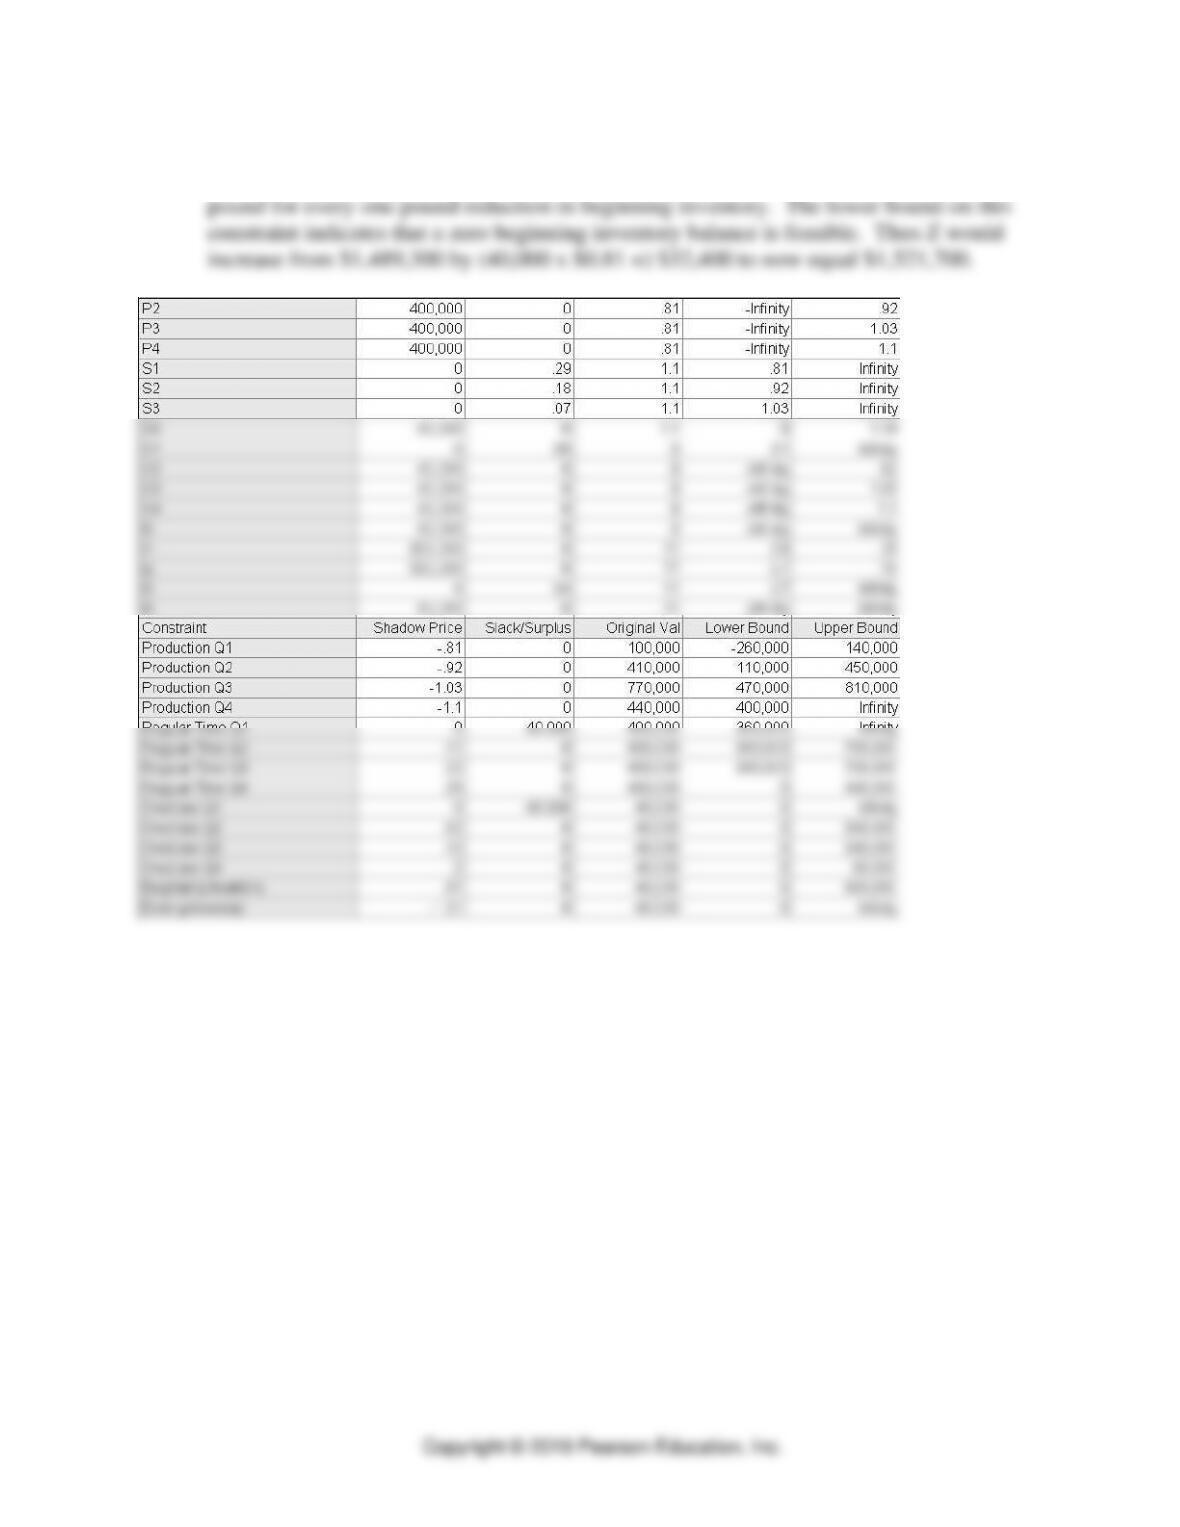
d. The Ranging Screen for the above solution is shown below. Note that the shadow price of
the beginning inventory constraint indicates that the value of Z will increase by $0.81 per
Linear Programming ⚫ SUPPLEMENT D ⚫
D-41
23. Supertronics Inc.
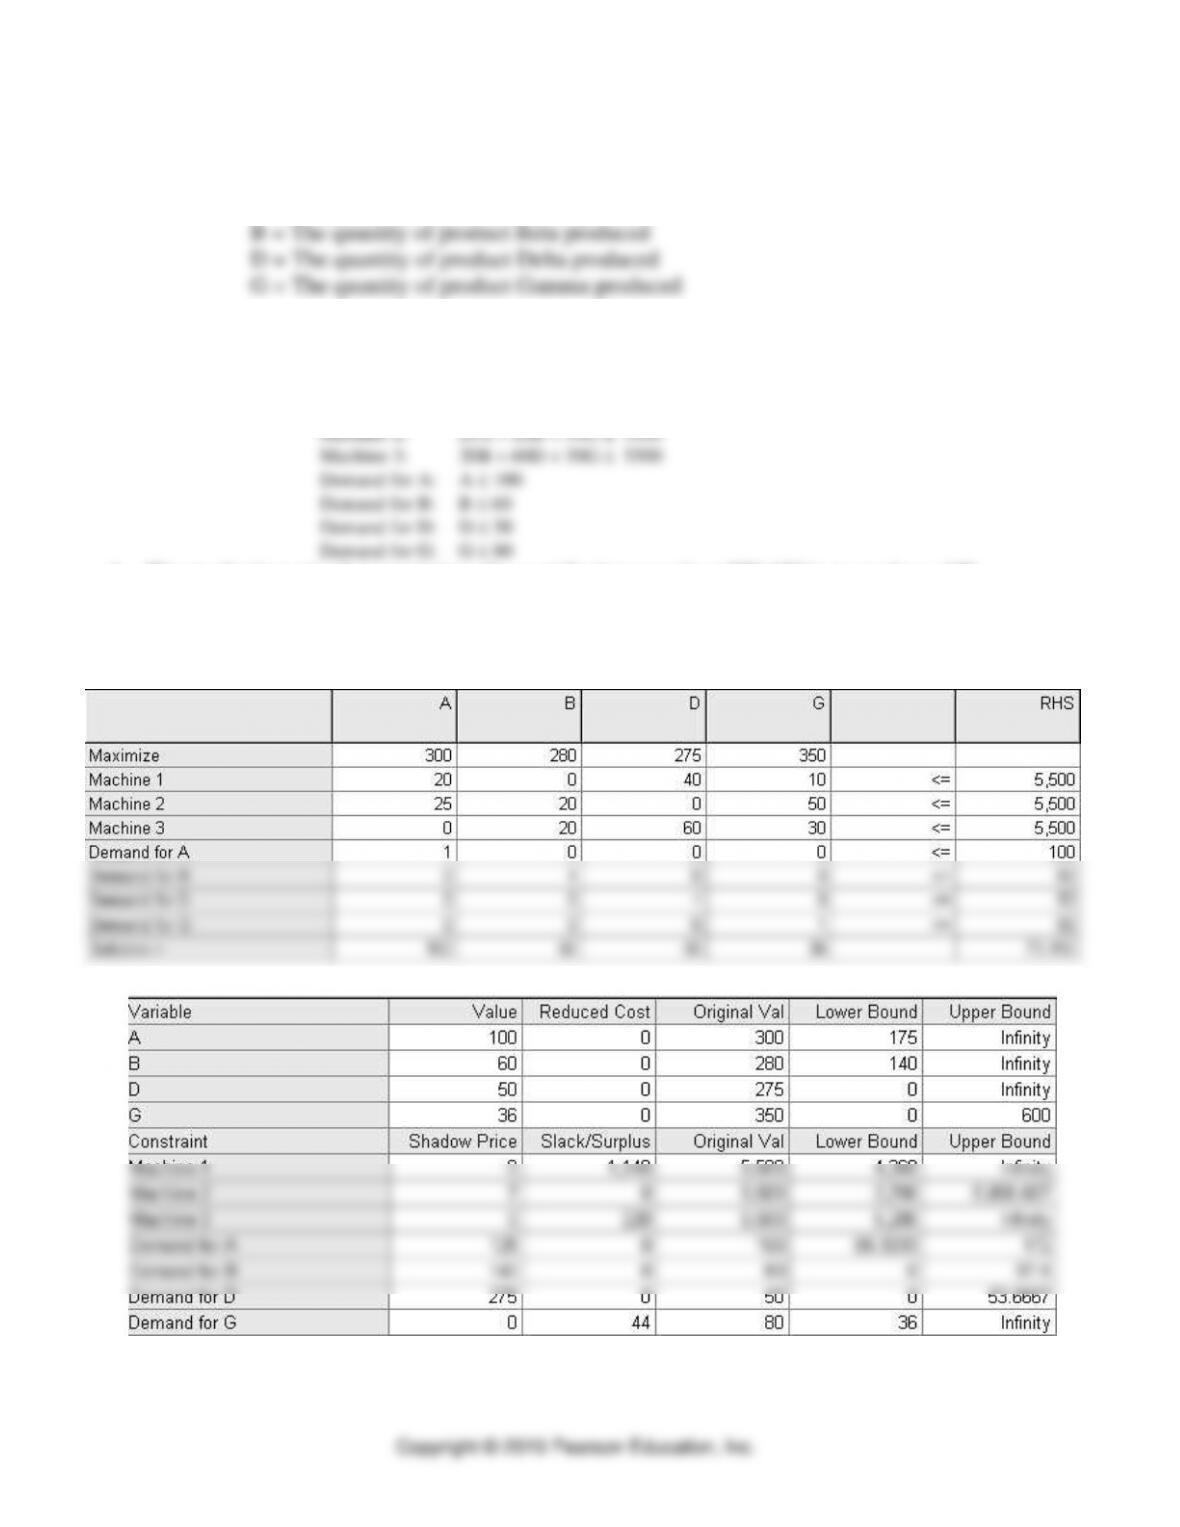
a. The four decision variables required for this problem are:
A = The quantity of product Alpha produced
The LP formulation is:
Minimize: Z = 300A + 280B + 275D + 350G
Subject to: Machine 1: 20A + 40D + 10G 5500
b. The production mix that maximizes the contribution margin at $73,150 is to produce: 100
Alpha, 60 Beta, 50 Delta, and 36 Gamma.
The POM for Windows Linear Programming Module’s Results Screen and Ranging Screen:
⚫ PART 2 ⚫ ManagingCustomer Demand
D-40
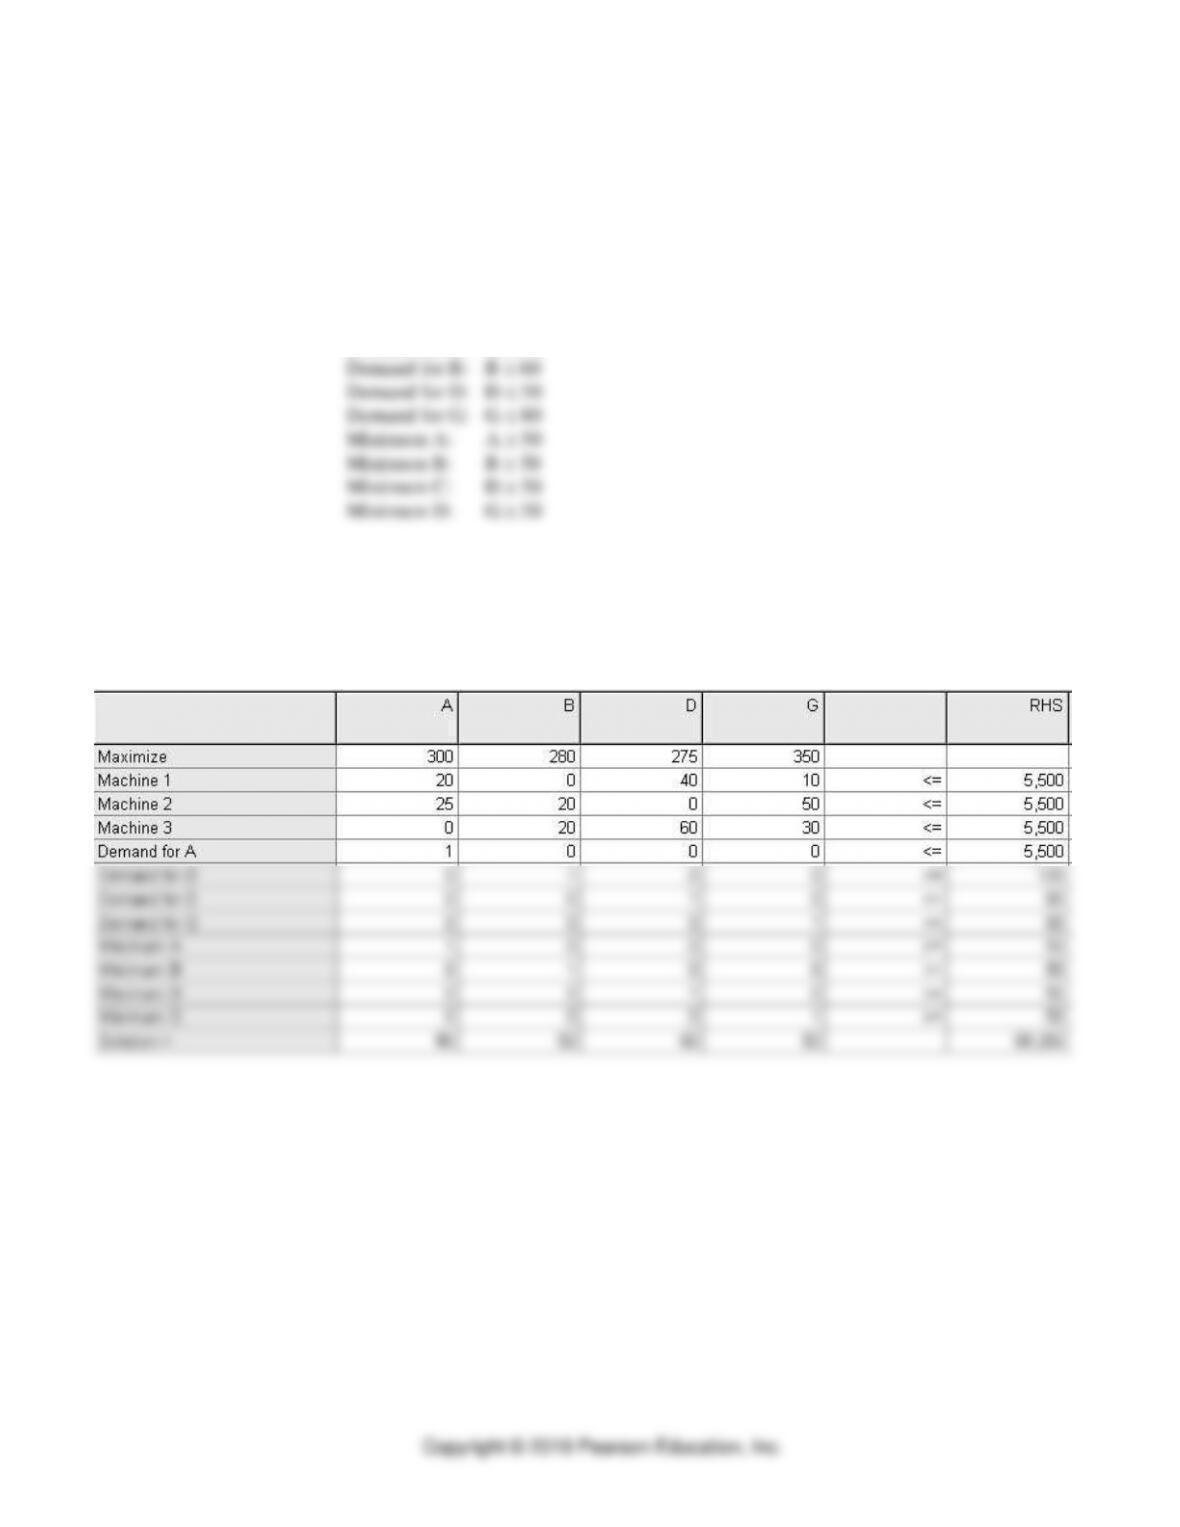
c. As seen in the Ranging Screen, Machine 2 has no surplus and is thereby the bottleneck.
d. The new formulation contains 4 additional constraints:
Minimize Z= 300A + 280B + 275D + 350G
Subject to: Machine 1: 20A + 40D + 10G 5500
Machine 2: 25A + 20B + 50G 5500
Machine 3: 20B + 60D + 30G 5500
Demand for A: A 100
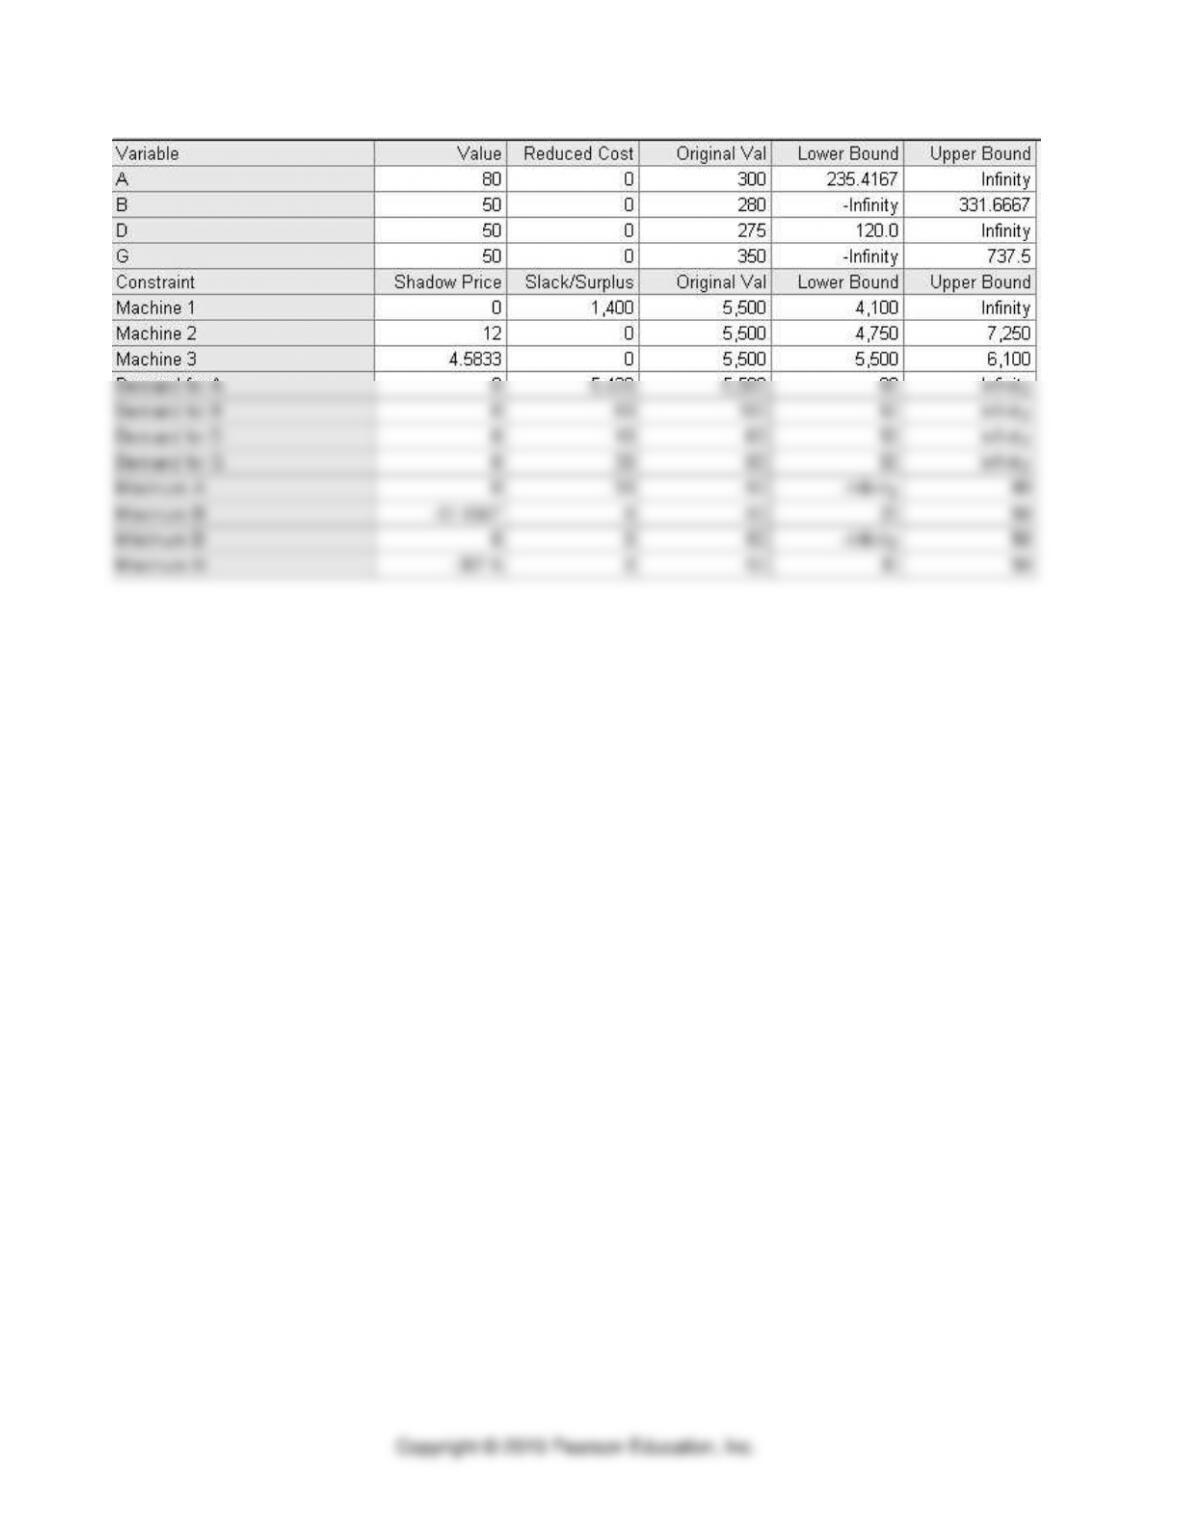
The new production mix that maximizes the contribution margin at $69,250 is to produce:
80 Alpha, 50 Beta, 50 Delta, and 50 Gamma. The new bottleneck is both machine B and
machine C. The POM for Windows Linear Programming Module’s Results Screen and
Ranging Screen follow:
Linear Programming ⚫ SUPPLEMENT D ⚫
D-41
⚫ PART 2 ⚫ ManagingCustomer Demand
D-40
24. Bull Grin Company
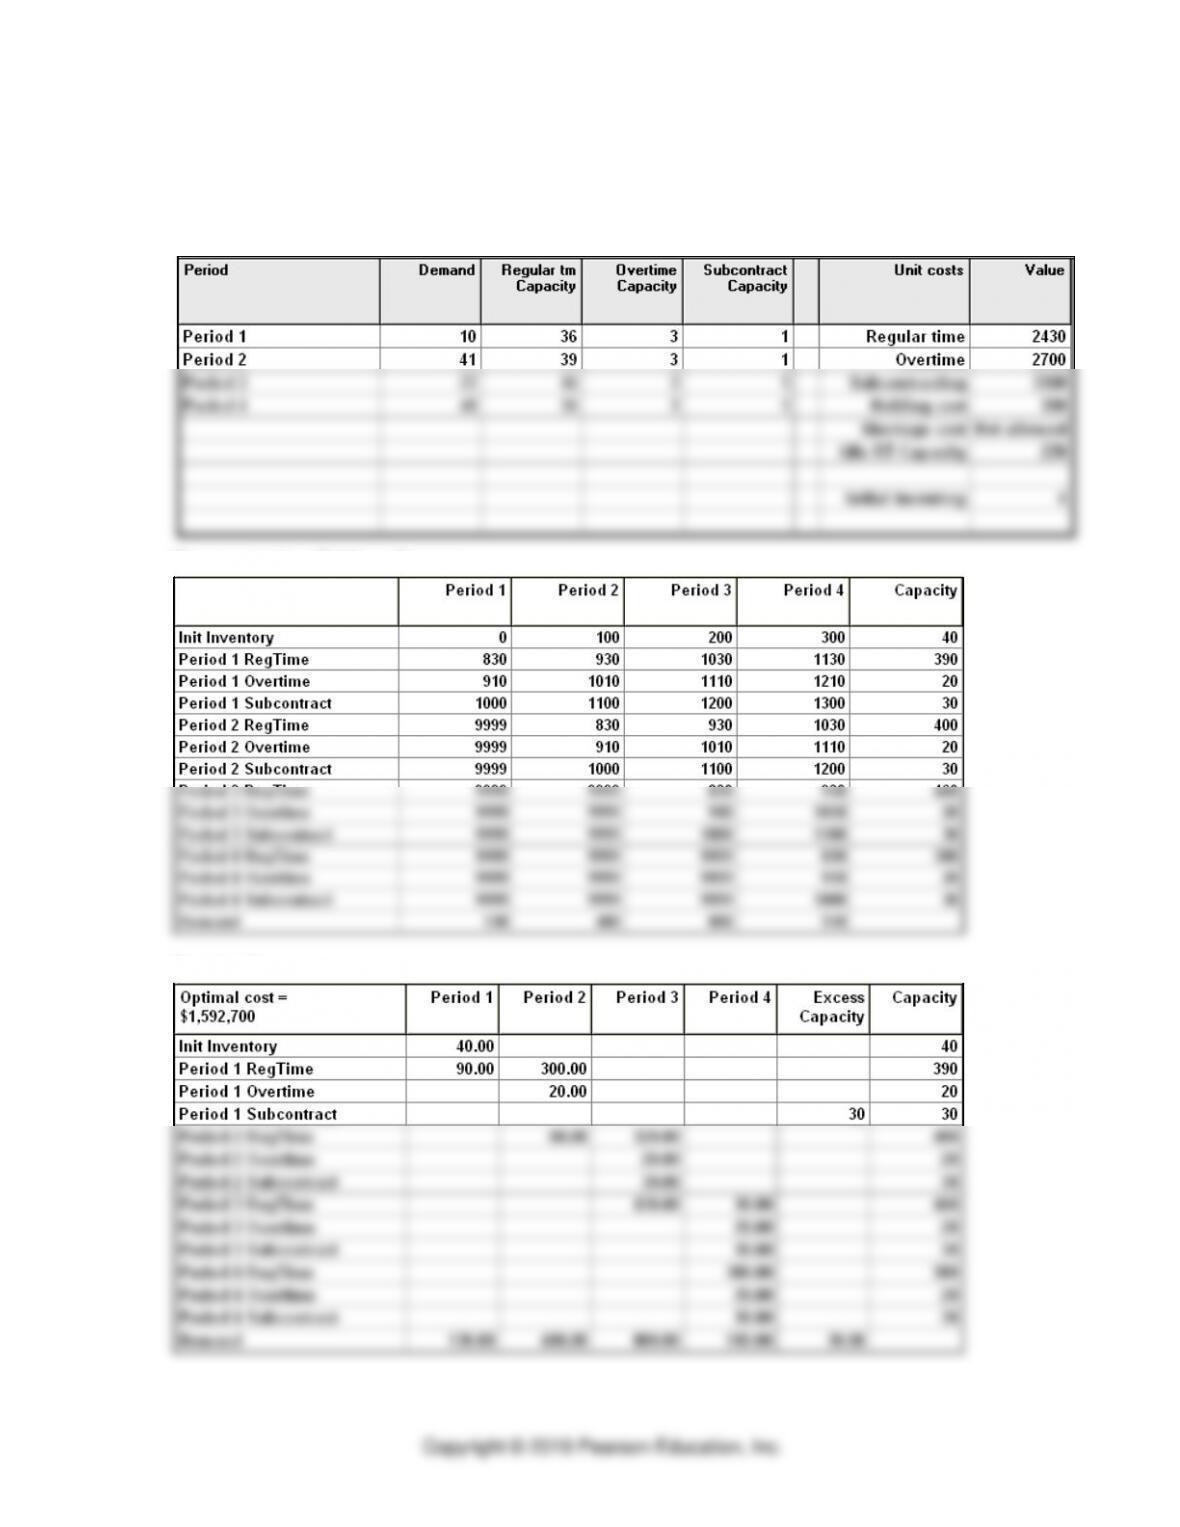
The Transportation Tableau and Results screens found with the Transportation Method
(Production Planning) module in POMS for Windows follow.
Inputs Screen
Transportation Tableau Screen
Results Screen
Linear Programming ⚫ SUPPLEMENT D ⚫
D-41
The Bull Grin production plan, with a total cost of is $1,592,700, can be tabulated as:
Regular-Time
Overtime
Anticipation
Quarter
Production
Production
Subcontracting
Inventory
1
390,000
20,000
0
320,000
2
400,000
20,000
30,000
370,000
3
460,000
20,000
30,000
80,000
4
380,000
20,000
30,000
40,000
Note the fourth-quarter demand is inflated to create the required ending inventory (470 demand
+ 40 inventory) = 510.
25. The Cut Rite Company
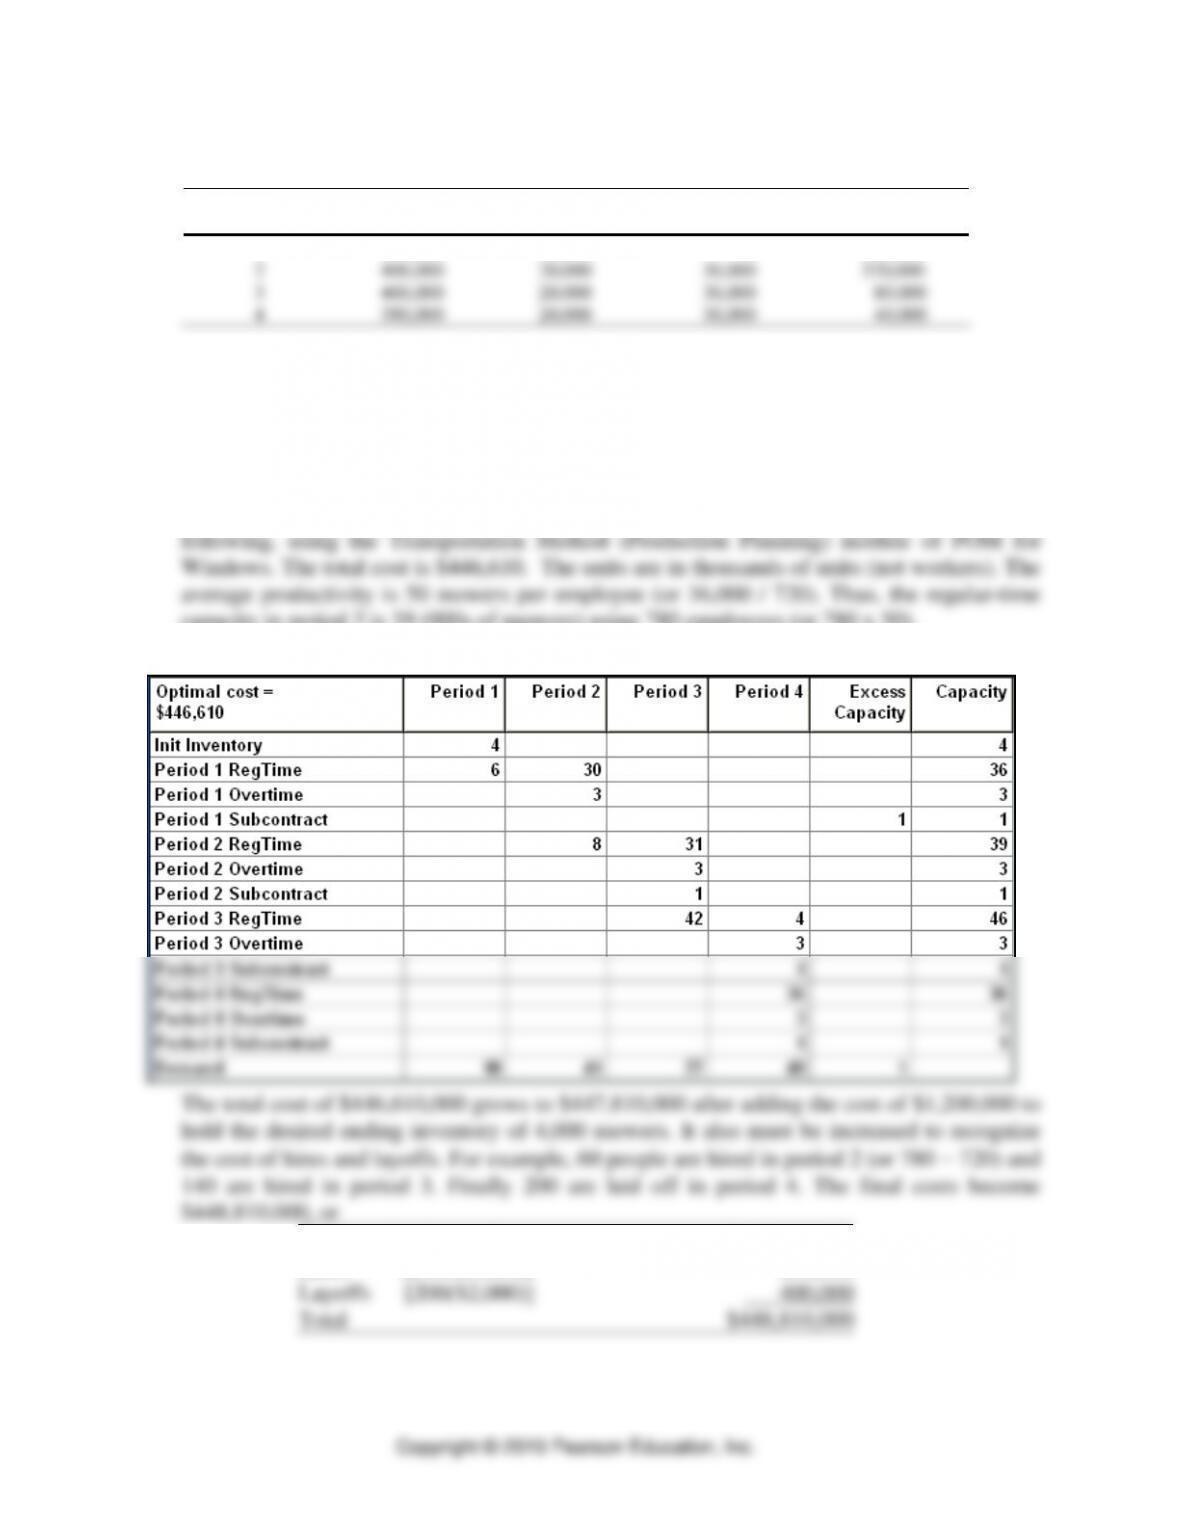
a. Plan 1 versus Plan 2
Plan 1:
The transportation tableau and results screens for the first workforce plan is shown
capacity in period 2 is 39 (000s of mowers) using 780 employees (or 780 x 50).
Input Screen
Total production and inventory costs
$447,810,000
Hires [200($3,000)]
600,000
Layoffs [200($2,000)]
400,000
Total
$448,810,000
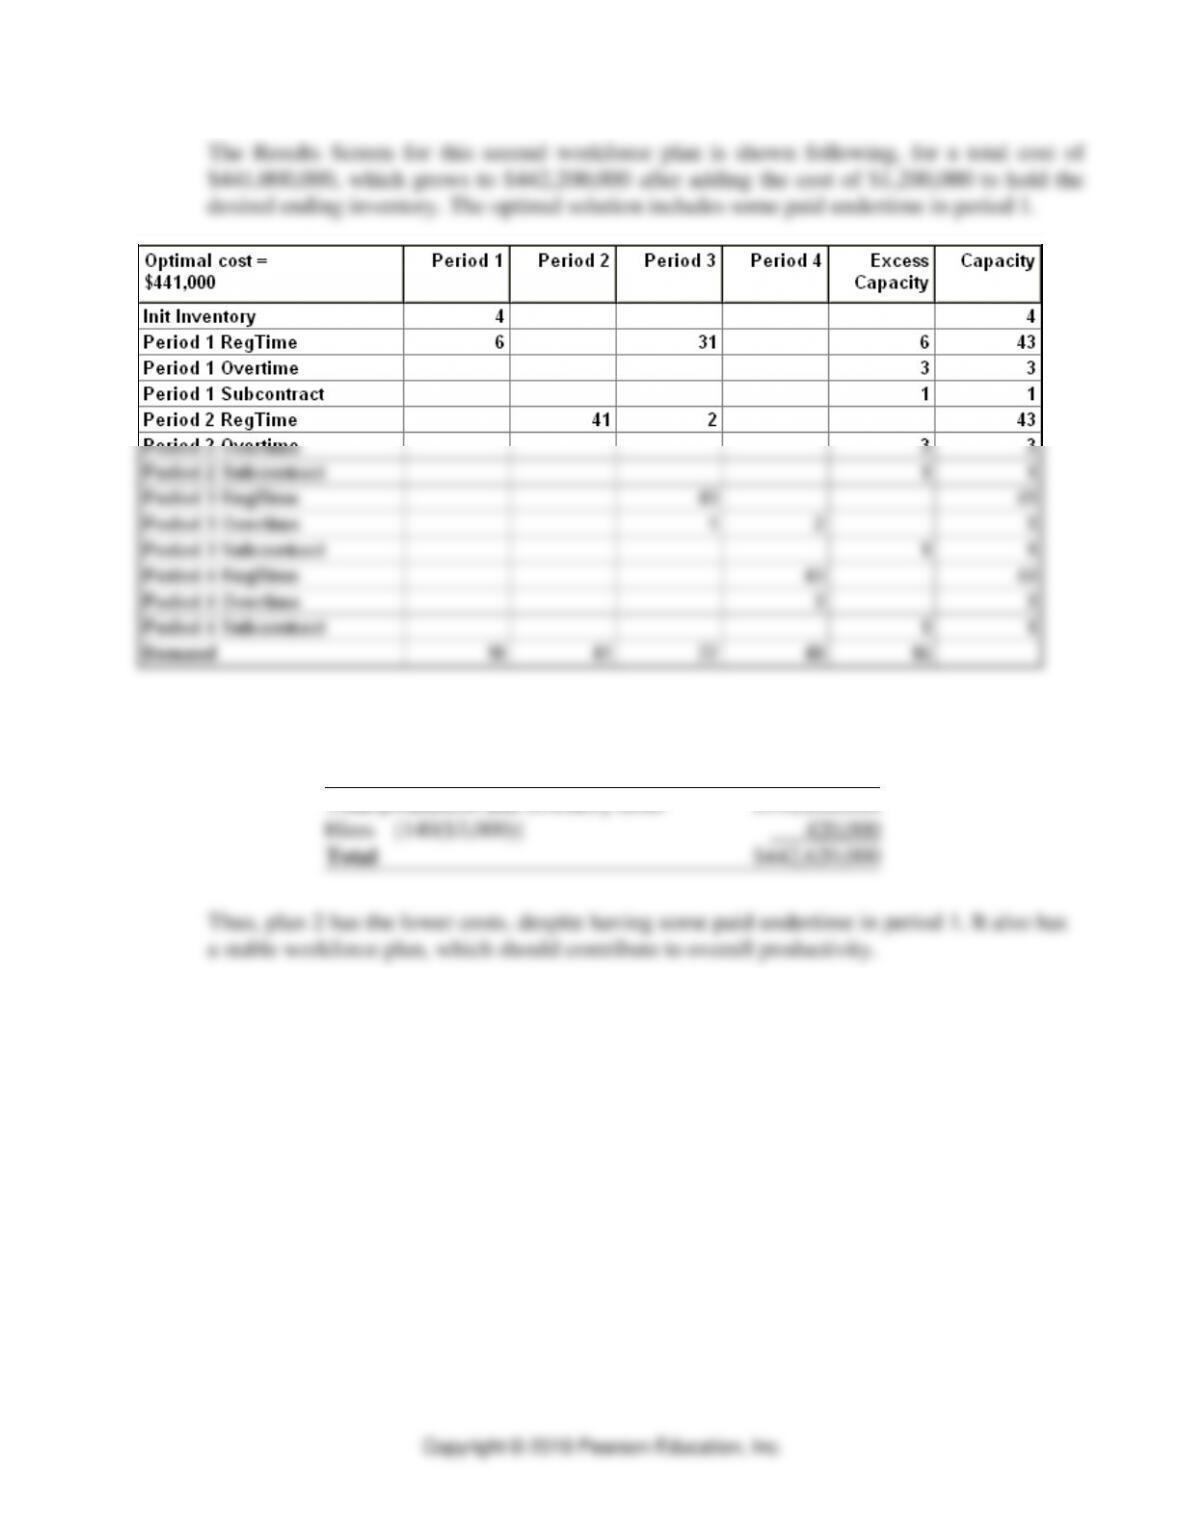
Plan 2:
⚫ PART 2 ⚫ ManagingCustomer Demand
D-40
The Results Screen for this second workforce plan is shown following, for a total cost of
$441,000,000, which grows to $442,200,000 after adding the cost of $1,200,000 to hold the
desired ending inventory. The optimal solution includes some paid undertime in period 1.
The total cost also must be increased to recognize the cost of hiring 140 employees in period
1 (or 860 − 720), resulting in:
Total production and inventory costs
$442,200,000
Hires [140($3,000)]
420,000
Total
$442,620,000
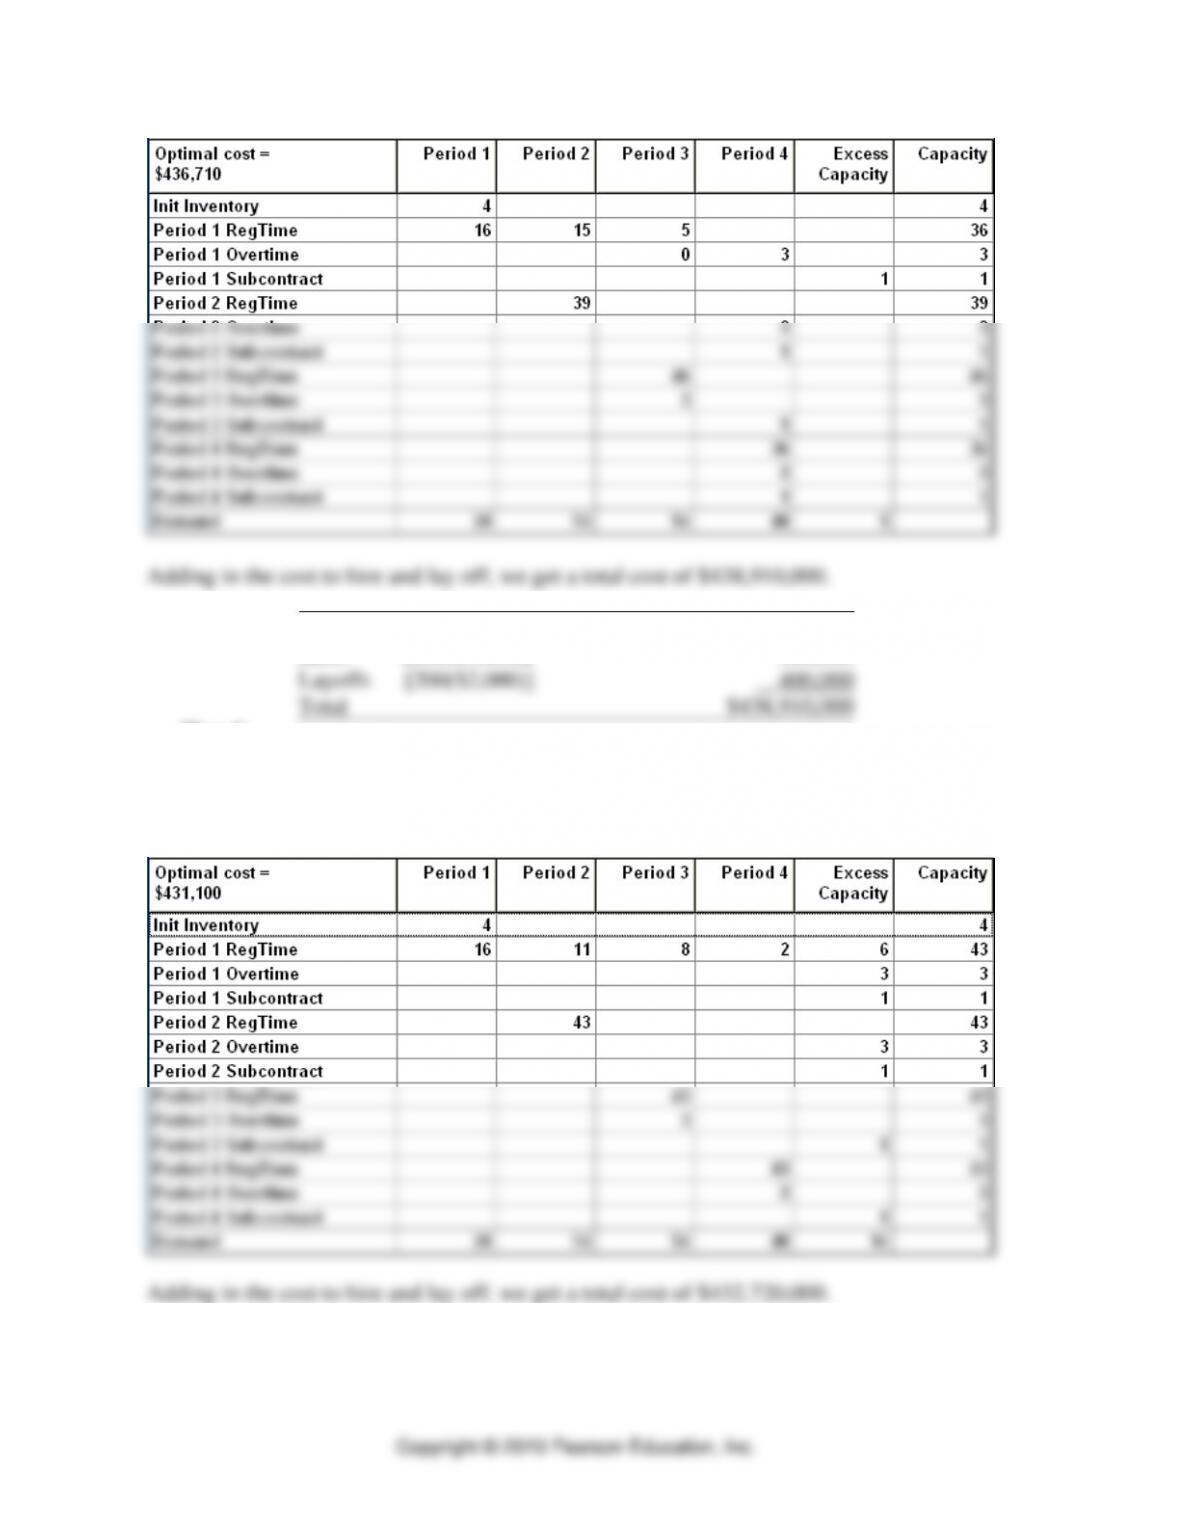
b. Cut Rite with creative pricing
Plan 1:
The optimal solution for the first workforce plan with the revised demands is shown
following, for a total cost of $436,710,000. The total cost grows to $437,910,000 after
adding the cost of $1,200,000 to hold the desired ending inventory.
Linear Programming ⚫ SUPPLEMENT D ⚫
D-41
Total production and inventory costs
$437,910,000
Hires [200($3,000)]
600,000
Layoffs [200($2,000)]
400,000
Total
$438,910,000
Plan 2:
The optimal solution for the second workforce plan with the revised demands is shown
following, for a total cost of $431,100,000. The total cost grows to $432,300,000 after
adding the cost of $1,200,000 to hold the desired ending inventory.
⚫ PART 2 ⚫ ManagingCustomer Demand
D-40
Total production and inventory costs
$432,300,000
Hires [140($3,000)]
420,000
Total
$432,720,000
If creative pricing is used, staffing Plan 2 should still be used because it has the lower costs
(compared to staffing Plan 1). The savings between the original Plan 2 demand schedule and
26. Holloway Calendar Company
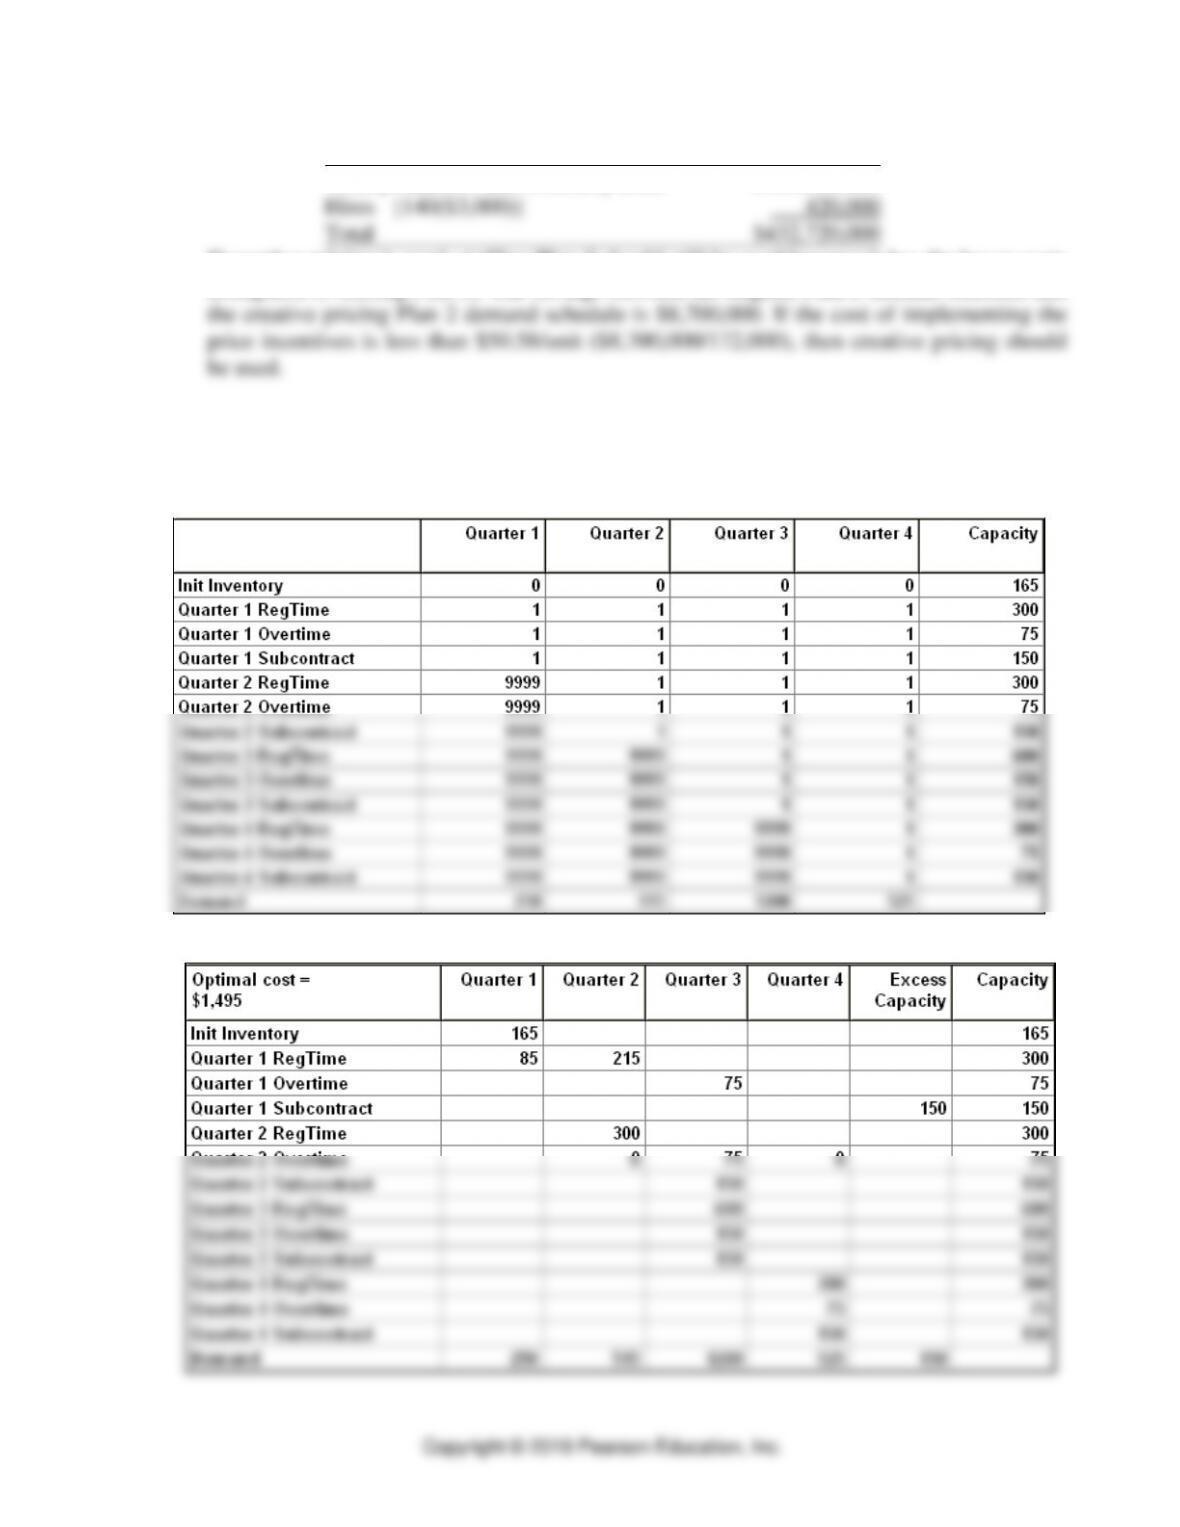
a. The Transportation Tableau and Results Screens from POM for Windows (with Capacity
and Demand in thousands of calendars) follow.
Transportation Tableau Screen
Results Screen
Linear Programming ⚫ SUPPLEMENT D ⚫
D-41
b. In analyzing the tableau, it is clear that in quarter 1, the firm will be running at full regular–
c. The total cost of the prospective production plan is:
Quarter 1: 165($0) + 85($.50)
=
$42
Quarter 2: 215($.60) + 300($.50)
=
$279
Quarter 3: 75($.95) + 75($.85) + 150($1.00) + 600($.50) + 150($.75) +150($.90)
=
$833
Quarter 4: 300($.50) + 75($.75) + 150($.90)
=
$341
Total
=
$1,495
Solution = $1,495 1,000
=
$1,495,000