Supplement
B Waiting Lines
1. Define “customers” in waiting lines.
2. Why do waiting lines form?
3. When do no waiting lines form?
4. Why is the analysis of waiting lines important?
5. Service is the act of processing a customer (or manufacturing job).
Examples:
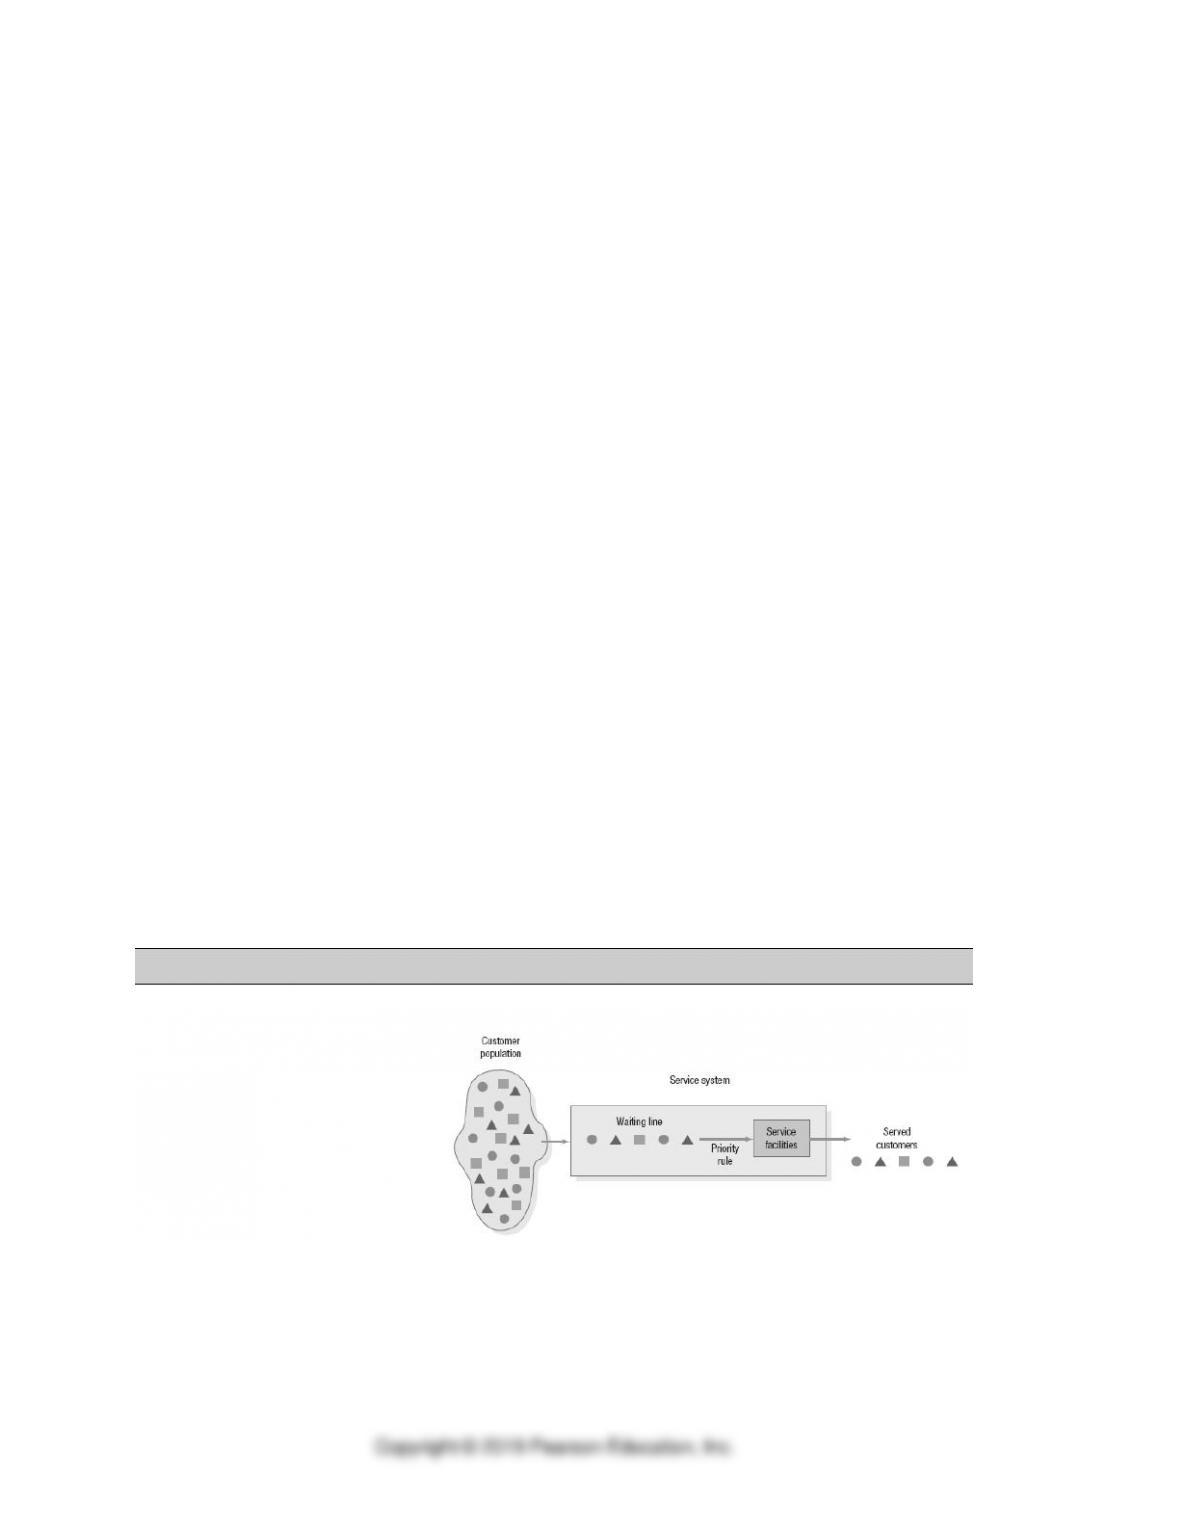
1. Structure of Waiting-Line Problems
1. Customer population
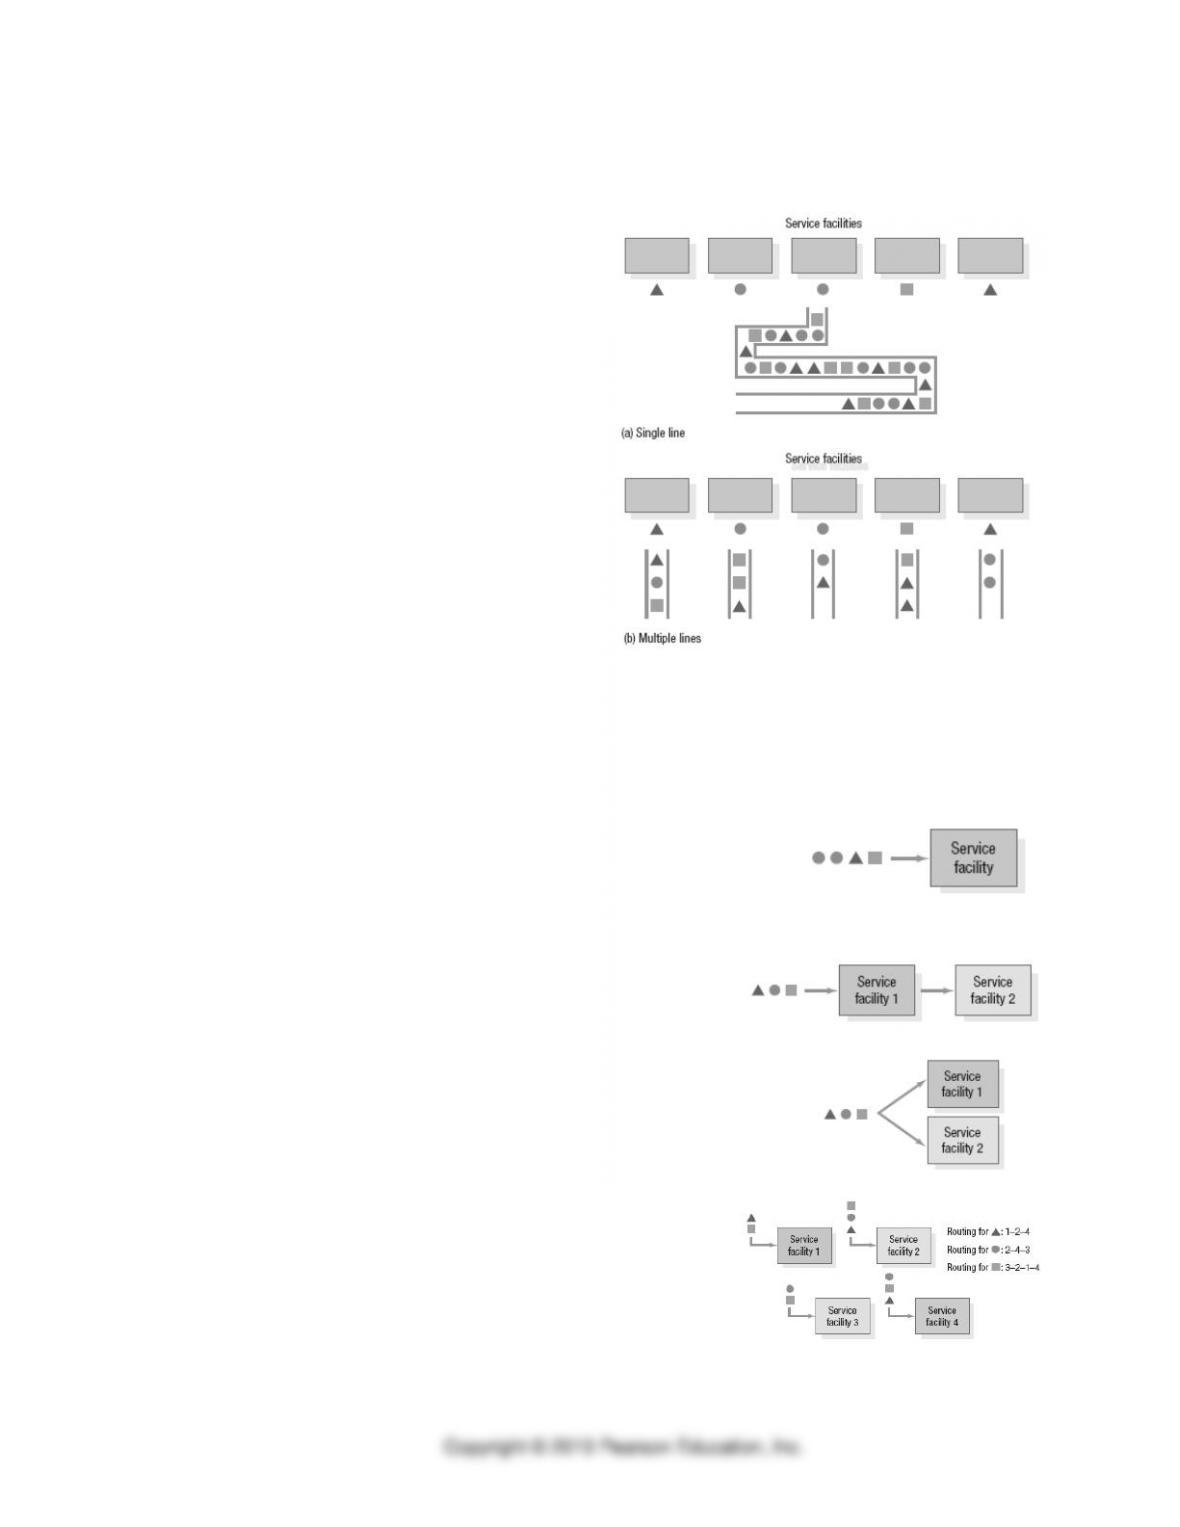
2. The service system
a. Number of lines
b. Arrangement of service facilities
• Channel:
• Phase:
• Single-channel, single-phase
• Single-channel, multiple phase
• Multiple-channel, single-phase
• Multiple-channel, multiple-phase
3. Priority rule
a.
b.
c.
4. Probability Distributions
a.
5. Arrival distribution
a. Customer arrivals can often be described by the Poisson distribution with mean =
T and
variance also =
T
b. Interarrival times
( )
T
n
ne
n
T
P
−
=!
,2,1,0=nfor
Where
=
n
P
Probability of
n
arrivals in
T
time periods
=
Average numbers of customer arrivals per period
=e
7183.2
6. Service time distribution can be described by an exponential distribution with mean = 1/
and variance = (1/
)2
a. Service time distribution:
( )
T
eTtP
−
−= 1
Where
=
Average number of customers completing service per period
=t
Service time of the customer
=T
Target service time
b. The exponential distribution assumes that each service time is independent of those that
preceded it.

2. Using Waiting-Line Models to Analyze Operations
1. Waiting line operating characteristics
a.
b.
c.
d.
e.
2. Single-server model
a. assumptions
Number of servers:
Number of phases:
Customer population (input source):
Arrival distribution:
Service distribution:
Priority rule:
Waiting line:
b. Formulas
=
Average utilization of system
=
=
n
P
Probability that
n
customers are in the system
( )
n
−= 1
=L
Average number of customers in the service system
−
=
=
q
L
Average number of customers in the waiting line
L
=
=W
Average time spent in the system, including service
−
=1
=
q
W
Average waiting time in line
W
=
c. Application B.1: Single Server Model
Customers arrive at a checkout counter at an average 20 per hour, according to a Poisson
distribution. They are served at an average rate of 25 per hour, with exponential service
times. Use the single-server model to estimate the operating characteristic of this system.
20=
customer arrival rate per hour
25=
customer service rate per hour
1.
Average utilization of system
==
2.
Average number of customers in the service system
=
−
=
L
3.
Average number of customers in the waiting line
== LLq
4.
Average time spent in the system, including service
=
−
=
1
W
5.
Average waiting time in line
== WWq
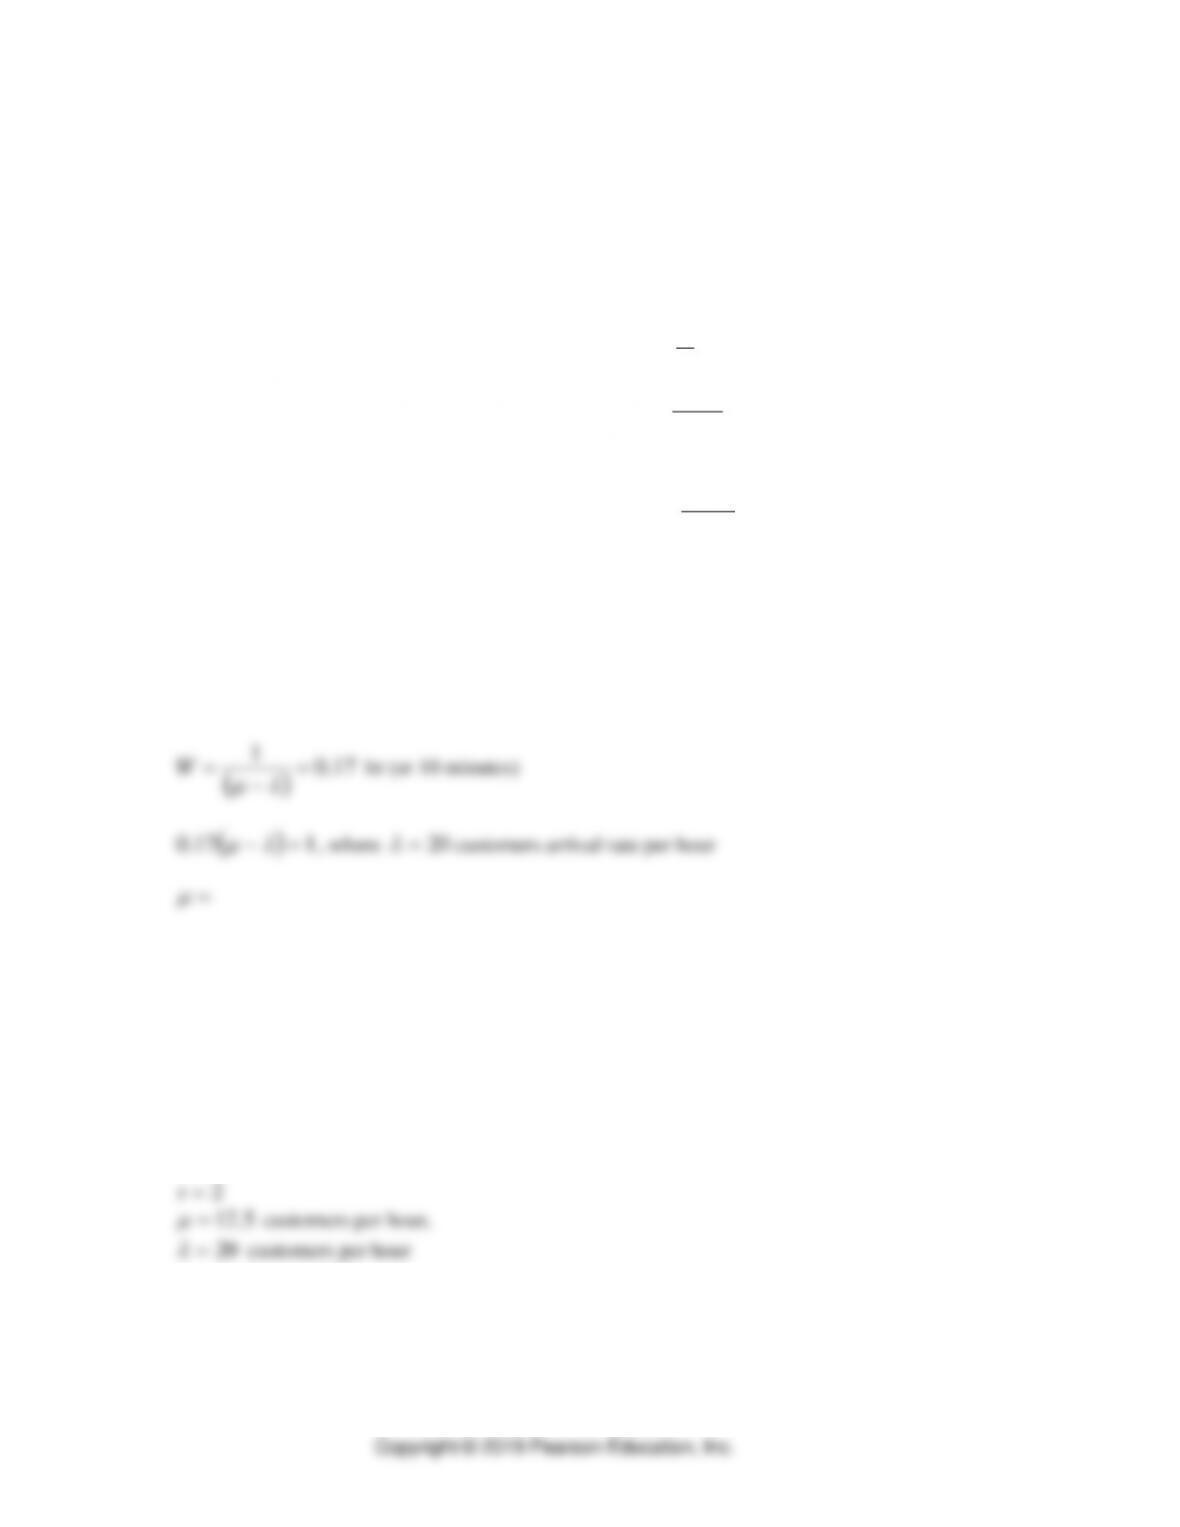
d. Application B.2: Analyzing the Service Rate
In the checkout counter example, what service rate is required to have customers average
only 10 minutes in the system?
( )
17.0
1=
−
=
W
hr (or 10 minutes)
( )
117.0 =−
, where
20=
customers arrival rate per hour
=
3. Multiple-server model
a. Assumptions (in addition to single-server model)
b. Application B.3: Multiple-Server Model
Suppose the manager of the checkout system decides to add another counter. The arrival rate
is still 20 customers per hour, but now each checkout counter will be designed to service
customers at the rate of 12.5 per hour. What is the waiting time in line of the new system?
2=s
5.12=
customers per hour,
20=
customers per hour
Use POM for Windows or OM Explorer to solve for the following operating characteristics
1.
Average utilization of the system
2.
Probability that zero customers are in the system
3.
Average number of customers in the waiting line
4.
Average waiting time of customers in line
hrs (or ______ minutes)
4. Little’s Law
a. Services
b. Manufacturing
5. Finite-source model
a. Assumptions
b. Application B.4: Finite-Source Model
DBT Bank has 8 copy machines located in various offices throughout the building. Each
machine is used continuously and has an average time between failures of 50 hours. Once
failed, it takes 4 hours for the service company to send a repair person to have it fixed. What
is the average number of copy machines in repair or waiting to be repaired?
02.0501==
copiers per hour,
25.041 ==
copiers per hour
Use POM for Windows or OM Explorer to solve for the following operating characteristics
1.
Probability that zero customers are in the system
2.
Average utilization of the server
3.
Average number of customers in the service system
c. Application B.5: Hilltop Produce (elaborate example)
The Hilltop Produce store is staffed by one checkout clerk. The average checkout time is
exponentially distributed around an average of two minutes per customer. An average of 20
customers arrive per hour.
a. What is the average utilization rate?
==
b. What is the probability that three or more customers will be in the checkout area?
First calculate 0, 1, and 2 customers in the checkout system:
( )
( )
( )
=−=
=−=
=−=
2
2
1
1
0
0
1
1
1
P
P
P
Then calculate three or more customers in the checkout system:
=−−− 210
1PPP
c. What is the average number of customers in the waiting line?
=
−
==
LLq
d. What is the average time customers spend in the store?
=
−
=
1
W
3. Waiting Lines and Simulation
1. Under what situations is waiting-line theory no longer useful and simulation used
instead?
a.
b.
c.
d.
e.
2. The basic steps required to using SimQuick include:
a.
b.
c.
4. Decision Areas for Management
1.
2.
3.
4.
5.
6.
7.