
Supplement
A Decision Making
1. Break-even Analysis
1. Evaluating services or products
a. We assume total all costs related to the production of a specific service or product can be
divided into two categories: fixed costs (which do not vary with volume) and variable
costs (which vary linearly with volume).
b. Algebraic approach by setting total revenue equal to total cost:
cp
F
Q
cQFpQ
−
=
+=
c. Break-even quantity: Graphic Approach (refer to Example A.1 and Figure A.1).
• Active Model A.1 in MyLab Operations Management provides additional insights on
this break-even example and its extensions.
• Tutor A.1 in MyLab Operations Management provides a new example to practice
break-even analysis.
d. Application A.1: Finding the Break-Even Analysis for Evaluating Products or
Services for an in-class exercise of graphical solution, algebraic solution, and sensitivity
analysis. (Note: The expected demand increase is not quite enough to break even.)
The Denver Zoo must decide whether to move twin polar bears to Sea World or build a
special exhibit for them and the zoo. The expected increase in attendance is 200,000
patrons. The data are:
Revenues per Patron for Exhibit
Gate receipts $4
Concessions $5
Licensed apparel $15
Estimated Fixed Costs
Exhibit construction $2,400,000
Salaries $220,000
Food $30,000
Estimated Variable Costs per Person
Concessions $2
Licensed apparel $9
Is the predicted increase in attendance sufficient to break even?
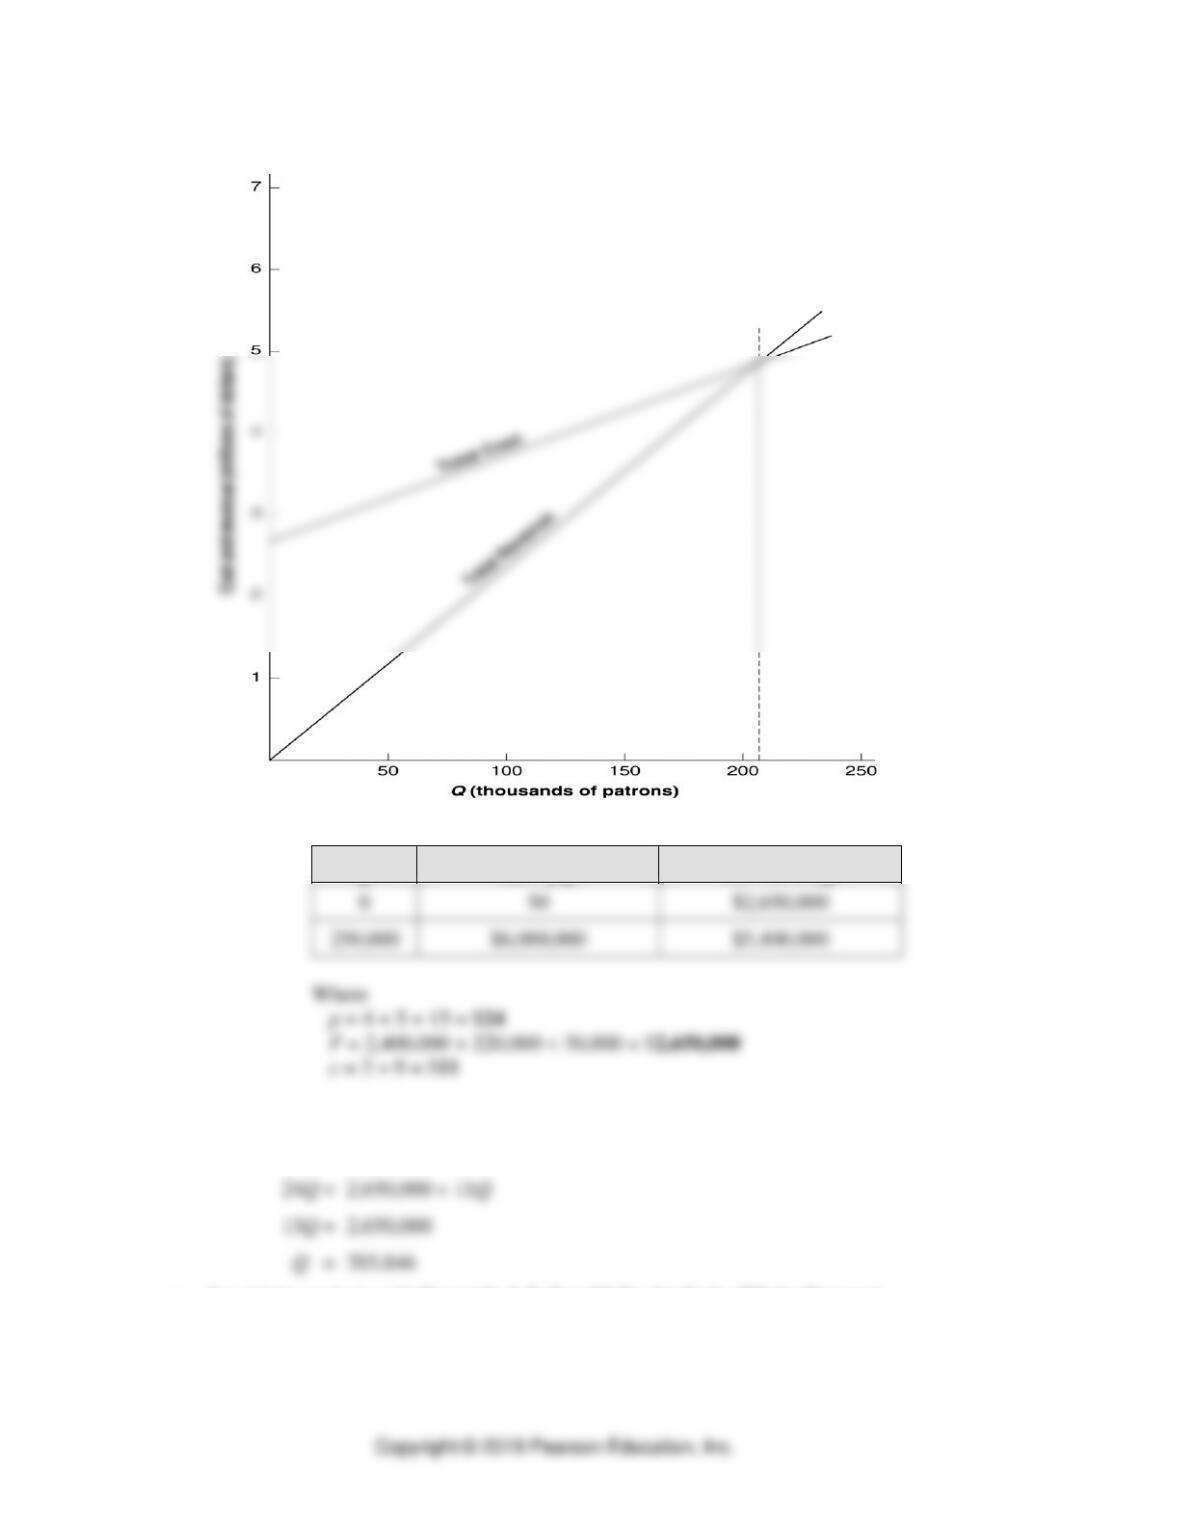
Graphical solution of Denver Zoo problem
Q
TR = pQ
TC = F + cQ
0
$0
$2,650,000
250,000
$6,000,000
$5,400,000
Where
p = 4 + 5 + 15 = $24
F = 2,400,000 + 220,000 + 30,000 = $2,650,000
c = 2 + 9 = $11
Algebraic solution of Denver Zoo problem
pQ = F + cQ
e. Sensitivity analysis with Example A.2: Sensitivity Analysis of Sales Forecast
f. Evaluating processes
• Cost to “buy” equal to the cost to “make”
QcFQcF mmbb +=+
mb
bm
cc
FF
Q−
−
=
• Example A.3: Break-Even Analysis for Make-or-Buy Decisions
• Active Model A.2 in MyLab Operations Management provides additional insights on
this make-or-buy example and its extensions.
• Tutor A.2 in MyLab Operations Management provides a new example to practice
break-even analysis on make-or-buy.
• Use Application A.2: Evaluating Processes: Make or Buy Example
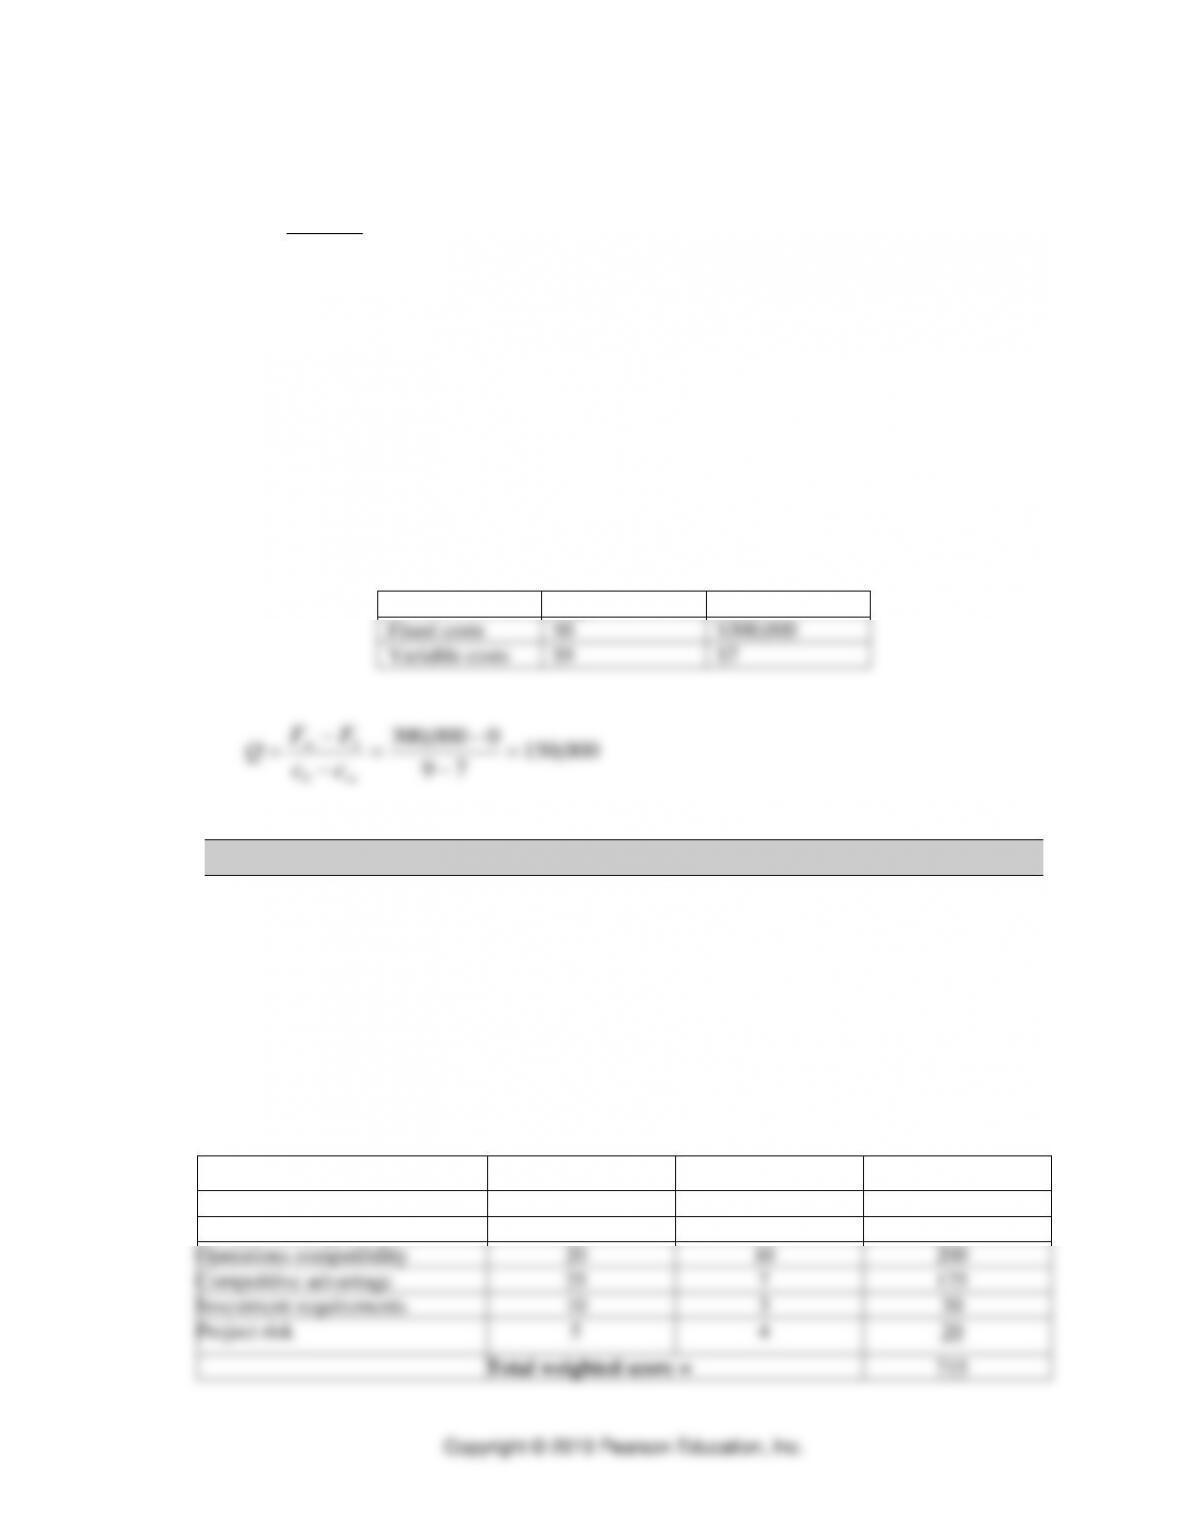
At what volume should the Denver Zoo be indifferent between buying special
sweatshirts from a supplier or have zoo employees make them?
Buy
Make
Fixed costs
$0
$300,000
Variable costs
$9
$7
000,150
79
0000,300 =
−
−
=
−
−
=
mb
bm
cc
FF
Q
2. Preference Matrix
• The preference matrix is used where multiple criteria cannot be merged into a single measure
such as dollars. For example, a manager deciding in which two cities to locate a new plant
would have to consider such unquantifiable factor, such as quality of life, worker attitudes
toward work, and community reception in the two cities.
• Use Example A.4: Evaluating an alternative with a Preference Matrix for a quick
example of evaluating a new product: a thermal storage air conditioner.
o Tutor A.3 in MyLab Operations Management provides a new example to practice
with preference matrix.
o Use Application A.3: Preference Matrix
Performance Criterion
Weight
Score
Weighted Score
Market potential
10
5
50
Unit profit margin
30
8
240
Operations compatibility
20
10
200
Competitive advantage
25
7
175
Investment requirements
10
3
30
Project risk
5
4
20
Total weighted score =
715

Repeat this process for each alternative — pick the one with the largest weighted score
• Criticism of preference matrix
o Requires the manager to state criterion weights before examining alternatives, but
they may not know in advance what is important and what is not.
o Allows one very low score to be overridden by high scores on other factors.
o This approach also may cause managers to ignore important signals (in Example A.4,
the investment required for the thermal storage air conditioner might exceed the
firm’s financial capabilities).
3. Decision Theory
• A general approach to decision making when the outcomes associated with alternatives are
often in doubt. It helps operations managers with decisions on process, capacity, location,
and inventory because such decisions are about an uncertain future.
• Decision process
o List a reasonable number of feasible alternatives.
o List the events.
o Calculate the payoff table showing the payoff for each alternative in each event.
o Estimate the probability of occurrence for each event.
o Select a decision rule to evaluate the alternatives
1. Decision making under certainty.
a. The simplest solution is when the manager knows which event will occur. Here the
decision rule is to pick the alternative with the best payoff for the known event.
b. Use Example A.5: Decisions Under Certainty
2. Decision making under uncertainty. The manager can list the possible events but cannot
estimate probabilities.
a. Four decision rules
• Maximin – (“best of the best”) For those pessimists who tend to believe that the
“worst case” event will certainly occur, this decision rule chooses the alternative that
has the best result, given the worst event will occur.
• Maximax – (“best of the best”) For those optimists who tend to believe that the best
possible event will certainly occur, this decision rule chooses the alternative that has
the best result, given the best event will occur.
• Laplace – (“the best weighted payoff”) For realists who tend to believe that events
tend to even out in the long run, this decision rule places equal weight, or assumes
equal probability, for each of the possible events.
• Minimax Regret – (“best worst regret”) This decision rule looks to minimize the
worst possible negative effect (regrets) associated with making a wrong decision (and
ignoring the positive effects of a good decision).
b. Use Example A.6: Decisions Under Uncertainty.
• Reconsider payoff matrix in Example A.5, the best alternative for each decision rule
Maximin—the pessimist would build a small facility
Maximax—the optimist would build a large facility
Laplace—the realist using the best of the weighted payoffs would build a large
facility
Minimax Regret—to minimize the maximum regret pick a large facility
• Tutor A.4 in MyLab Operations Management provides a new example to make
decisions under uncertainty.
c. Use Application A.4: Decision Making Under Uncertainty. The short answers are:
arrows for Laplace (Fletcher), barrels for Maximin (Cooper), Wagons for Maximax
(Wainwright), and arrows for Minimax Regret.
Fletcher (a realist), Cooper (a pessimist), and Wainwright (an optimist) are joint owners in
a company. They must decide whether to make Arrows, Barrels, or Wagons. The
government is about to issue a policy and recommendation on pioneer travel that depends
on whether certain treaties are obtained. The policy is expected to affect demand for the
products; however, it is impossible at this time to assess the probability of these policy
“events.” The following data are available:
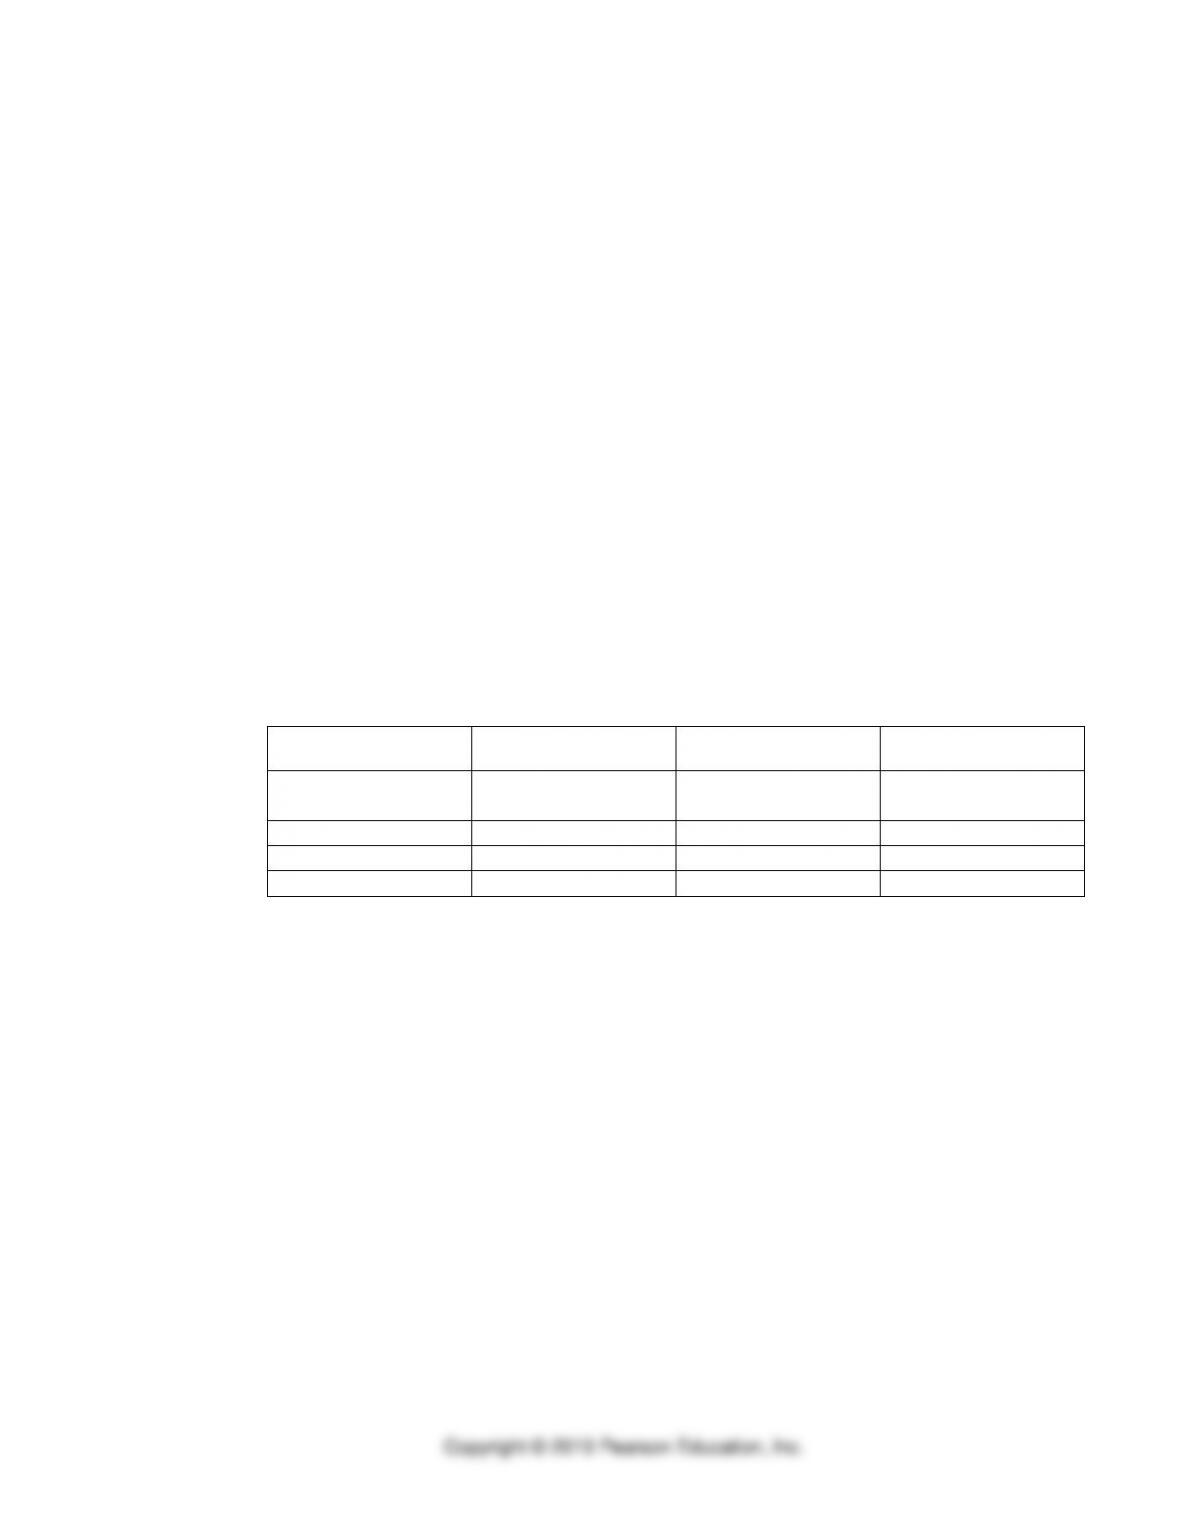
Payoffs (Profits)
Alternative
Land Routes
No treaty
Land Routes
Treaty
Sea Routes
Only
Arrows
$840,000
$440,000
$190,000
Barrels
$370,000
$220,000
$670,000
Wagons
$25,000
$1,150,000
($25,000)
• Which product would be favored by Fletcher?
• Which product would be favored by Cooper?
• Which product would be favored by Wainwright?
• What is the minimax regret solution?
3. Decision making under risk
a. The manager can list the possible events and estimate their probabilities.
b. The manager has less information than decision making under certainty, but more
information than with decision making under uncertainty.
c. The expected value rule is widely used.
d. This rule is similar to the Laplace decision rule, except that the events are no longer
assumed to be equally liked (or equally important).
e. Use Example A.7: Decisions Under Risk.
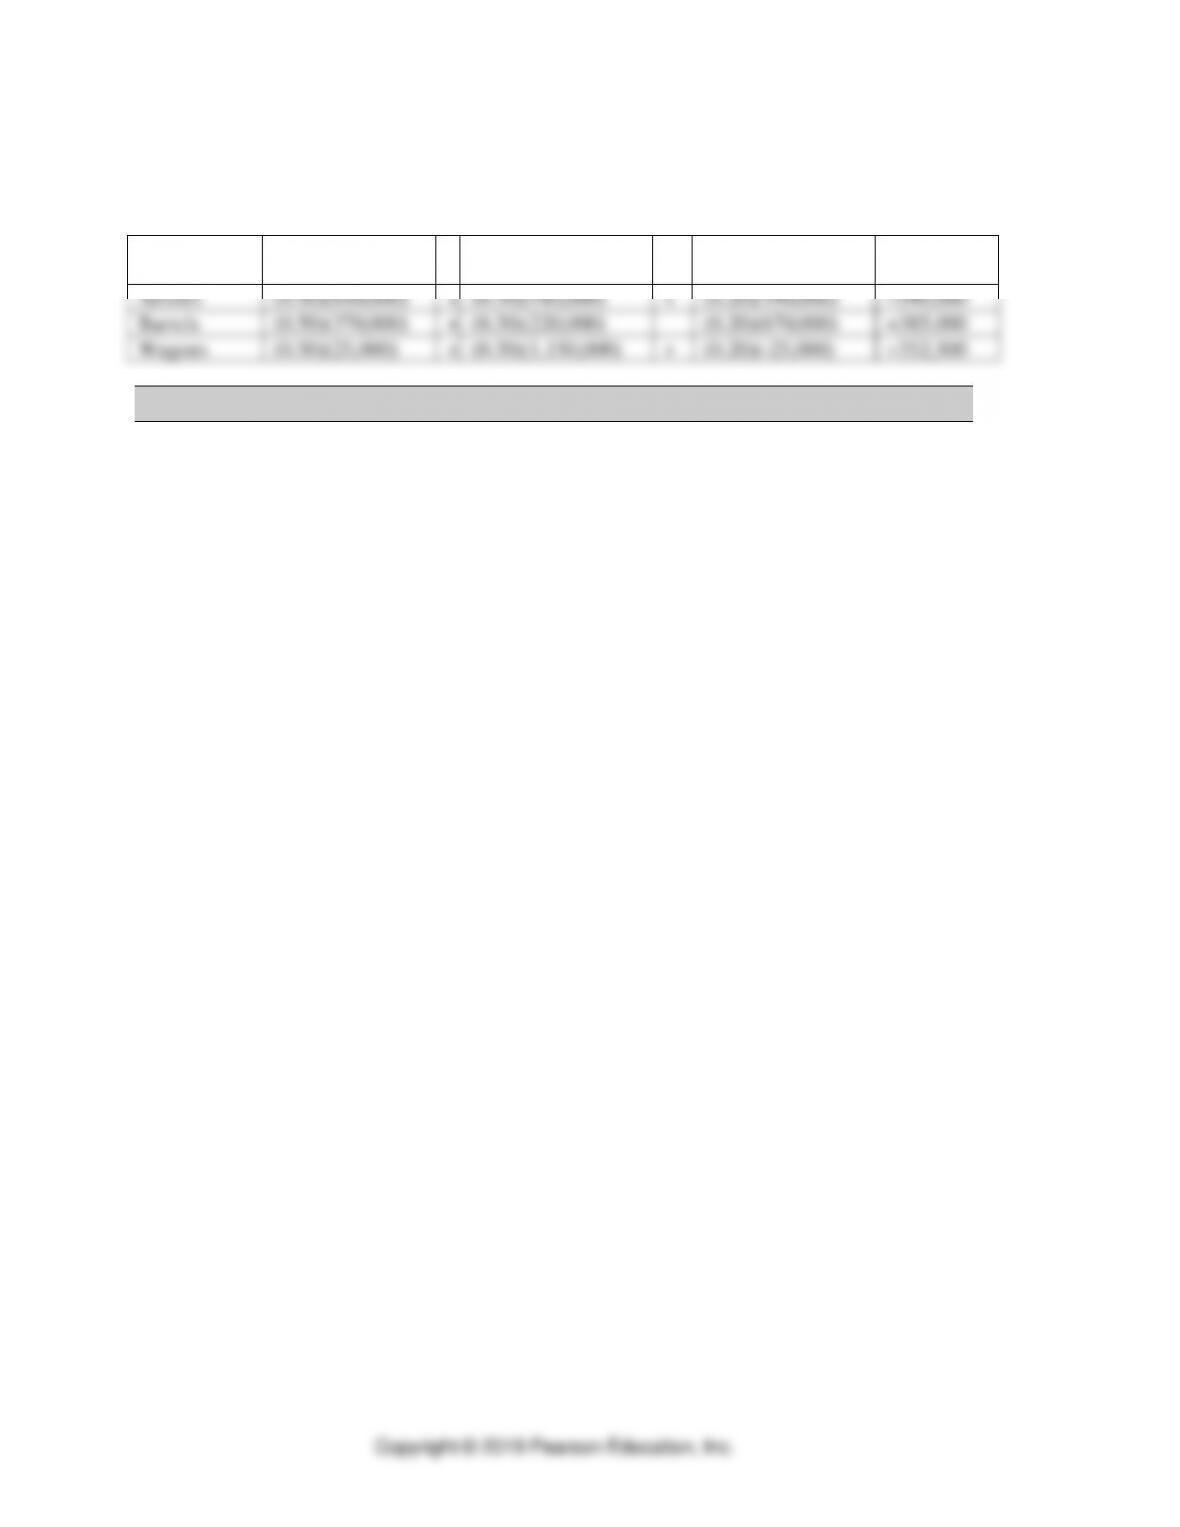
f. Use Application A.5: Decision Making Under Risk.
For FC&W, find the best decision using the expected value rule. The probabilities for the
events are given below. What alternative has the best expected results?
Alternative
Land routes, No
Treaty(0.50)
Land Routes,
Treaty Only (0.30)
Sea routes, Only
(0.20)
Expected
Value
Arrows
(0.50)(840,000)
+
(0.30)(440,000)
+
(0.20)(190,000)
=590,000
Barrels
(0.50)(370,000)
+
(0.30)(220,000)
(0.20)(670,000)
=385,000
Wagons
(0.50)(25,000)
+
(0.30)(1,150,000)
+
(0.20)(-25,000)
=352,500
4. Decision Trees
• The decision tree method is a general approach to a wide range of OM decisions, such as
product planning, process analysis, process capacity, and location.
o A schematic model of available alternatives and possible consequences
o Useful with probabilistic events and sequential decisions
o Square nodes represent decisions.
o Circular nodes represent events.
o Events leaving a chance node are collectively exhaustive (probabilities sum to one).
o Conditional payoffs for each possible alternative-event combination shown at the end of
each combination.
o Draw the decision tree from left to right.
o Calculate expected payoff to solve the decision tree from right to left.
• Use Example A.8: Analyzing a Decision Tree for an in-class exercise in drawing and
analyzing a decision tree.
o Active Model A.3 in MyLab Operations Management provides additional insights to the
decision tree example and its extensions.
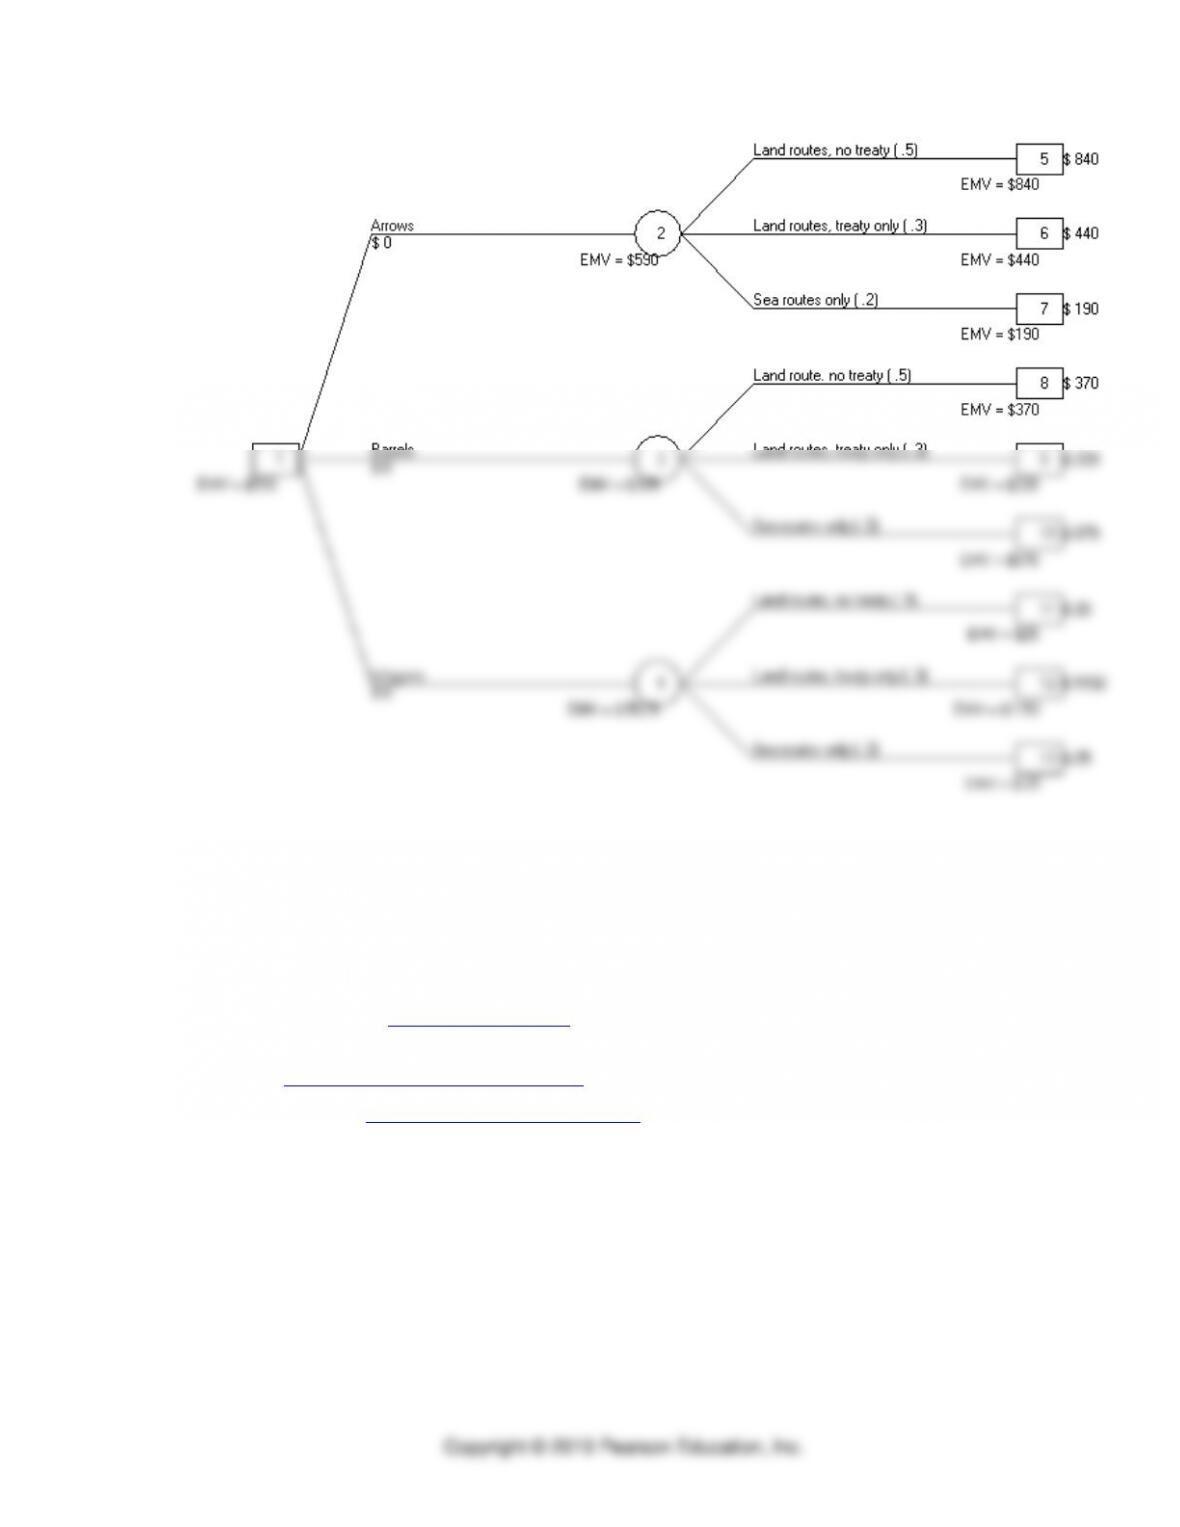
• Use Application A.6: Decision Trees for an in-class exercise in drawing and analyzing a
decision tree.
o Draw the decision tree for the FC&W Application A.5 problem.
o What is the expected payoff for the best alternative in the decision tree below?
Copyright © 2019 Pearson Education, Inc.
• Various software is available for drawing and/or analyzing decision trees, including
o PowerPoint can be used to draw decision trees, but does not have the capability to
analyze the decision tree
o POM with Windows
o SmartDraw (www.smartdraw.com)
o PrecisionTree decision analysis from Palisade Corporation
(www.palisade.com/html/ptree.html)
o TreePlan (www.treeplan.com/treeplan.htm)