
Project Management ⚫ CHAPTER 7 ⚫
7-17
b. Project cost with the earliest start time for each activity:
Project time
25
Project Budget
$ 2,125
Period
Total
A
B
C
D
E
F
G
H
I
J
K
L
M
N
O
P
1
70.83
33.33
37.50
2
70.83
33.33
37.50
3
70.83
33.33
37.50
4
100.00
37.50
62.50
5
147.50
62.50
35.00
50.00
6
97.50
35.00
50.00
12.50
7
97.50
35.00
50.00
12.50
8
147.50
35.00
12.50
100.00
9
47.50
35.00
12.50
10
106.25
50.00
12.50
25.00
18.75
11
106.25
50.00
12.50
25.00
18.75
12
118.75
50.00
18.75
50.00
13
118.75
50.00
18.75
50.00
14
150.00
50.00
50.00
50.00
15
100.00
50.00
50.00
16
250.00
50.00
200.00
17
43.75
43.75
18
43.75
43.75
19
43.75
43.75
20
43.75
43.75
21
30.00
30.00
22
30.00
30.00
23
30.00
30.00
24
30.00
30.00
25
30.00
30.00

Part I Managing Processes
7-18
Project cost with the latest start times for each activity:
Project time
25
Project Budget
$ 2,125
Period
Total
A
B
C
D
E
F
G
H
I
J
K
L
M
N
O
P
1
37.50
37.50
2
37.50
37.50
3
70.83
33.33
37.50
4
70.83
33.33
37.50
5
68.33
33.33
35.00
6
97.50
62.50
35.00
7
97.50
62.50
35.00
8
97.50
35.00
50.00
12.50
9
97.50
35.00
50.00
12.50
10
112.50
50.00
50.00
12.50
11
81.25
50.00
12.50
18.75
12
81.25
50.00
12.50
18.75
13
81.25
50.00
12.50
18.75
14
168.75
100.00
18.75
50.00
15
100.00
50.00
50.00
16
125.00
25.00
50.00
50.00
17
68.75
25.00
43.75
18
93.75
50.00
43.75
19
93.75
50.00
43.75
20
293.75
50.00
43.75
200.00
21
30.00
30.00
22
30.00
30.00
23
30.00
30.00
24
30.00
30.00
25
30.00
30.00

Project Management ⚫ CHAPTER 7 ⚫
7-19
Cost by day is plotted for Early Start and Late Start Schedules.
OM Explorer
Solver – Project Budgeting
Cost by Period
0
50
100
150
200
250
300
350
1 2 3 4 5 6 7 8 9 10 11 12 13 14 15 16 17 18 19 20 21 22 23 24 25
Period
Cost
Early Start Late start
19. Software Installation
The AON diagram for the software installation project is below.
G
2
B
8
D
4
A
5
C
10 I
9
F
9
H
8
E
3
START FINISH
Part I Managing Processes
7-20
The crashing data are given in the following table.
Activity
Normal
Time
Normal
Cost
Crash
Time
Crash
Cost
Max
reduction
$ per
Week
A
5
$2,000
3
$4,000
2
1,000
B
8
$5,000
7
$8,000
1
3,000
C
10
$10,000
8
$12,000
2
1,000
D
4
$3,000
3
$7,000
1
4,000
E
3
$4,000
2
$5,000
1
1,000
F
9
$8,000
6
$14,000
3
2,000
G
2
$2,000
2
$2,000
NONE
NONE
H
8
$6,000
5
$9,000
3
1,000
I
9
$7,000
7
$15,000
2
4,000
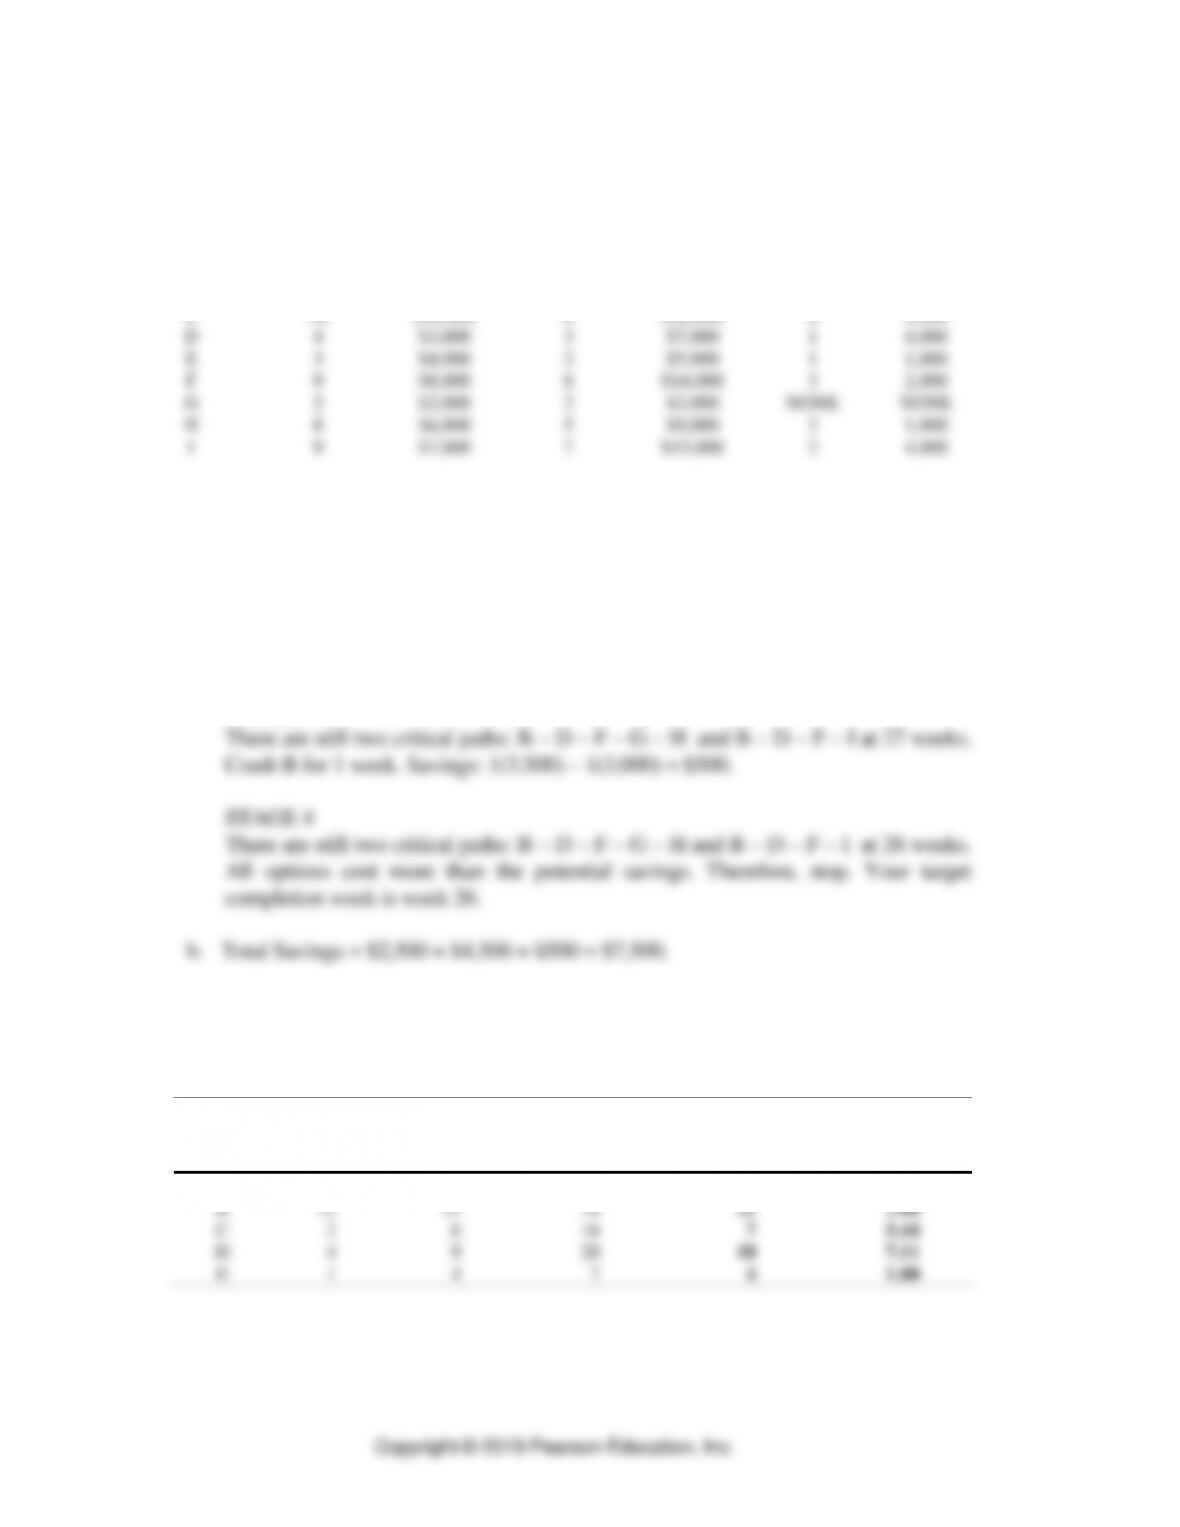
a. STAGE 1
The critical path is B – D – F – G – H at 31 weeks. Crash H by 1 week because you
are constrained by path B – D – F – I. Savings: 1(3,500) – 1 (1,000) = $2,500.
STAGE 2
There are two critical paths: B – D – F – G – H and B – D – F – I at 30 weeks.
Crash F for 3 weeks. Savings: 3(3,500) – 3(2,000) = $4,500.
STAGE 3
Assessing and Analyzing Risks
20. Webjets International, Inc.
Activity Statistics
Activity
Optimistic
Most Likely
Pessimistic
Expected Time
Variance
(a)
(m)
(b)
(
te
)
(
2
)
A
3
8
19
9
7.11
B
12
15
18
15
1.00
C
2
6
16
7
5.44
D
4
9
20
10
7.11
E
1
4
7
4
1.00
Project Management ⚫ CHAPTER 7 ⚫
7-21
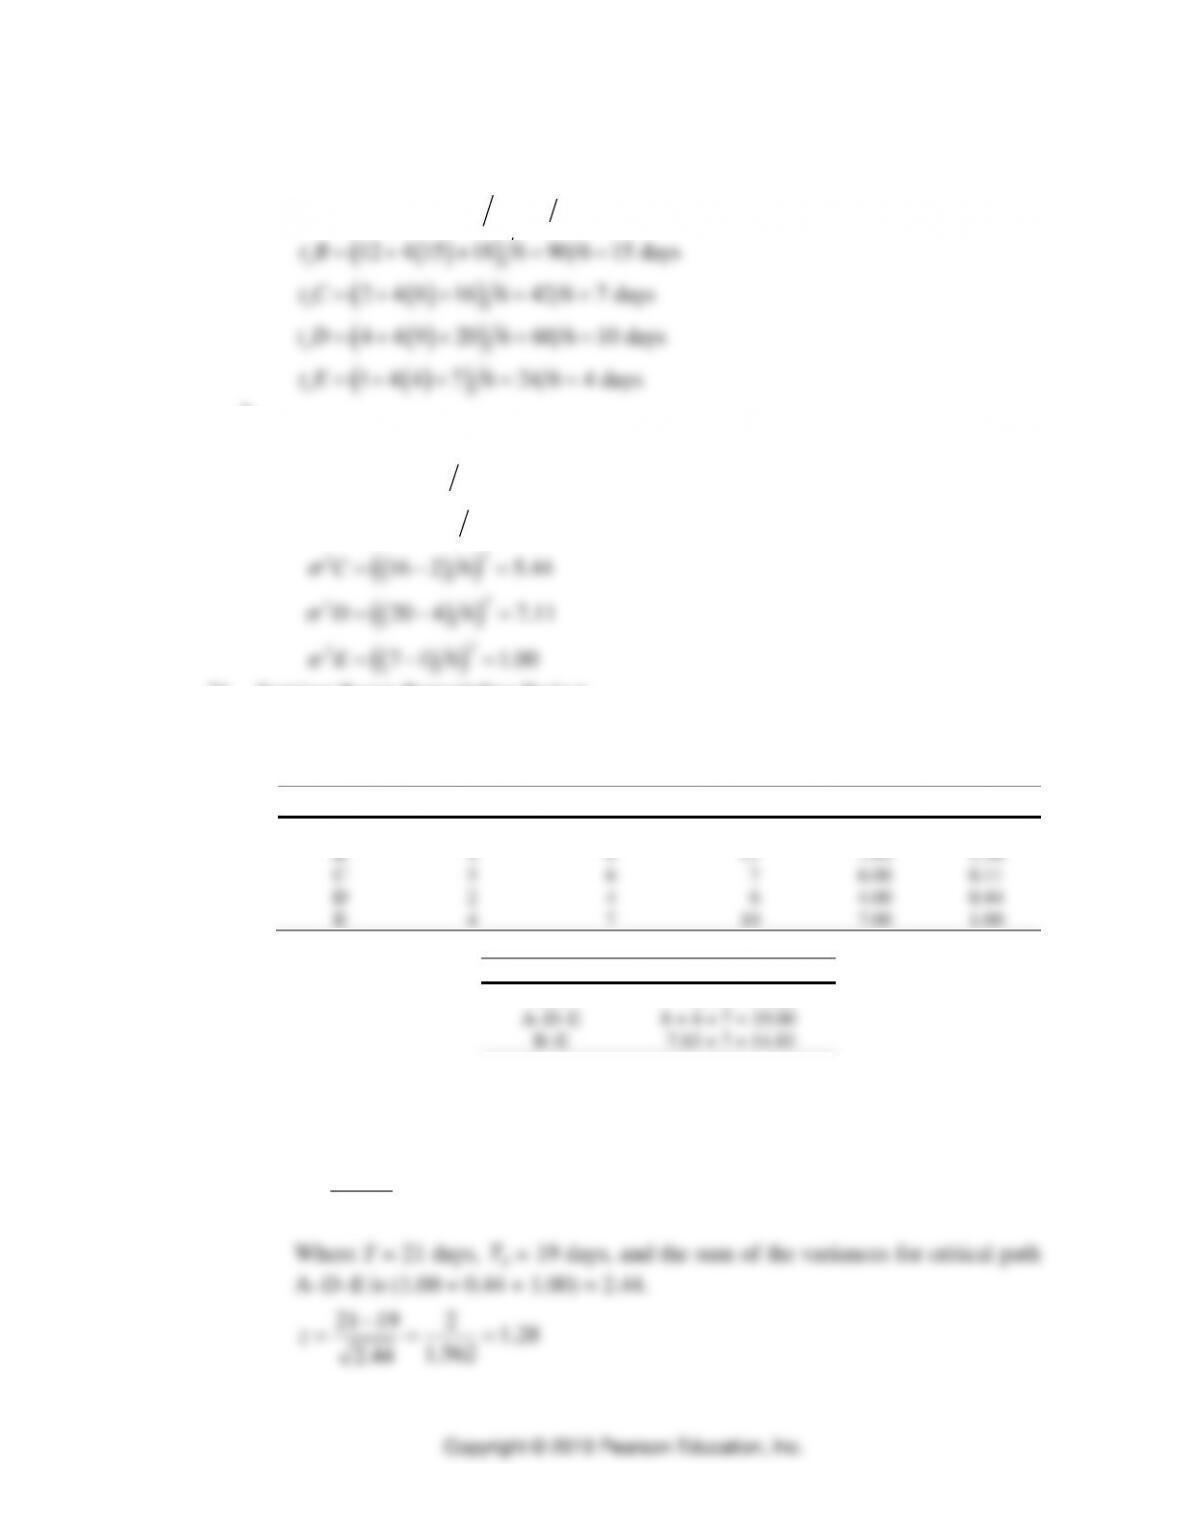
a.
( )
( )
( )
( )
( )
( )
( )
( )
( )
( )
3 4 8 19 6 54 6 9 days
12 4 15 18 6 90 6 15 days
2 4 6 16 6 42 6 7 days
4 4 9 20 6 60 6 10 days
1 4 4 7 6 24 6 4 days
e
e
e
e
e
tA
tB
tC
tD
tE
= + + = =
= + + = =
= + + = =
= + + = =
= + + = =
b.
( )
( )
( )
( )
( )
( )
( )
( )
( )
( )
2
2
2
2
2
2
2
2
2
2
19 3 6 7.11
18 12 6 1.00
16 2 6 5.44
20 4 6 7.11
7 1 6 1.00
A
B
C
D
E
= − =
= − =
= − =
= − =
= − =
21. Seminar Room Remodeling Project
a. The expected activity times (in days) are:
Activity
Optimistic
Most Likely
Pessimistic
te
2
A
5
8
11
8.00
1.00
B
4
8
11
7.83
1.36
C
5
6
7
6.00
0.11
D
2
4
6
4.00
0.44
E
4
7
10
7.00
1.00
Path
Total Expected Time
A–C
8 + 6 = 14.00
A–D–E
8 + 4 + 7 = 19.00
B–E
7.83 + 7 = 14.83
The critical path is A–D–E because it has the longest time duration. The
expected completion time is 19 days.
b.
P
E
TT
z−
=
562.1
44.2
Part I Managing Processes
7-22
Assuming the normal distribution applies (which is questionable for a sample of
three activities), we use the table for the normal probability distribution. Given
z = 1.28, the probability that the project can be completed in 21 days is 0.8997,
or about 90%.
c. Because the normal distribution is symmetrical, the probability the project can
be completed in 17 days is (1 – 0. 8997) = 0. 1003, or about 10%.
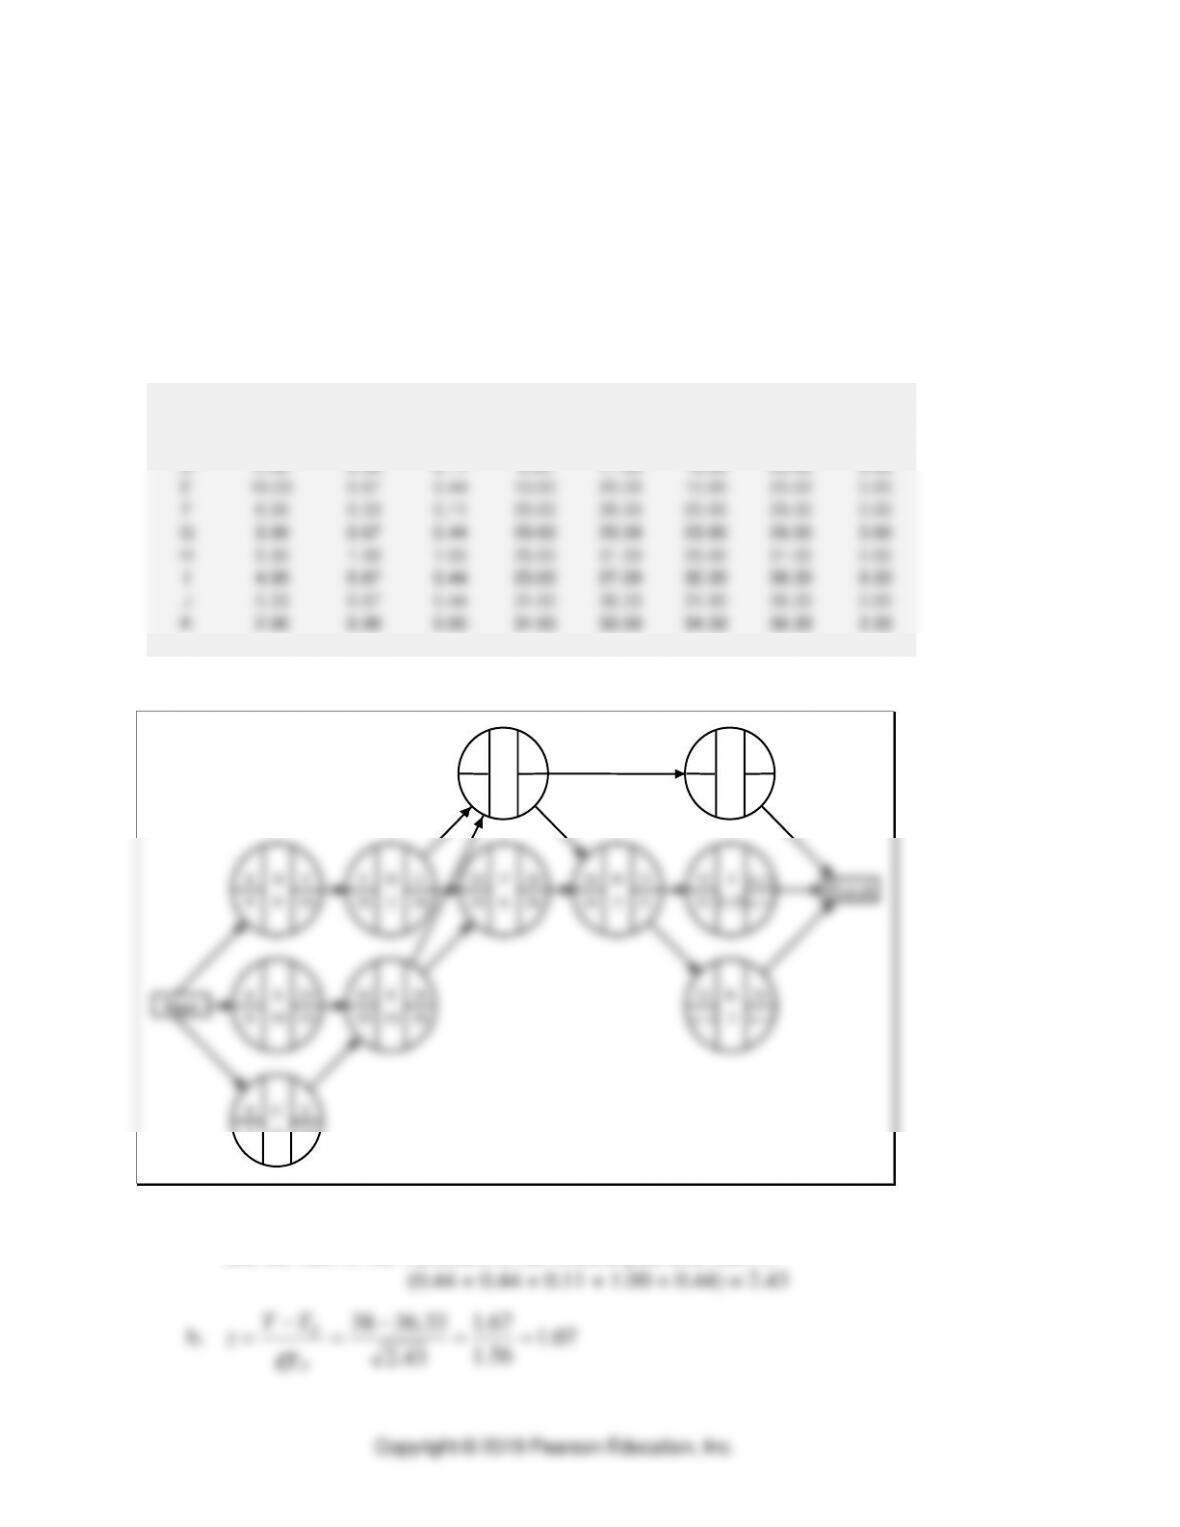
22. Solved Problem 2.
p
E
TT
z−
=
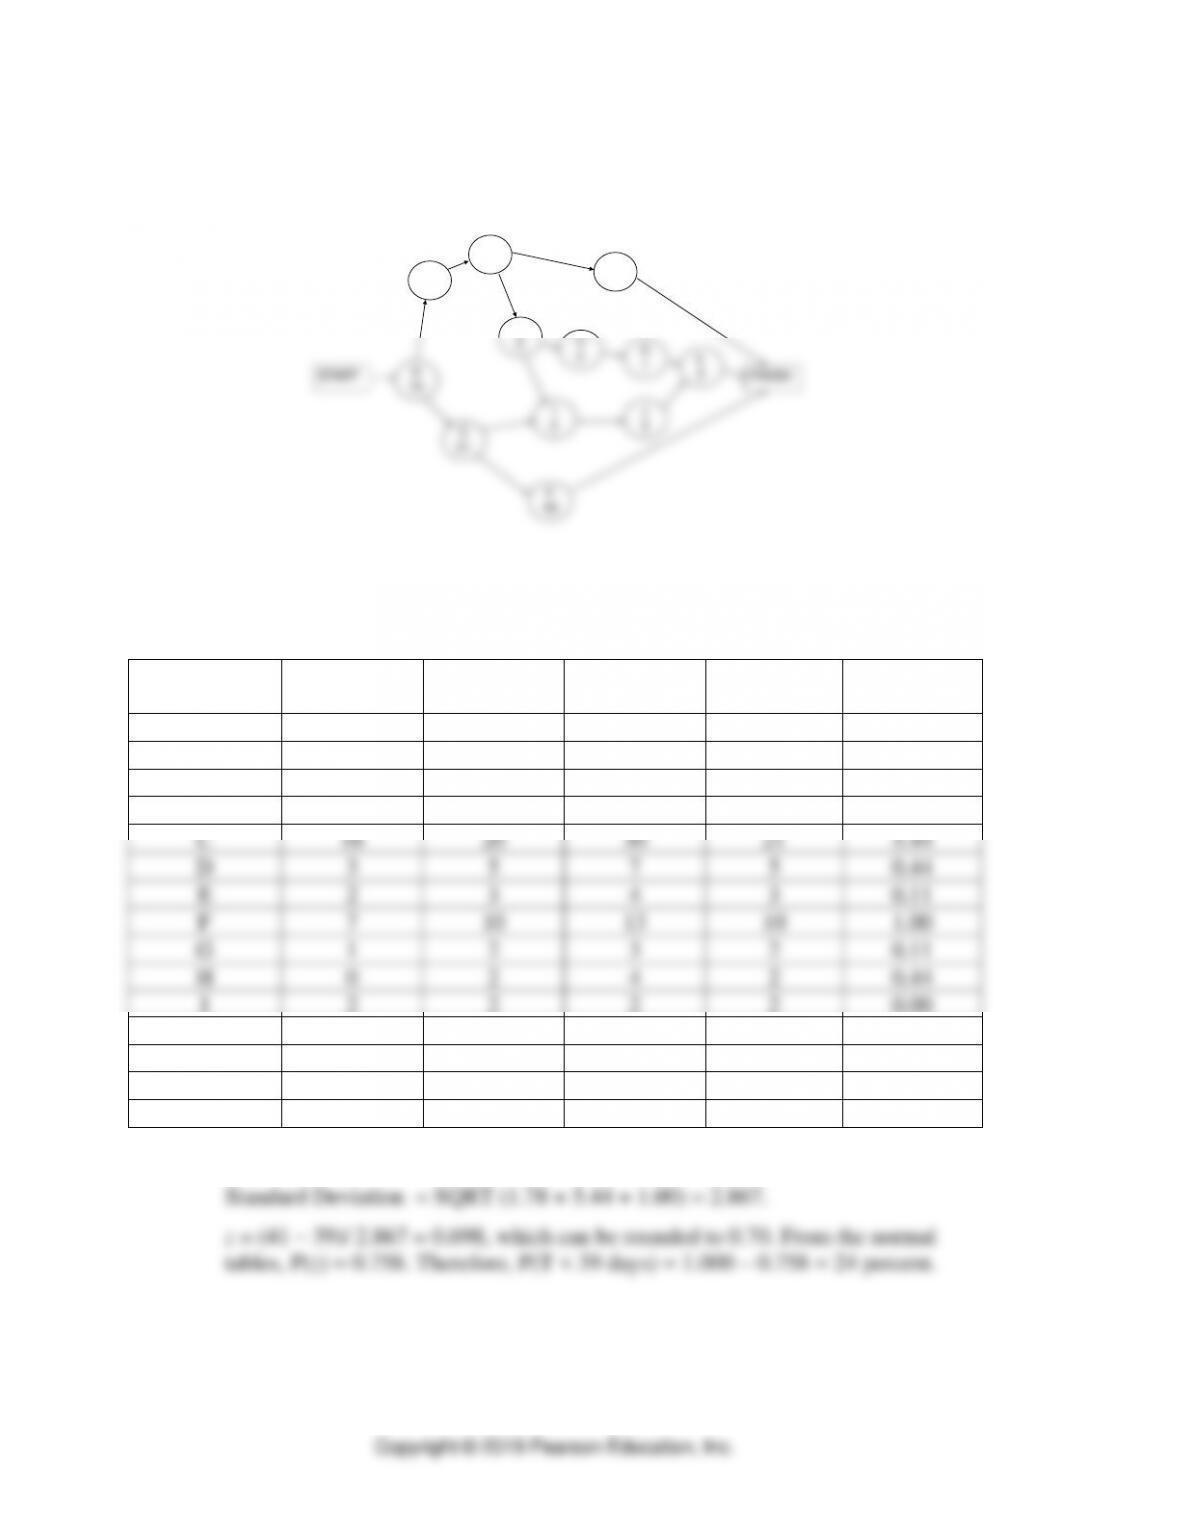
23. Bluebird University.
Calculation of activity statistics (in days):
Project time 43.166667 Project standard deviation 2.939
Project variance 8.639
Activity
Expected
Time
Standard
deviation
Variance
Early
Start
Early
Finish
Late
Start
Late
Finish
Total
Activity
Slack
A6.83 0.50 0.25 0.00 6.83 0.00 6.83 0.00
B8.33 1.00 1.00 0.00 8.33 2.33 10.67 2.33
C4.00 0.33 0.11 0.00 4.00 16.67 20.67 16.67
D17.33 2.33 5.44 6.83 24.17 6.83 24.17 0.00
E10.00 0.67 0.44 8.33 18.33 10.67 20.67 2.33
F4.00 0.33 0.11 18.33 22.33 20.67 24.67 2.33
G7.50 0.83 0.69 24.17 31.67 24.17 31.67 0.00
H7.00 0.67 0.44 22.33 29.33 24.67 31.67 2.33
I11.50 1.50 2.25 31.67 43.17 31.67 43.17 0.00
J4.00 0.00 0.00 31.67 35.67 39.17 43.17 7.50
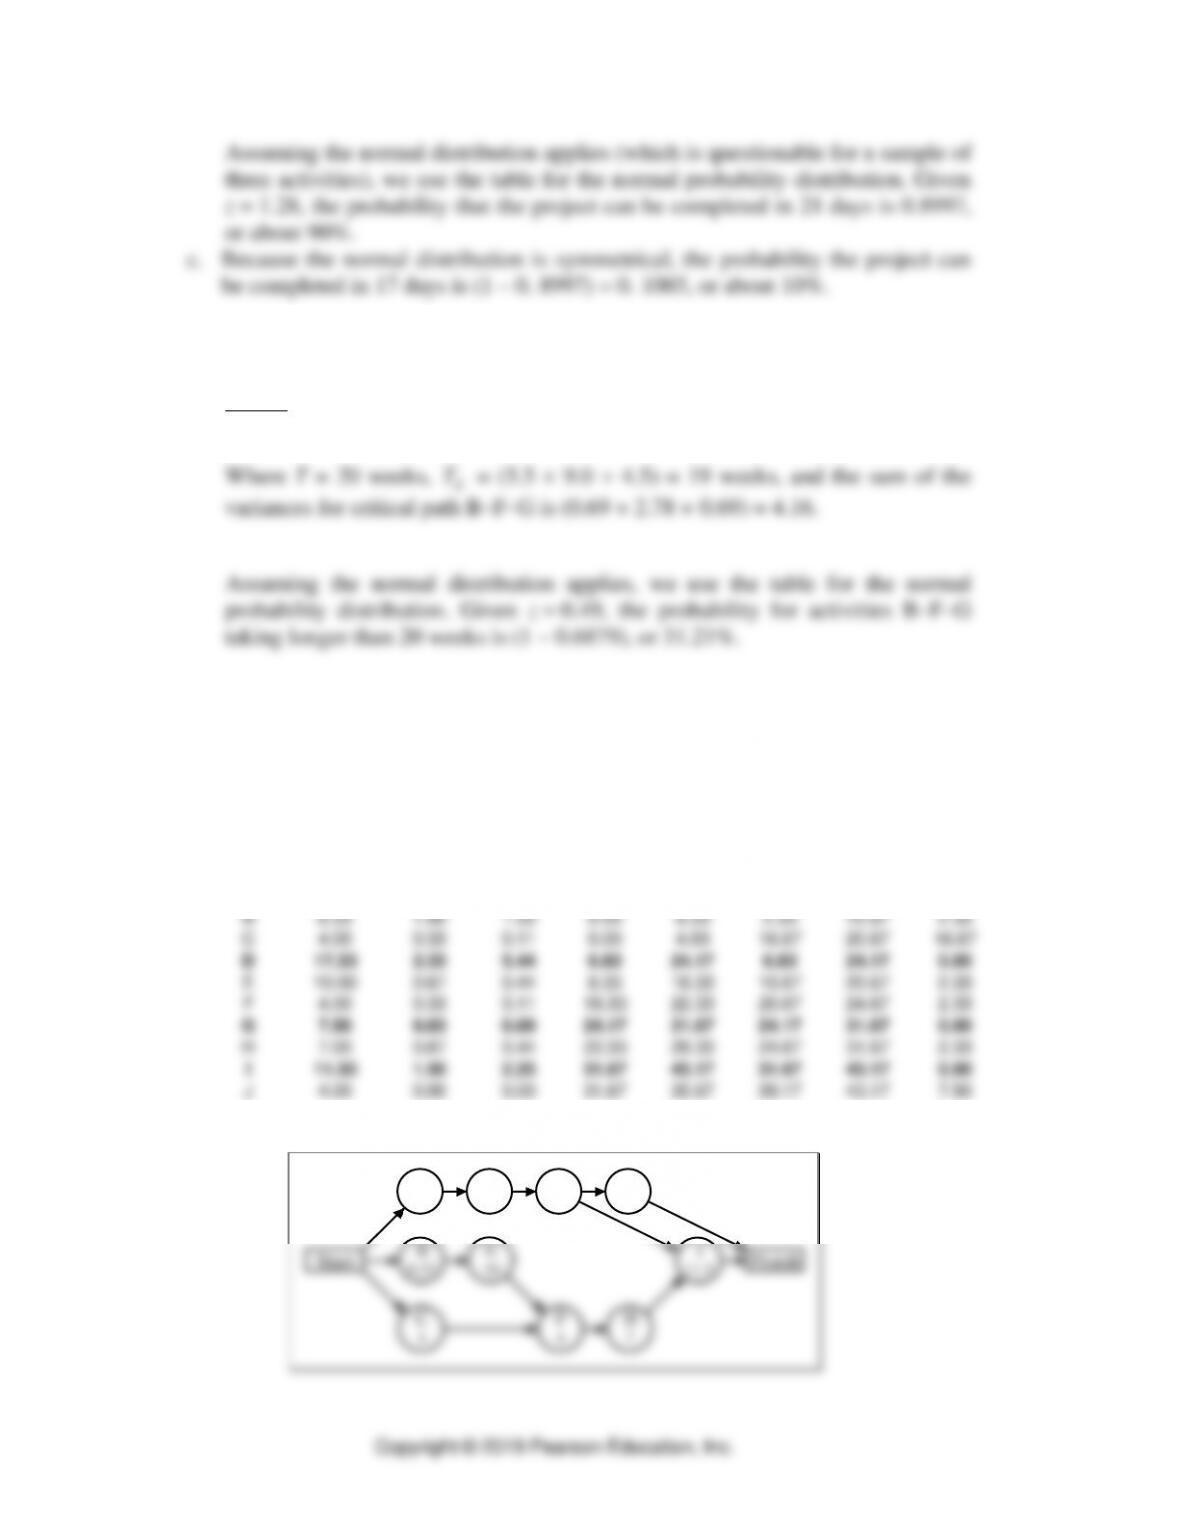
The AON diagram is:
I
11.5
J
4
G
7.5
FinishStart
A
6.83
B
8.33
D
17.33
E
10
Project Management ⚫ CHAPTER 7 ⚫
7-23
The critical path is A–D–G–I, and the expected completion time is 43.17 days.
T = 47 days,
E
T
= 43.17 days, and the sum of the variances for the critical
24. Pet Paradise
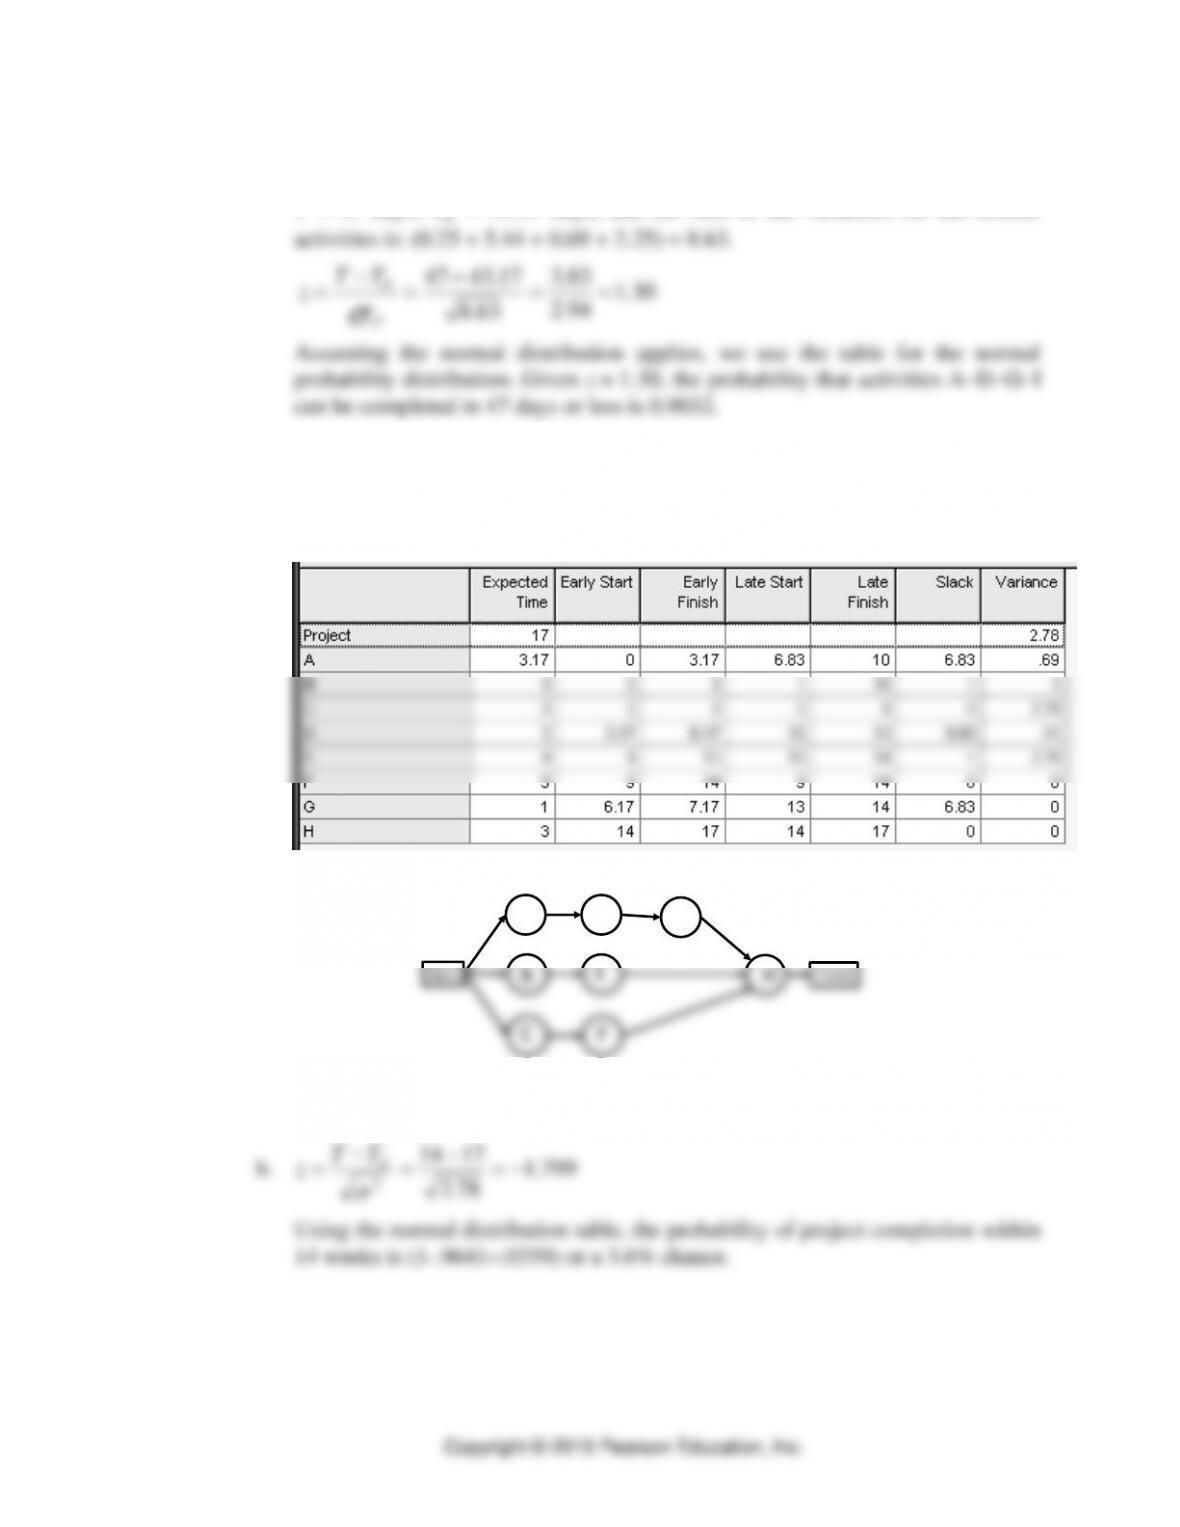
a. Calculation of the activity statistics is provided in the following output from
POM for Windows software:
The AON diagram for the hiring project is:
Start
AG
B
C
D
F
EFinish
H
The critical path is C-F-H with an expected project completion time of 17
weeks.
1714
−
−
E
TT
Part I Managing Processes
7-24
25. Good Public Relations.
a. Calculation of the activity statistics:
Project time 36.333333 Project standard deviation 1.563
Project variance 2.444
Activity
Expected
Time
Standard
deviation
Variance
Early
Start
Early
Finish
Late
Start
Late
Finish
Total
Activity
Slack
A 10.00 0.67 0.44 0.00 10.00 0.00 10.00 0.00
B 9.00 2.00 4.00 0.00 9.00 9.00 18.00 9.00
C 8.00 0.33 0.11 0.00 8.00 2.00 10.00 2.00
D 2.00 0.33 0.11 9.00 11.00 18.00 20.00 9.00
E 10.00 0.67 0.44 10.00 20.00 10.00 20.00 0.00
F 6.00 0.33 0.11 20.00 26.00 20.00 26.00 0.00
G 3.00 0.67 0.44 20.00 23.00 23.00 26.00 3.00
H 5.00 1.00 1.00 26.00 31.00 26.00 31.00 0.00
I 4.00 0.67 0.44 23.00 27.00 32.33 36.33 9.33
J 5.33 0.67 0.44 31.00 36.33 31.00 36.33 0.00
K 2.00 0.00 0.00 31.00 33.00 34.33 36.33 3.33
The AON diagram for the advertising campaign is shown below.
9
18
D
2
11
20
0
2
C
8
8
10
0
9
B
9
9
18
0
0
A
10
10
10
Finish
Start 10
10
E
10
20
20
20
20
F
6
26
26
20
23
G
3
23
26
26
26
H
5
31
31
31
31
J
5.33
36.33
36.33
23
32.33
I
4
27
36.33
31
34.33
K
2
33
36.33

Project Management ⚫ CHAPTER 7 ⚫
7-25
c. The path A–E–G–H–J has a duration of 33.33 weeks with variance of 2.76.
33.3338 =
−
−
E
TT
Part I Managing Processes
7-26
26. Office Renovation
The AON diagram for the office renovation project is below.
I
2
A
10
G
2
B
1
D
5E
3
K
1
H
2
F
10
L
2
C
21
J
3
START FINISH
The calculations of the time statistics are contained in the following table.
Activity
Optimistic
Most Likely
Pessimistic
Expected
Time
Variance
START
0
0
0
——
——
A
6
10
14
10
1.78
B
0
1
2
1
0.11
C
16
20
30
21
5.44
D
3
5
7
5
0.44
E
2
3
4
3
0.11
F
7
10
13
10
1.00
G
1
2
3
2
0.11
H
0
2
4
2
0.44
I
2
2
2
2
0.00
J
2
3
4
3
0.11
K
0
1
2
1
0.11
L
1
2
3
2
0.11
FINISH
0
0
0
——
——
a. The critical path is A – C – F at 41 days.

Project Management ⚫ CHAPTER 7 ⚫
7-27
b. We want to find the project completion time so that the probability of
completion is 90 percent. The z value for 90 percent is 1.28. Consequently,
CASE: THE PERT MUSTANG
A. Synopsis
The owner of the Roberts’ Auto Sales and Service Company is interested in
restoring a 1965 Shelby Mustang GT 350 for advertising a new restoration business
she wants to start. The restoration project involves 22 activities and needs to be
completed in 45 days so that the car can be displayed in an auto show. The owner
wants an assessment of how the restoration business fits with the other businesses
the company engages in, a report on the activities that need to be completed and
their interrelationships, an assessment of whether the project can be completed on
time, and a budget.
B. Purpose
This case provides enough data for the student to develop a PERT/CPM network for
a project involving 22 activities. With this case, the class can:
❑ Discuss how well a new market segment can be satisfied with an existing
operation.
❑ Gain experience in identifying the relationships between activities in a
large project.
❑ Relate cost to the development of a project.
C. Analysis
1. The restoration business, although entailing much of the skills and resources
needed for the other market segments the company serves, needs to be evaluated
carefully before making a commitment. Currently, the company has three car
dealerships, two auto parts stores, one body/paint shop, and one auto storage
yard. These operations would be useful for the restoration business. However,
the nature of the markets served by these operations is not made explicit in the
case. Some questions come to mind:
a. Are the auto parts stores equipped to provide customers with “one-of-a-
kind” parts? Restoration parts are hard to find and require access and
familiarity with different information systems.
b. Does the body/paint shop have the ability to do custom, high-quality work,
with restoration of rusty parts, or is it a high-volume operation with minimal
capability to restore any car to its original condition?
c. Does the machine shop have the capability to machine one part at a time to
unique specifications if the restoration part cannot be purchased from a
supplier?

Part I Managing Processes
Copyright © 2019 Pearson Education, Inc.
7-28
d. How useful will the salvage yard be for the restoration business? There must
be a broad mix of vintage age autos in the yard in order to support the new
business.
The competitive priorities for the restoration business most likely will be top
quality and customization in a low-volume environment. It would seem that
these competitive priorities could conflict with other market segments the
company serves.
2. The project activities and the precedence relationships are given in Exhibit
TN.1.
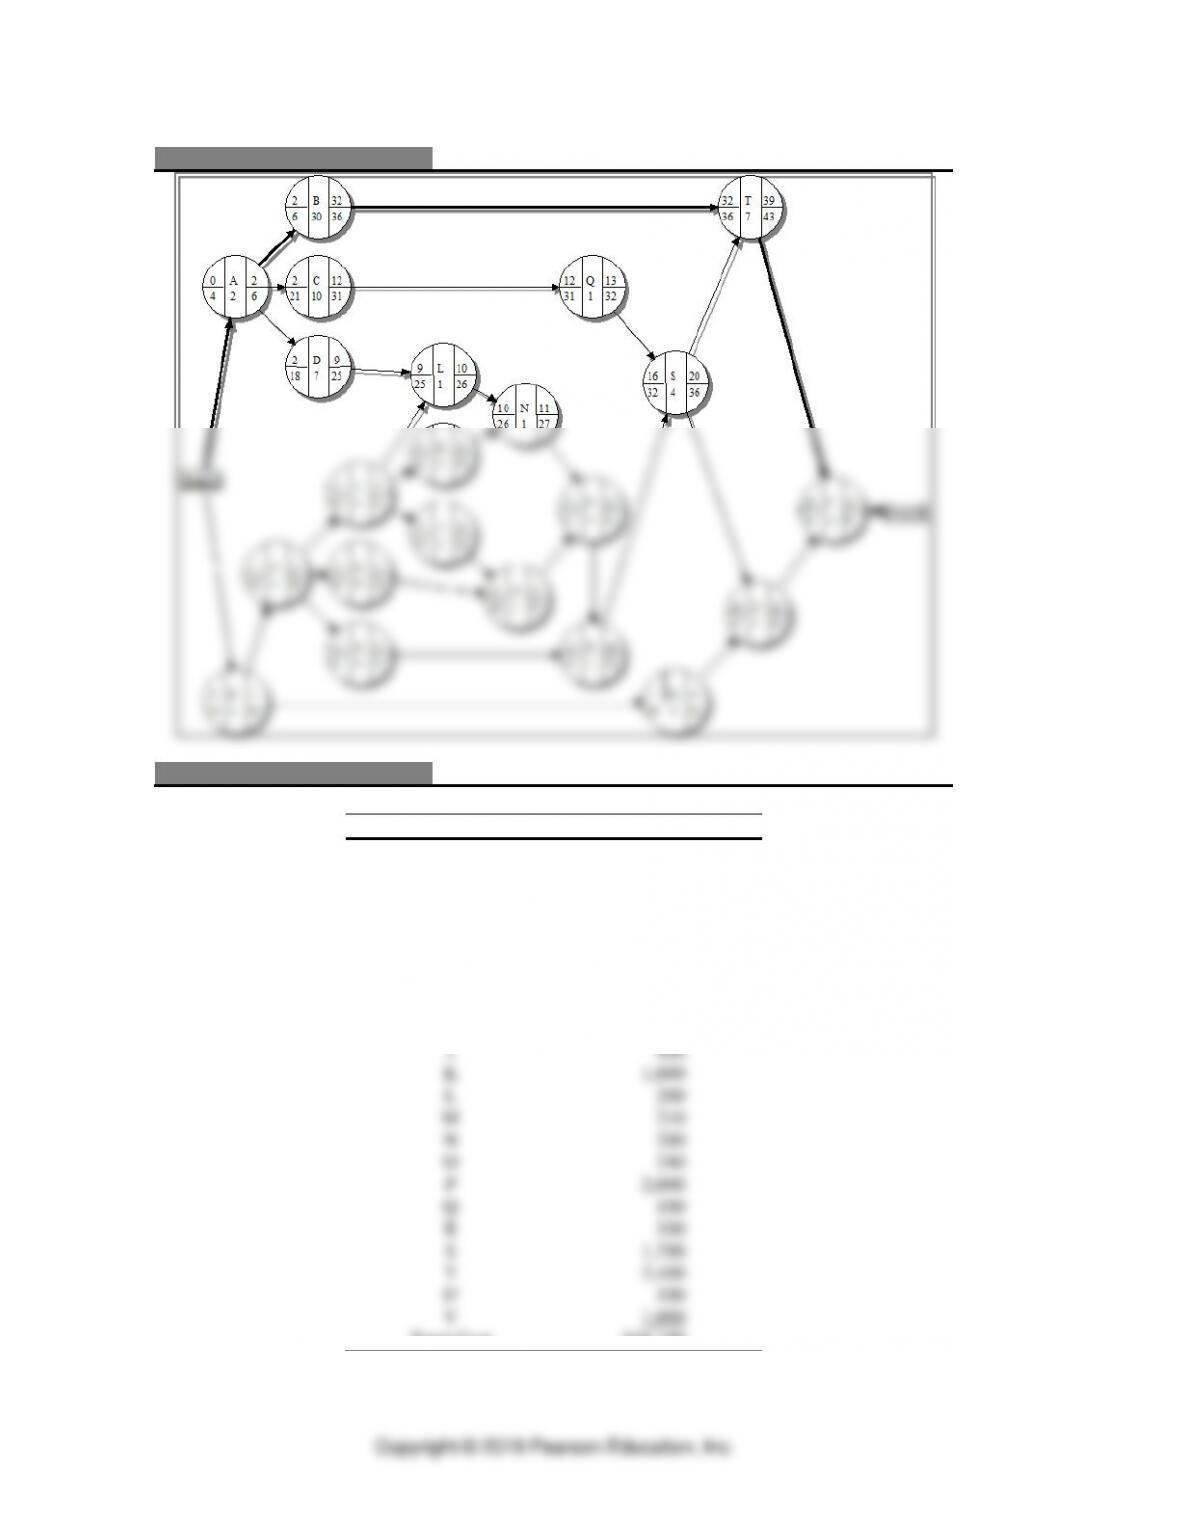
3. A PERT/CPM diagram is shown in Exhibit TN.2. The latest finish data are set
for 45 days from present, which would be the day before the car must be in the
show. The critical path is A–B–T–V, and the expected project duration is 41
days. The slack of each event along the critical path is 4 days, suggesting no
problem in completing the project on time.
4. A project budget is shown in Exhibit TN.3. The project will meet the goal of
staying below $70,000.
A cash-flow report is shown in Exhibit TN.4. It is aggregated by weekly time
periods. Activities B, C, and D are assumed to be paid when the item is received
$3,600.
D. Recommendations
The owner should:
1. Carefully evaluate the potential conflicts of competitive priorities for the new
restoration business.
2. Monitor the critical path of A–B–T–V, although there is slack.
3. Monitor the budget even though there should be ample room for unexpected
contingencies.
Teaching Suggestions
This case should be an overnight assignment so that the students have the
opportunity to think through the construction of the PERT/CPM diagram. This is
not a difficult assignment, even though there are 22 activities. If used for discussion
in class, it should be discussed after the PERT/CPM approach has been addressed in
Project Management ⚫ CHAPTER 7 ⚫
7-29
a previous class. Alternatively, the case could be used as a written assignment with
no debriefing during class.
The discussion should begin with the potential conflicts with competitive priorities
so that the class understands the strategic implications of the new restoration
business. There is not enough information in the case to make a definitive
conclusion, so the emphasis should be on the potential for conflicts and the need to
do some serious exploration.
The discussion can then turn to the network diagram and the conclusions. See
Exhibits TN.2 and TN.3 for suggestions.
E. Board Plan
Unique Tasks for Restoration Business
Competitive Priorities
Find parts no longer made
Top Quality
Manufacture unique parts
Customization
Low volumes
Custom body work
Custom paint work
New information system
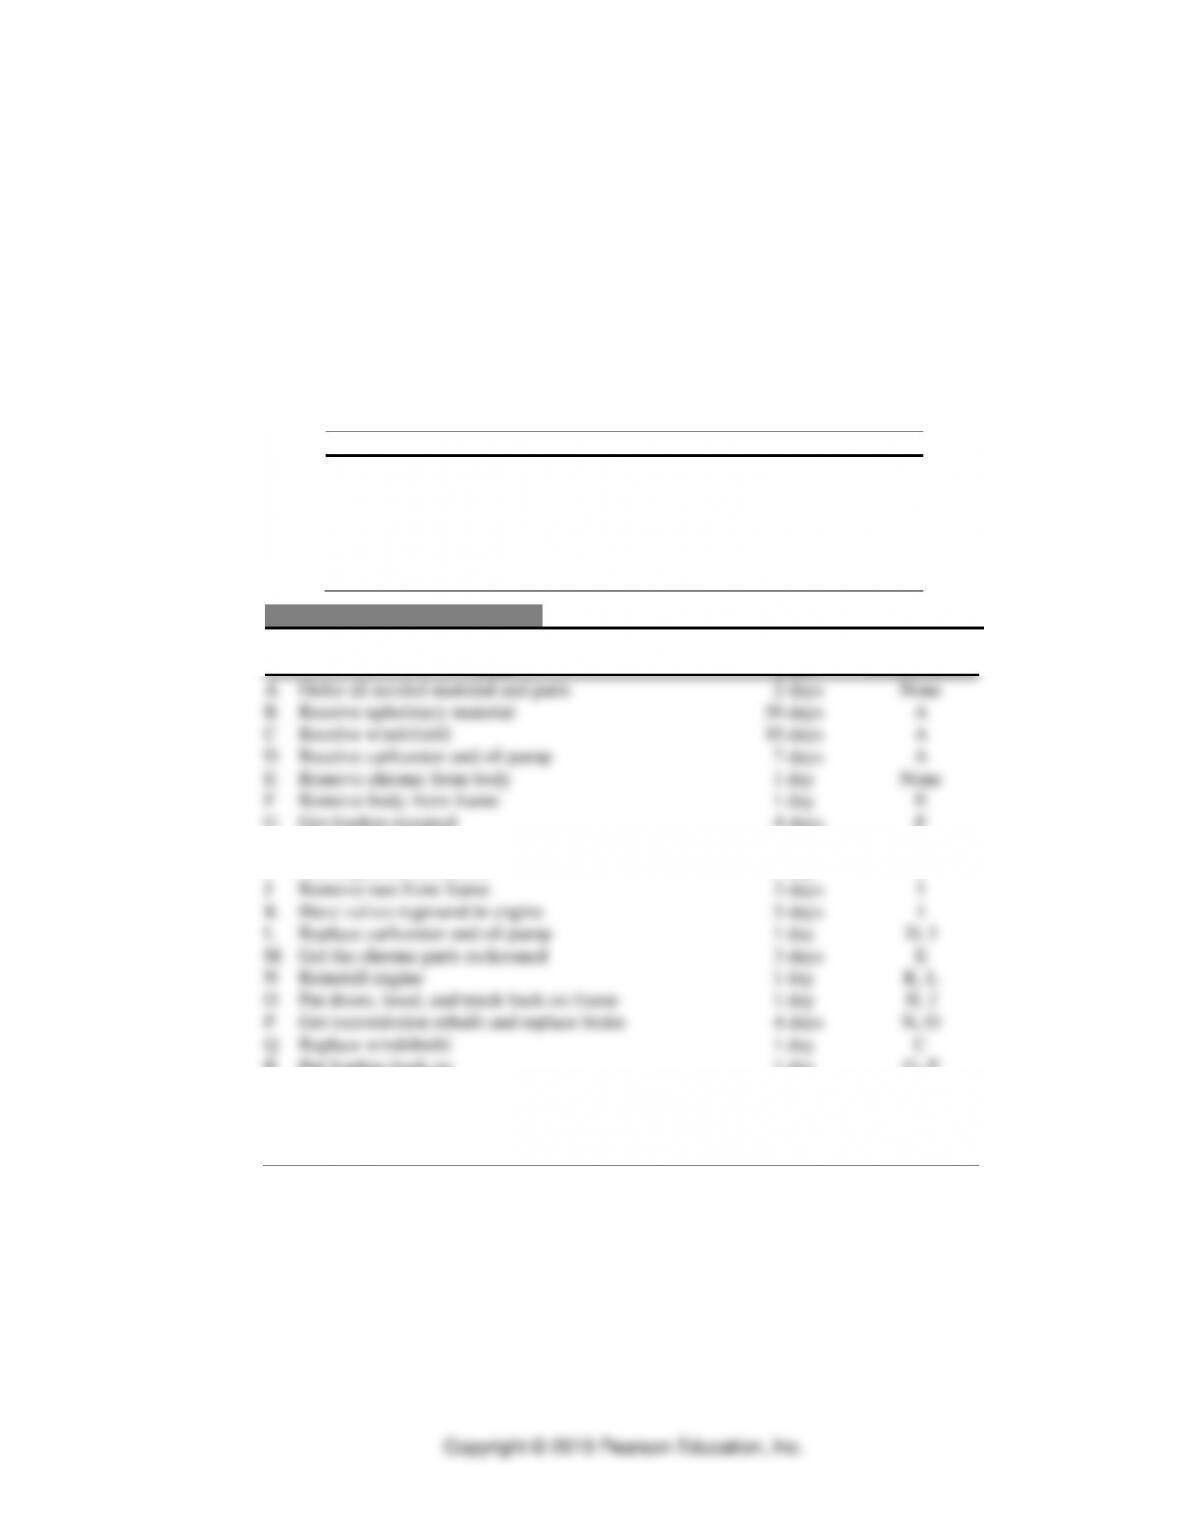
EXHIBIT TN.1
Table of Tasks
Immediate
Task
Time
Predecessors
A Order all needed material and parts
2 days
None
B Receive upholstery material
30 days
A
C Receive windshield
10 days
A
D Receive carburetor and oil pump
7 days
A
E Remove chrome from body
1 day
None
F Remove body from frame
1 day
E
G Get fenders repaired
4 days
F
H Repair the doors, trunk, and hood
6 days
F
I Pull engine from chassis
1 day
F
J Remove rust from frame
3 days
I
K Have valves reground in engine
5 days
I
L Replace carburetor and oil pump
1 day
D, I
M Get the chrome parts rechromed
3 days
E
N Reinstall engine
1 day
K, L
O Put doors, hood, and trunk back on frame
1 day
H, J
P Get transmission rebuilt and replace brake
4 days
N, O
Q Replace windshield
1 day
C
R Put fenders back on
1 day
G, P
S Get car painted
4 days
Q, R
T Reupholster interior of car
7 days
B, S
U Put chrome back on
1 day
M, S
V Pull car to Studebaker show in Springfield, Missouri
2 days
T, U
Part I Managing Processes
7-30
EXHIBIT TN.2
PERT/CPM Network
EXHIBIT TN.3
Project Budget for The PERT Mustang
Task
Estimated Cost
A
$100
B
2,100
C
800
D
1,750
E
200
F
300
G
1,000
H
1,500
I
200
J
900
K
1,000
L
200
M
210
N
200
O
240
P
2,000
Q
100
R
100
S
1,700
T
2,400
U
100
V
1,000
Total Cost
$18,100
Project Management ⚫ CHAPTER 7 ⚫
7-31
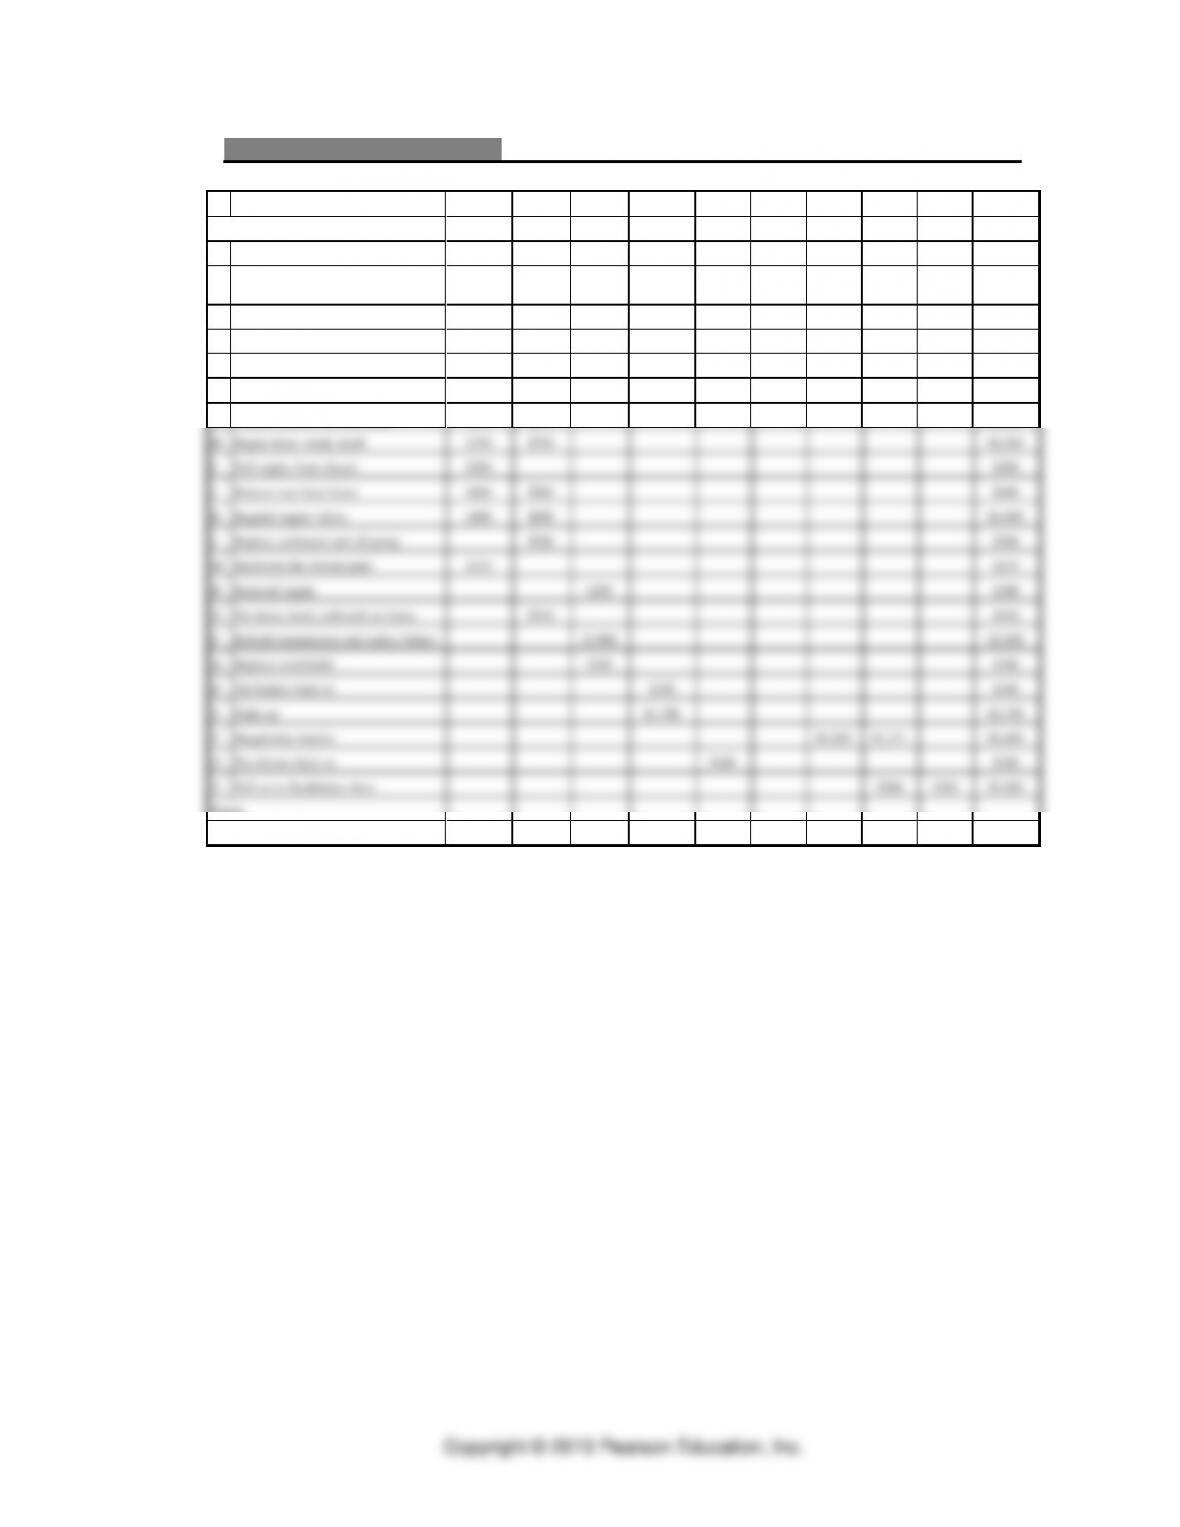
EXHIBIT TN.4
Cash Flow Report for The Pert Mustang
Based on 5–day weeks
1
2
3
4
5
6
7
8
9
Total
Start
A
Order needed material and parts
$100
$100
B
Receive upholstery material for seat
covers
$2,100
$2,100
C
Receive windshield
$800
$800
D
Receive carburetor and oil pump
$1,750
$1,750
E
Remove chrome from body
$200
$200
F
Remove body from frame
$300
$300
G
Fenders repaired by body shop
$750
$250
$1,000
H
Repair doors, trunk, hood
$750
$750
$1,500
I
Pull engine from chassis
$200
$200
J
Remove rust from frame
$600
$300
$900
K
Regrind engine valves
$400
$600
$1,000
L
Replace carburetor and oil pump
$200
$200
M
Rechrome the chrome parts
$210
$210
N
Reinstall engine
$200
$200
O
Put doors, hood, and trunk on frame
$240
$240
P
Rebuild transmission and replace brakes
$2,000
$2,000
Q
Replace windshield
$100
$100
R
Put fenders back on
$100
$100
S
Paint car
$1,700
$1,700
T
Reupholster interior
$1,029
$1,371
$2,400
U
Put chrome back on
$100
$100
V
Pull car to Studebaker show
$500
$500
$1,000
Finish
Total
$3,510
$4,090
$3,100
$1,800
$100
$0
$3,129
$1,871
$500
$18,100