
Chapter
7 Project Management
Project Management
TEACHING TIP
Introduce with Burj Khalifa, the tallest building in the world. The building of which took six years
and at its peak construction employed 12,000 employees from 100 countries. Construction of this
magnitude requires careful project management. The project consisted of four phases: definition
and organization, planning, execution and closeout.
1. A project is an interrelated set of activities that has definite starting and ending points and
that result in a unique product or service.
a. Common everyday life
• Planning weddings
• Remodeling bathrooms
• Writing term papers
• Organizing surprise parties
b. Business
• Conducting audits
• Planning mergers
• Creating advertising campaigns
• Reengineering processes
• Developing new products or services
• Establishing a strategic alliances
c. Three main goals of any project
• Complete the project on time or early
• Do not exceed the budget
• Meet the specifications to the satisfaction of the customers
2. Project management is a systemized, phased approach to defining, organizing, planning,
monitoring, and controlling projects, as a means to overcome the challenge.
3. Projects can be used to implement changes to operations strategy
4. Projects can also be used to implement changes to processes and value chains.
5. Projects may be under the overall purview of a single department, other departments likely
should be involved in the project.
6. Cross-functional interaction example: Consider an information systems project to develop a
corporate customer base.
a. Corporate banking services could be designed not only to better serve the corporate
customers, but also to provide a basis for evaluating the prices that the bank charges.
1. Defining and Organizing Projects
Successful projects begin with a clear definition of scope, objectives, and activities. A successful
project begins with clear understanding of its organization and how people are going to work
together to complete the project. In this section, the three important activities are discussed.
1. Define the scope and objectives of a project
a. Statement of scope (also known as the project objective statement)
• Statement of project objectives
b. Time frame: as specific as possible.
c. A specific statement of allocated resources in terms of dollars and/or full-time
equivalents of personnel time.
2. Select the project manager and team
a. Project manager—has the responsibility to integrate the efforts of people from various
functional areas to achieve specified project goals.
• Roles of the project manager
Facilitator: must resolve conflicts between individuals or departments to ensure
that the project has the appropriate resources for the job to be completed.

Dedication
b. Project team—a group of people that often represent different functional areas or
organizations.
3. Recognizing organizational structure
2. Constructing Project Networks
After the project is defined and the project organized, the team must formulate a plan that
identifies the specific activities to be accomplished and a schedule for their completion. Planning
projects involve five steps.
1. Defining the work breakdown structure (WBS)
a. A statement of all work that has to be completed.
b. Identify all work activities.
c. Generate a hierarchy to the work breakdown: major work components are broken down
to smaller activities.
d. Activities are the smallest unit of work effort that consumes both time and resources that
a project manager can schedule and control.
e. Each activity in the WBS must have an “owner” who is responsible for doing the work.
2. Diagramming the network.
a. Network planning methods can help managers monitor and control projects.
b. These methods treat a project as a set of interrelated activities that can be visually
displayed in a network diagram consisting of nodes and arcs.
c. Two planning methods were developed in the 1950s.
• Program evaluation and review technique (PERT)
• Critical path method (CPM)
• Although earlier versions differed, today the differences are minor. Hence in this
book for the purpose of discussion they are referred to collectively as PERT/CPM.
• Benefits to project managers
d. Establishing precedence relationships
e. Estimating activity times
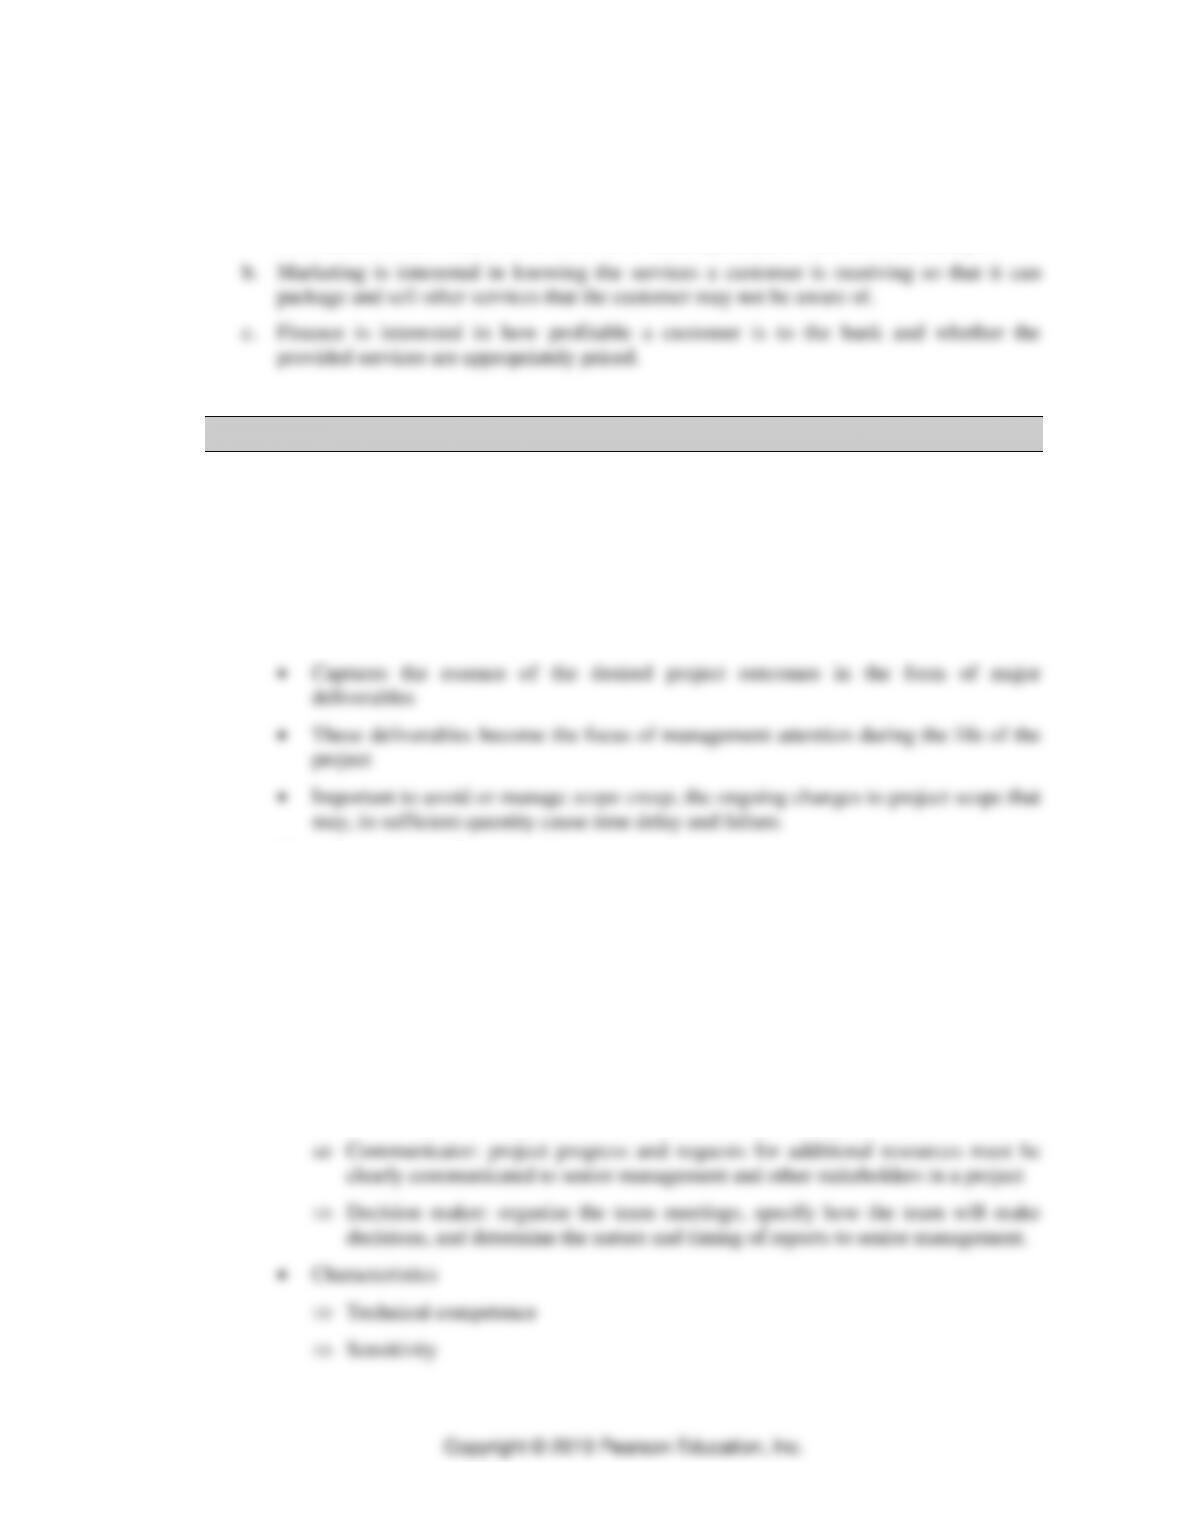
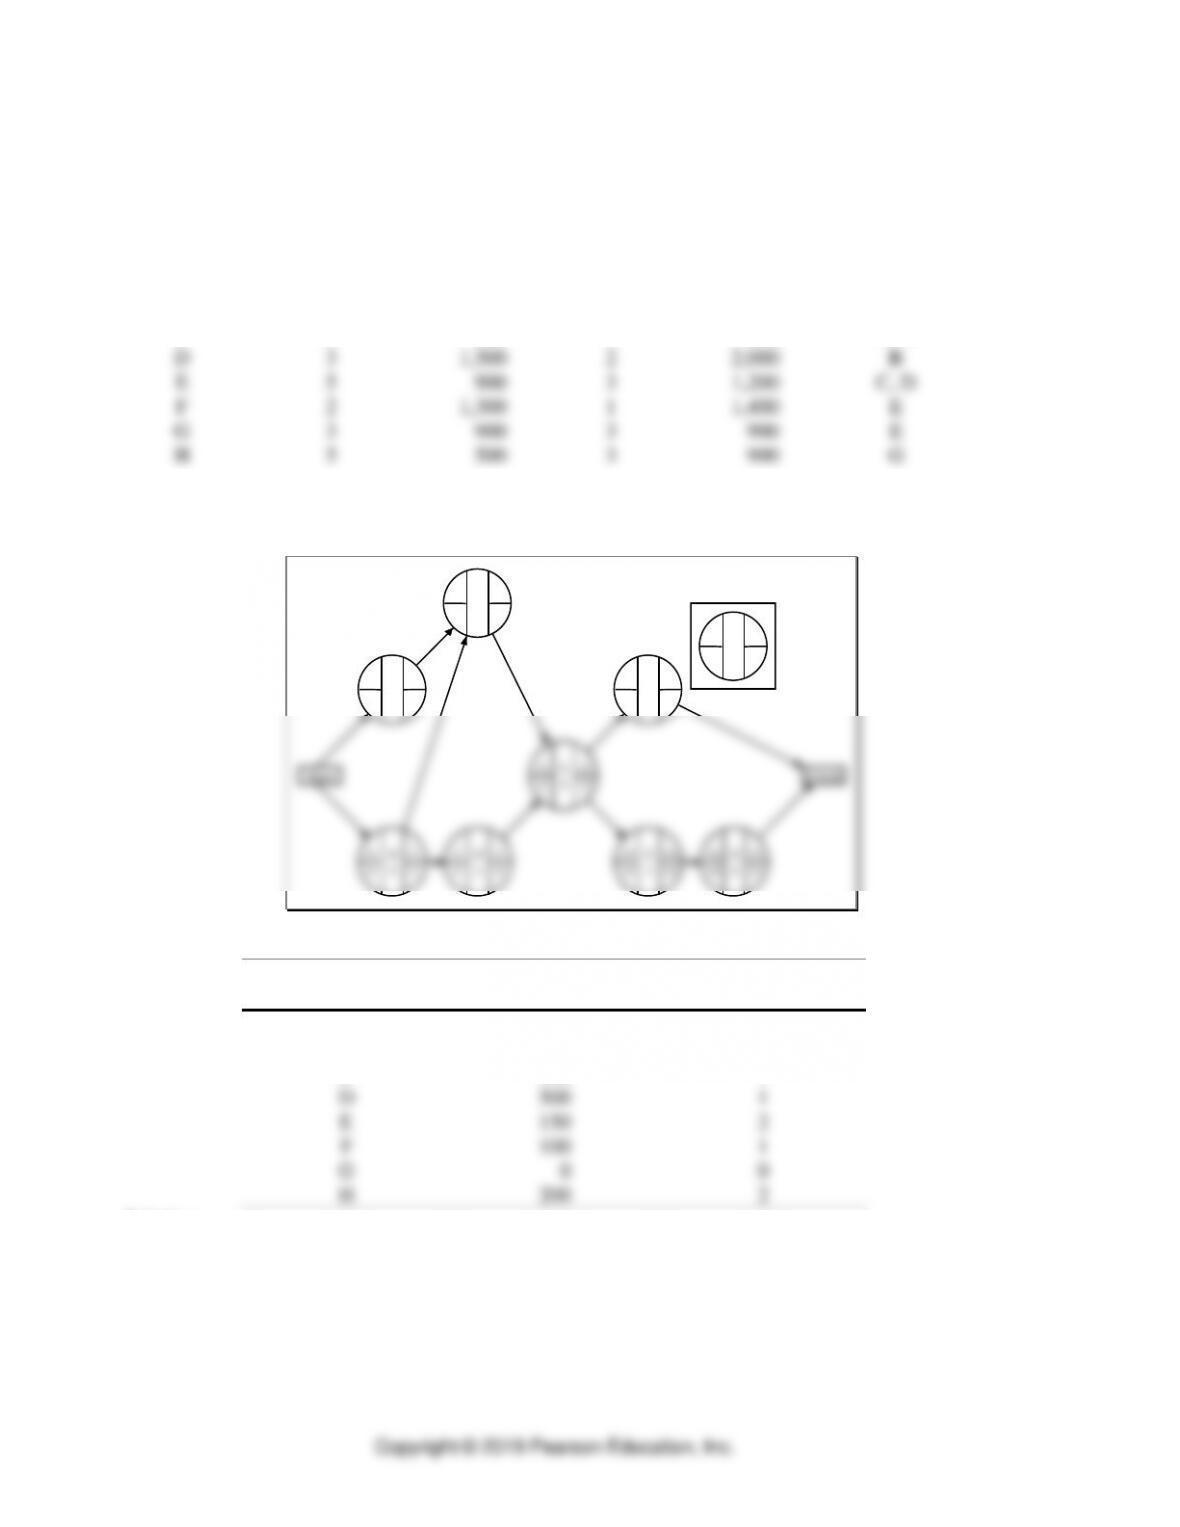
f. Using the Activity-on-Node (AON) approach
• Nodes are activities and arcs show precedence relationships
• Activity-oriented
Use Example 7.1: Diagramming the St. John’s Hospital Project
Use Application 7.1 (note: this is problem 2)
The following information is known about a project
Activity
Activity Time (days)
Immediate
Predecessor(s)
A
7
—
B
2
A
C
4
A
D
4
B, C
E
4
D
F
3
E
G
5
E
Draw the network diagram for this project
A
7
D
4
E
4
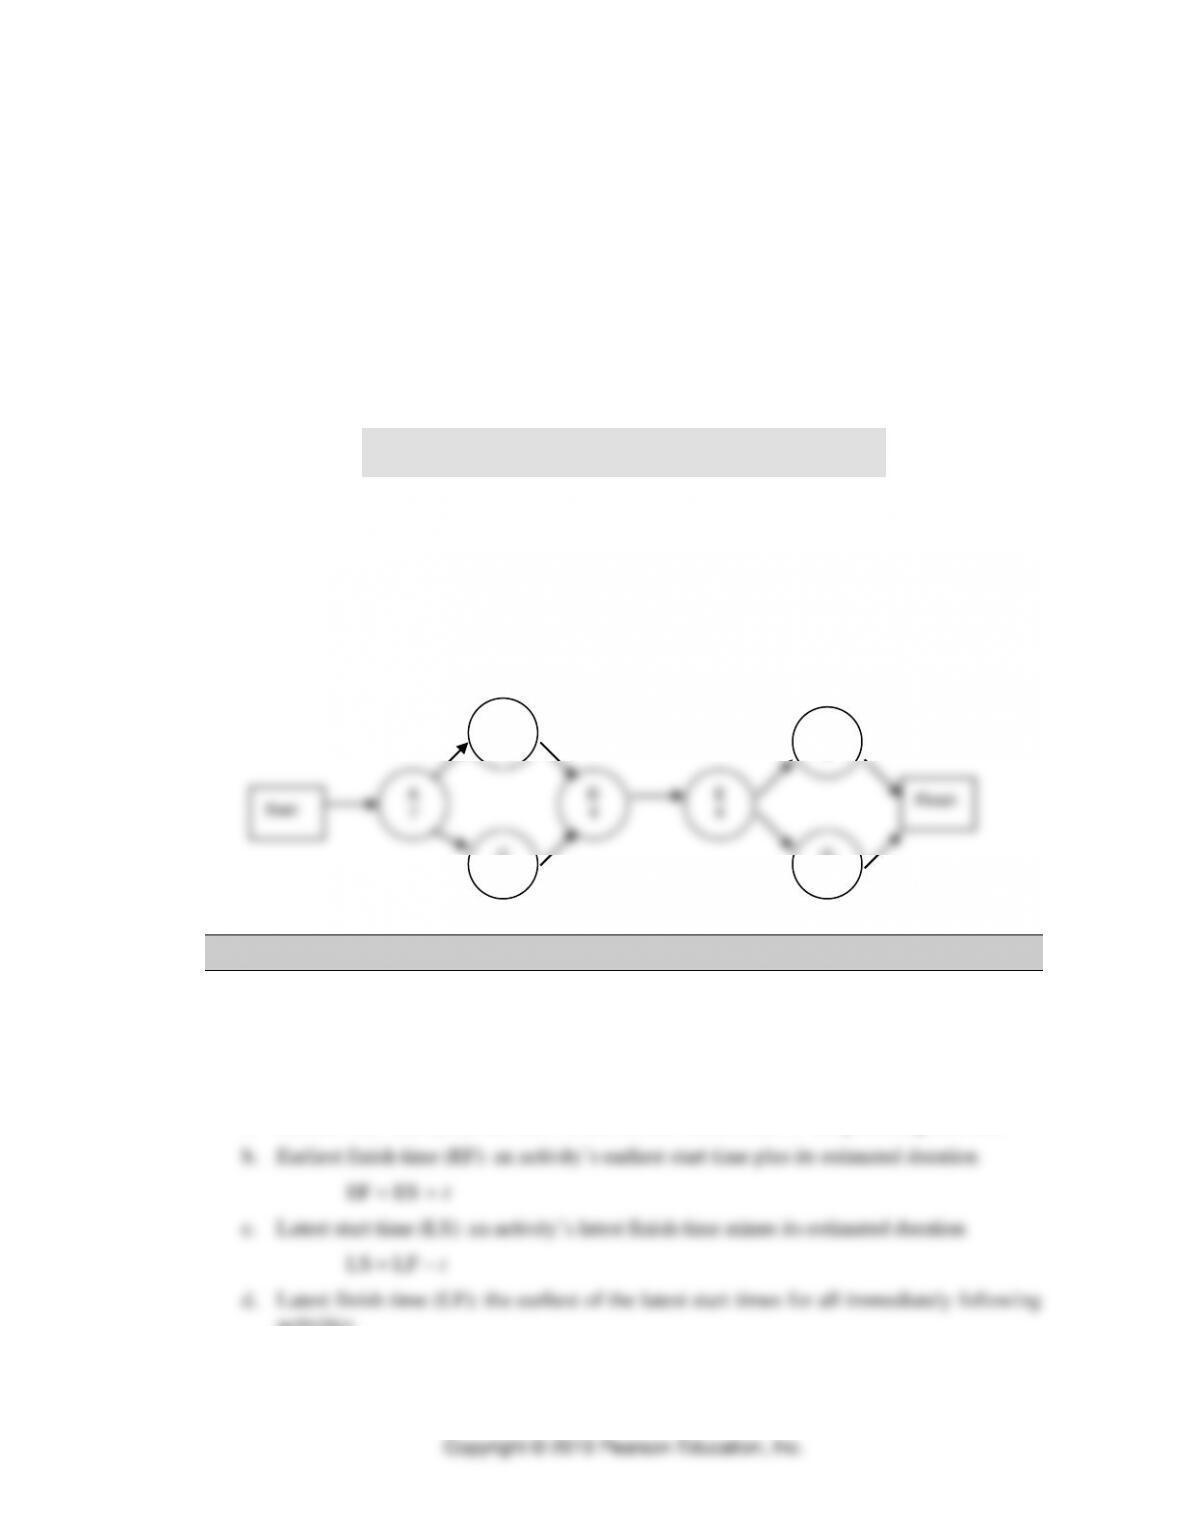
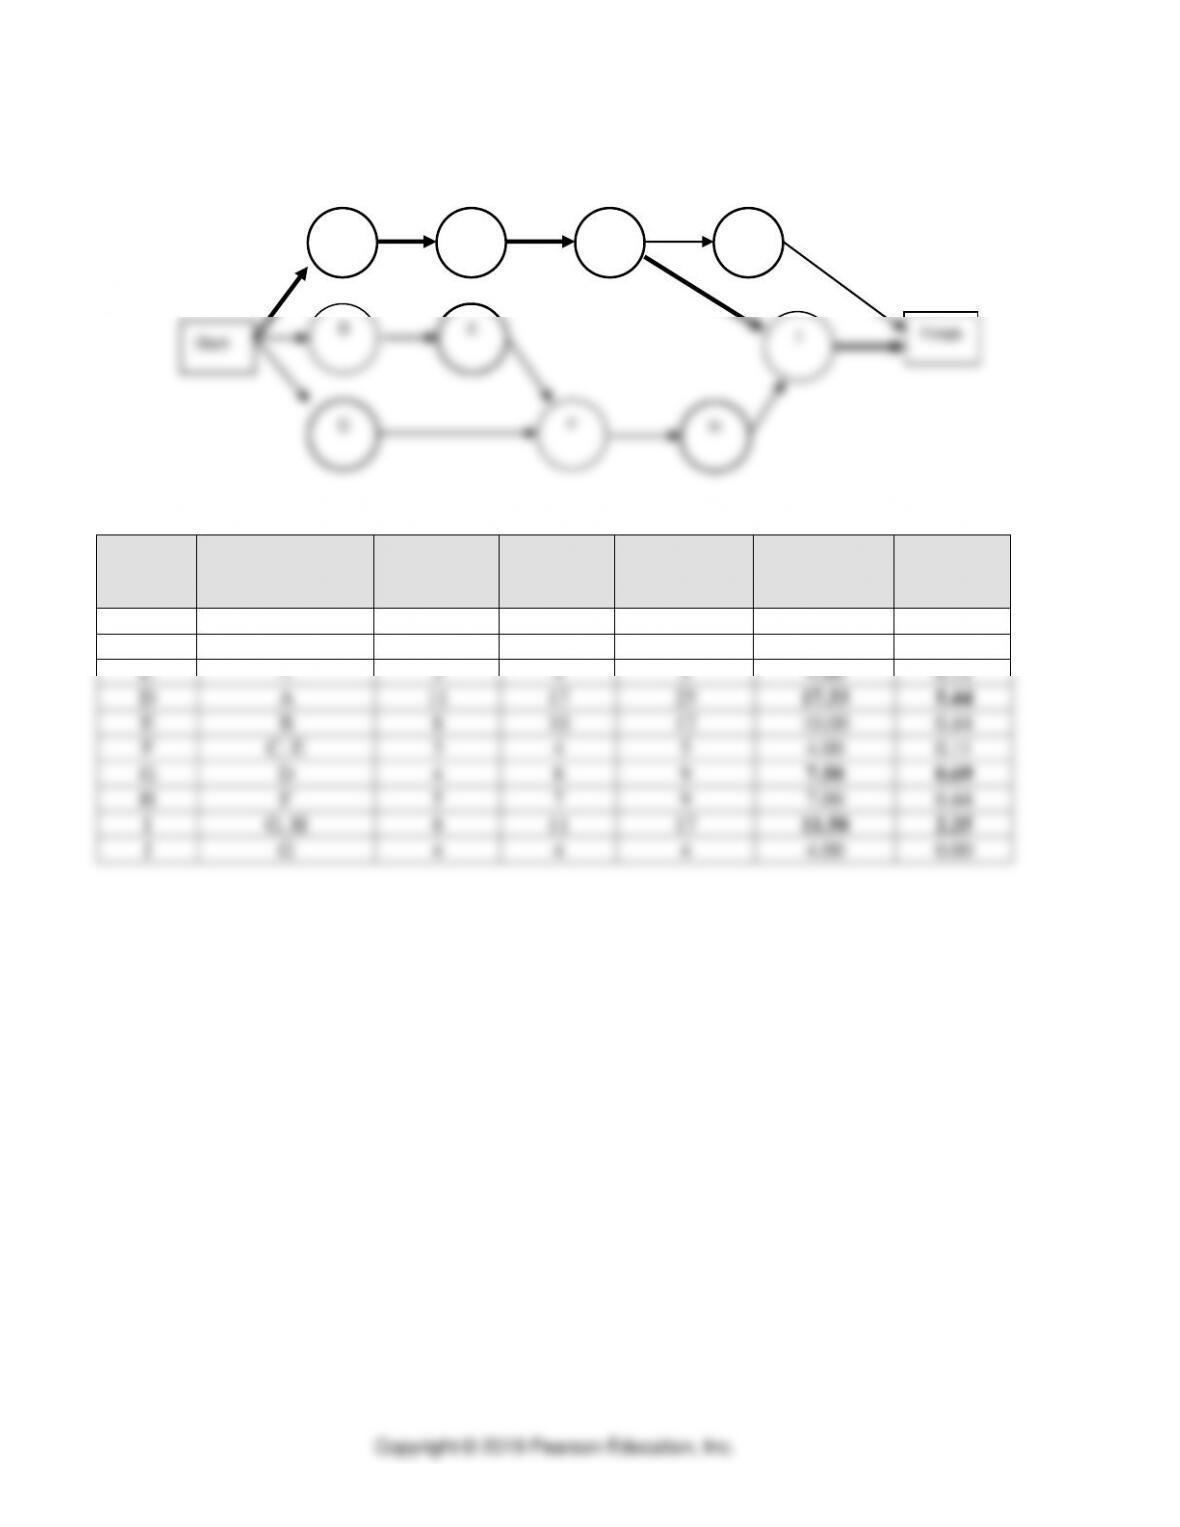
3. Developing the Project Schedule
1. The critical path is the sequence of activities between a project’s start and finish that takes the
longest time to complete
2. Project schedule is specified by the start and finish times for each activity.
a. Earliest start time (ES): the latest of the earliest finish times of the preceding activities
activities
Use Example 7.2: Calculating Start and Finish Times for the Activities
B
2
C
4
F
3
G
5
Active Model 7.2 in MyLab Operations Management provides additional insight on Gantt
charts and their uses for the St. John’s Hospital project (example 2.1).
3. Activity slack is calculated from four times for each activity
a. Activity slack: maximum time an activity can be delayed without delaying the entire
project
b. Activity slack can be calculated in one of two ways
S = LS – ES or S = LF– EF.
c. Activities on the critical path have with zero slack
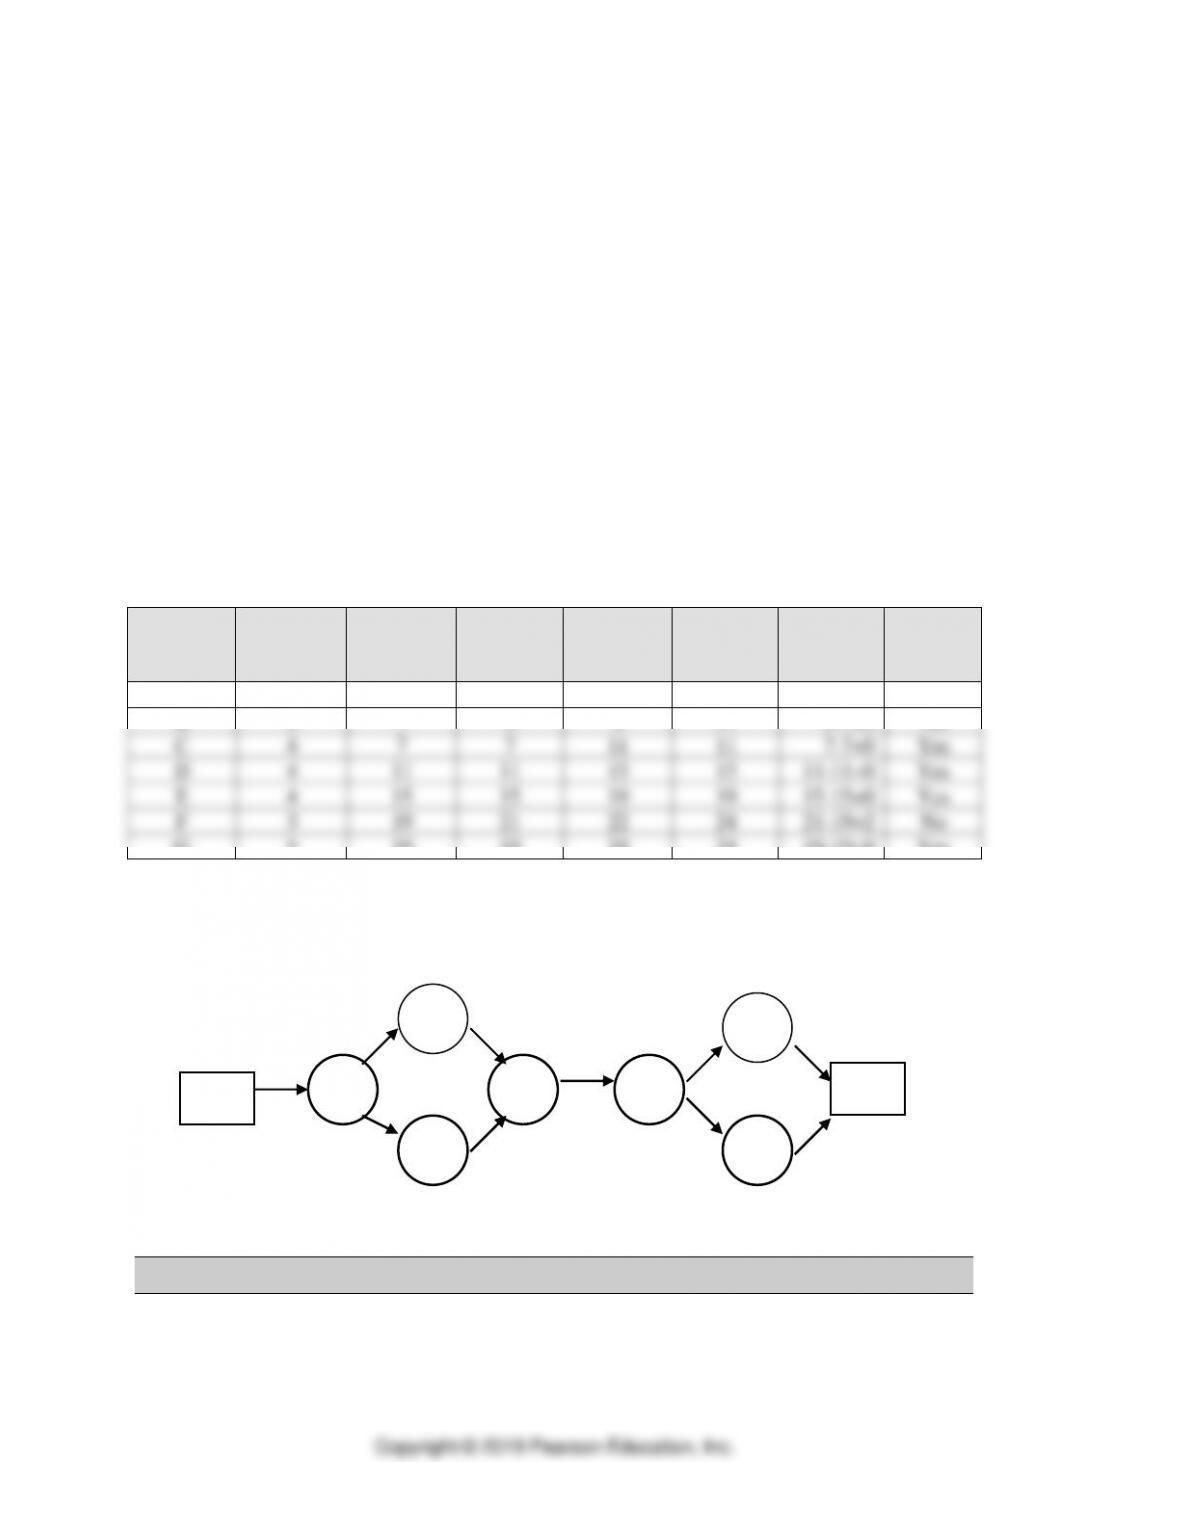
Use Application 7.2 (note: this is problem 2)
Calculate the four times for each activity in order to determine the critical path and
project duration.
Activity
Duration
Earliest
Start
(ES)
Latest
Start
(LS)
Earliest
Finish
(EF)
Latest
Finish
(LF)
Slack
(LS-ES)
On the
Critical
Path?
A
7
0
0
7
7
0-0=0
Yes
B
2
7
9
9
11
9-7=2
No
C
4
7
7
11
11
7-7=0
Yes
D
4
11
11
15
15
11-11=0
Yes
E
4
15
15
19
19
15-15=0
Yes
F
3
19
21
22
24
21-19=2
No
G
5
19
19
24
24
19-19=0
Yes
The critical path (bold path) is A-C-D-E-G with project duration of 24 days.
4. Analyzing Cost-Time Tradeoffs
Analyze cost-time trade-offs
Total project costs
Start
A
7
B
2
C
4
D
4
Finish
E
4
F
3
G
5
Direct costs (labor, materials, and any other costs directly related to project activities)
Indirect costs (administration, depreciation, financial, and other variable overhead
costs that can be avoided by reducing total project time)
Penalty costs (a project may incur penalty costs if it extends beyond some specific
date, whereas an incentive may be provided for early completion)
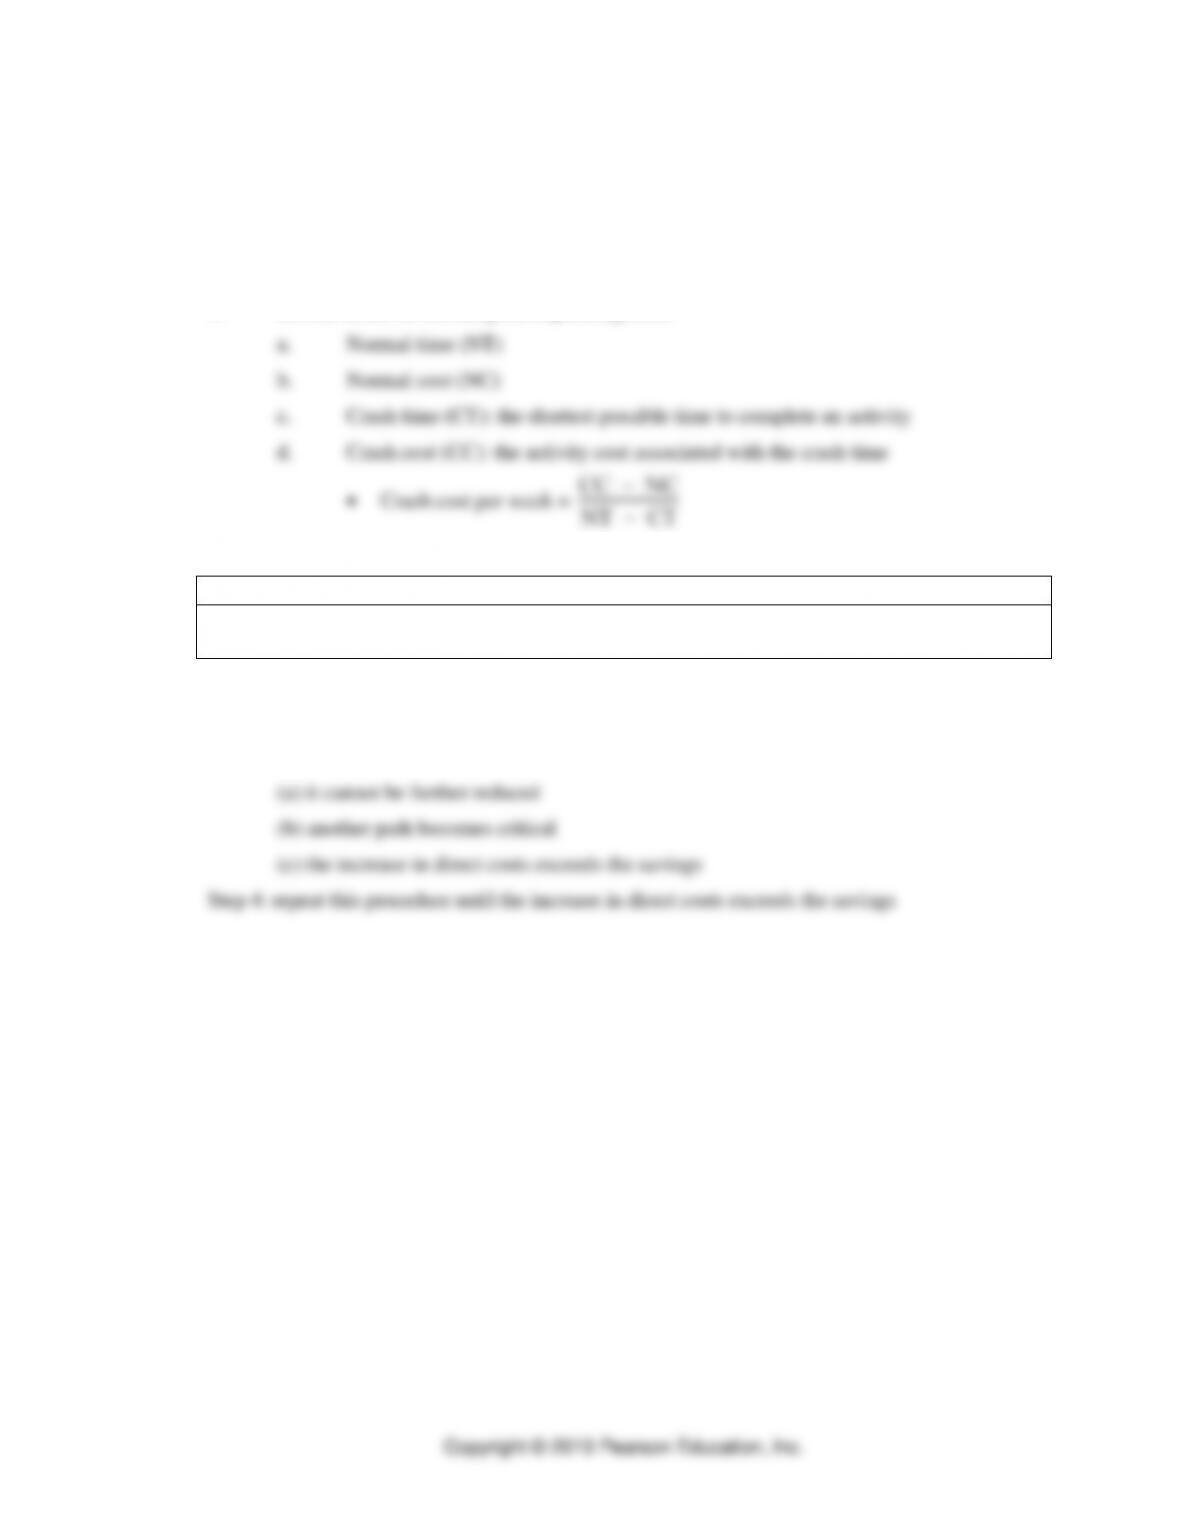
1. Cost to Crash or Crashing (or expediting) cost
NT − CT
2. Minimizing Costs
TEACHING TIP
As this is a complicated analysis, we do not suggest making this an application to be completed
by the students in class. It is usually best to walk them through the procedure.
Step 1: determine the critical path
Step 2: find the activity (or activities) on the critical path(s) with the lowest cost of crashing
Step 3: reduce the time for this activity until
Use Application 7.3 (note: this problem is similar to problem 13)
Project Activity and Cost Data (note: this is Table 2.6 from the Problems)
Activity
Normal Time
(days)
Normal
Cost ($)
Crash
Time (days)
Crash
Cost ($)
Immediate
Predecessor(s)
A
5
1,000
4
1,200
—
B
5
800
3
2,000
—
C
2
600
1
900
A, B
D
3
1,500
2
2,000
B
E
5
900
3
1,200
C, D
F
2
1,300
1
1,400
E
G
3
900
3
900
E
H
5
500
3
900
G
Indirect project costs= $250 per day and penalty cost = $100 per day for each day the project lasts
beyond day 14.
13
19
F
2
15
21
13
13
G
3
16
16
5
5
D
3
8
8
8
8
E
5
13
13
5
6
C
2
7
8
0
0
B
5
5
5
0
1
A
5
5
6
Start
ES
LS
ID
DUR
EF
LF
16
16
H
5
21
21
Finish
Direct cost and time data for the activities:
Maximum Crash
Activity
Crash Cost/Day
Time (days)
A
200
1
B
600
2
C
300
1
D
500
1
E
150
2
F
100
1
G
0
0
H
200
2
Solution:
Original costs:
Normal Total Costs = $7,500
Total Indirect Costs = $250 per day * 21 days = $5,250
Penalty Cost = $100 per day * 7 days = $700
Total Project Costs = $13,450

STAGE 1
Step 1: The critical path is B–D–E–G–H, and the project duration is 21 days.
Step 2: Activity E on the critical path has the lowest cost of crashing ($150 per day). Note that
activity G cannot be crashed.
Step 3: Reduce the time (crashing 2 days will reduce the project duration to 19 days) and re-
calculate costs:
Step 4: repeat this procedure until direct costs are greater than or equal to savings
STAGE 2
(step 1) the critical path is B–D–E–G–H, and the project duration is 19 days.
(step 2) Activity H on the critical path has the next lowest crashing cost ($200 per day).
(step 3) Reduce the time (crashing 2 days will reduce the project duration to 17 days) and re–
calculate costs.
Note that the cost to crash ($200 per day) is less than the combined indirect cost and the penalty
cost per day savings ($350).
(step 4):repeat the procedure
STAGE 3
(step 1) the critical path is B–D–E–G–H, and the project duration is 17 days.
(step 2) Activity D on the critical path has the next lowest crashing cost ($500 per day).
(step 3) Reduce the time (crashing 1 day will reduce the project duration to 16 days) and re-
calculate costs.
Costs Last Trial = $7,800 + $400 (the added crash cost) = $8,200
(step 4) We stop the crashing process and accept the solution from STAGE 2. Note that the cost to
crash ($500 per day) is greater than the combined indirect cost and the penalty cost per day savings
($350).
A summary of the cost analysis follows. The recommended completion date is day 17 by crashing
activity E by 2 days and activity H by 2 days.

Resulting
Reduc-
Project
Costs
Crash
Total
Total
Total
Crash
Critical
tion
Duration
Last
Cost
Indirect
Penalty
Project
Trial
Activity
Paths
(days)
(days)
Trial
Added
Costs
Costs
Costs
0
—
B–D–E–G–H
—
21
$7,500
—
$5,250
$700
$13,450
1
E
B–D–E–G–H
2
19
$7,500
$300
$4,750
$500
$13,050
2
H
B–D–E–G–H
2
17
$7,800
$400
$4,250
$300
$12,750
Further reductions will cost more than the savings in indirect costs and penalties.
The critical path is B–D–E–G–H.
Use Example 7.3: Find a Minimum-Cost Schedule
Active Model 7.2 in MyLab Operations Management provides additional insight on cost
analysis for the St. John’s Hospital project
5. Assessing and Analyzing Risks
TEACHING TIP
Mention Managerial Practice 7.1: “San Francisco – Oakland Bay Bridge” (1) Projects of this
size and complexity are inherently risky (2) contingency plans should cover the most likely
disruptions (3) Schedule and budget problems are not unusual (4) The job of project managers is
to manage the risks and minimize the deviations.
1. Risk is the measure of the probability and consequence of not reaching a defined project
goal and involves the notion of uncertainty as it relates to project timing and costs.
a. Risk-management plans
• Strategic fit: not clearly linked to the strategic goals of the firm
• Service/product attributes (market, technological, or legal risks)
• Project team capability: may not have the capability to complete the project
successfully because of the size and complexity of the project or the
technology involved
• Operations (poor information accuracy, lack of communication, missing
precedence relationships, bad estimates for activity times)
b. Simulation
• Using PERT/CPM to quantify risks
TEACHING TIP
To incorporate uncertainty into the network model, probability distribution can be calculated
using two approaches: computer simulation (see “Simulation” Supplement E) and statistical
analysis
2. Statistical analysis
• Optimistic time (a): shortest time an activity can be completed
• Most likely time (m): best estimate of probable time
6
Use Example 7.4: Calculating Means and Variance
Use Application 7.4 (note: this is problem 23)
Bluebird University: activity for sales training seminar. The bold-faced items
represent the activities on the critical path.
E
H
Activity
Immediate
Predecessor(s)
Optimistic
(a)
Most
Likely
(m)
Pessimistic
(b)
Expected
Time
(te)
Variance
(σ2)
A
—
5
7
8
6.83
0.25
B
—
6
8
12
8.33
1.00
C
—
3
4
5
4.00
0.11
D
A
11
17
25
17.33
5.44
E
B
8
10
12
10.00
0.44
F
C, E
3
4
5
4.00
0.11
G
D
4
8
9
7.50
0.69
H
F
5
7
9
7.00
0.44
I
G, H
8
11
17
11.50
2.25
J
G
4
4
4
4.00
0.00
A
D
G
J

3. Analyzing probabilities
Using the z-transformation formula:
Z=T−TE
2
where:
T
= due date of project
TE
= earliest expected completion date
2
= sum of variances on the critical path
4. Near-critical paths
Use Example 7.5: Calculating the Probability of Completing a Project by a Given Date
Use Application 7.5 (note: this is problem 23)
The director of the continuing education at Bluebird University wants to conduct the seminar in
47 working days from now. What is the probability that everything will be ready in time?
The critical path is A–D–G–I, and the expected completion time is 43.16 days.
T = 47 days, TE = 43.16 days, and the sum of the variances for the critical activities is: (0.25 +
5.44 + 0.69 + 2.25) = 8.63.
2
47 43.16 3.84 1.31
2.94
8.63
E
TT
z
−−
= = = =
Assuming the normal distribution applies, we use the table for the normal probability distribution.
Given z = 1.31, the probability that activities A–D–G–I can be completed in 47 days or less is
0.9049.
Active Model 7.3 in MyLab Operations Management provides additional insight on
probability analysis for the St. John’s Hospital project (example 7.1).
6. Monitoring and Controlling Projects
1. Monitoring project status
a. Open issues: should remind the project manager of due dates for open issues and who
was responsible for seeing that they are resolved.
b. Risks: should provide the status of each risk to project delays specified in the risk
management plan so that the team can review them at each meeting.
c. Schedule status: should provide periodic monitoring of slack time in the project schedule
can help the project manager control activities along the critical path.
2. Monitoring project resources
a. Project life-cycle: four major phases
• Definition and organization
• Planning
• Execution
• Close out
TEACHING TIP
Most resources are consumed in the execution phase
b. Options for managing and alleviating resource problems
3. Controlling projects
a. Project managers have the responsibility of accounting for the effective use of the firm’s
resources as well as managing activities to achieve the time and quality goals of the
project
b. Projects provide a rich environment for developing future leaders
c. Close out