
Constraint Management ⚫ CHAPTER 5
5-15
and delivery performance is deteriorating. The company must do a better job of aligning
its market strategy with its manufacturing strategy using the theory of constraints.
Because the case is a simulation involving teams, it can be used to emphasize the need
for collaboration between the marketing and manufacturing functions. Team members
can represent Marketing, Manufacturing, and Accounting/Finance. It could also be used
at the end of the course to emphasize the interrelatedness of manufacturing strategy,
inventory management, and master scheduling. The case provides the basis for a
discussion of the theory of constraints and how it can be used to identify the markets the
manufacturing system can best support.
B. Simulation
The simulation is designed for one class period. The number of weeks the simulation
can cover is up to the instructor, depending on the time available. The recommended
procedure is to assign the case and make the team assignments the session before the
simulation is to be conducted, asking the students to read the case and think about the
possible strategies that might be successful. On class day, the introduction to the case
and review of exhibits will take about 20 minutes. The first period of play takes the
longest time, with each successive period requiring less time. Be prepared to answer
many questions about the details of the simulation in the first few periods of play. The
analysis of the results will take another 20 minutes, depending on the depth the
instructor wants to discuss. All together, a simulation of 6 weeks should take about 100
minutes, including introduction and analysis. If 100 minutes is too long, consider
discussing the analysis in the following period.
If your class is only 75 minutes long, consider making the team assignments the class
before the simulation day. Go through the first four points listed below to preserve time
for specific questions and game play. The assignment for the teams is to prepare the first
week’s production schedule before game day.
The following is a suggested outline for the simulation, including ten periods of
demand/order information.
1. Review the game instructions in the case. Provide all students with the Min-Yo
Guide prior to simulation day (see below). Assign students to teams if you have not
already done so. Get each member of the team to play one of the following roles:
Marketing, Manufacturing, or Accounting/Finance. Teams of three are ideal, but
four members are fine. Rather than using teams with five members, consider using
teams of two and three.
2. Distribute the company report to each team. The company report contains the
changeover times for each product on the garment maker. The report has the
changeover times for Dragon Shirts high, thereby making smaller orders of Dragon
Shirts a bad choice for Min-Yo. The instructor can change the setup times to create a
different environment for the simulation.
3. Review Exhibit 1, Exhibit 2, Exhibit 3 and Exhibit 4. Make sure everyone is
comfortable with the mechanics of working with the Min-Yo Tables spreadsheet and
the Open Order file, Profit & Loss statement, Production Schedule, and Summary.
Use the following trial period data for the demonstration of the spreadsheet:
• Suppose there are Dragon order opportunities as follows:
Order 1 50 due wk 1
⚫ PART 1 ⚫ Managing Processes
5-16
Order 2 95 due wk 2
Order 3 80 due wk 2
Order 4 100 due wk 3
Thunder Order 150 due wk 2
• Suppose you decide to accept the Thunder Shirt order and Dragon Orders 1 and
4. (See Exhibit 1).
• Show Exhibit 2, which shows the Week 1 schedule. Notice that Order 1 of
Dragons and the past-due order of Thunders are automatically entered. The past-
due order of Thunders (see case) does not have to be put in the Open Order file.
• Make a production decision for Muscle shirts based upon a forecast. Suppose it
• Show Exhibit 3, which has the P&L statement. It is automatically updated for all
decisions and now awaits the instructor’s information on Muscle Demand for
the week. Suppose it is 500 units. Show the completed P&L statement.
• Show Exhibit 4, which keeps track of the team’s profit performance over the
course of the simulation.
4. Explain the importance of the open order file in Exhibit 1. Any order entered in the
file is considered a commitment by the firm and must be honored. The spreadsheet is
driven by the Open Order file for Thunder and Dragon orders. The file also has a
row for the production schedule for Muscle Shirts. Currently there is a past due
demand of 200 Thunder Shirts due in week 1. Other points to make at this time
include:
5. Start the simulation. The following is a week-by-week suggestion for the demands
and order sizes for Thunder Shirts and Dragon Shirts. Dragon Shirt opportunities
will be announced using an “order number” to emphasize that each order is different.
Constraint Management ⚫ CHAPTER 5
5-17
Min-Yo does not have to accept any of these orders, but decisions to accept or reject
them must be made. Because order opportunities are known at the start of a week,
some orders for Dragon Shirts will manifest themselves in the same week they are
due.
Week 1.
(1) New orders for Dragon Shirts
Order 1 100 Due week 1
Order 2 200 Due week 1
Week 2.
(1) New orders for Dragon Shirts
Order 5 200 Due week 2
Order 6 180 Due week 2
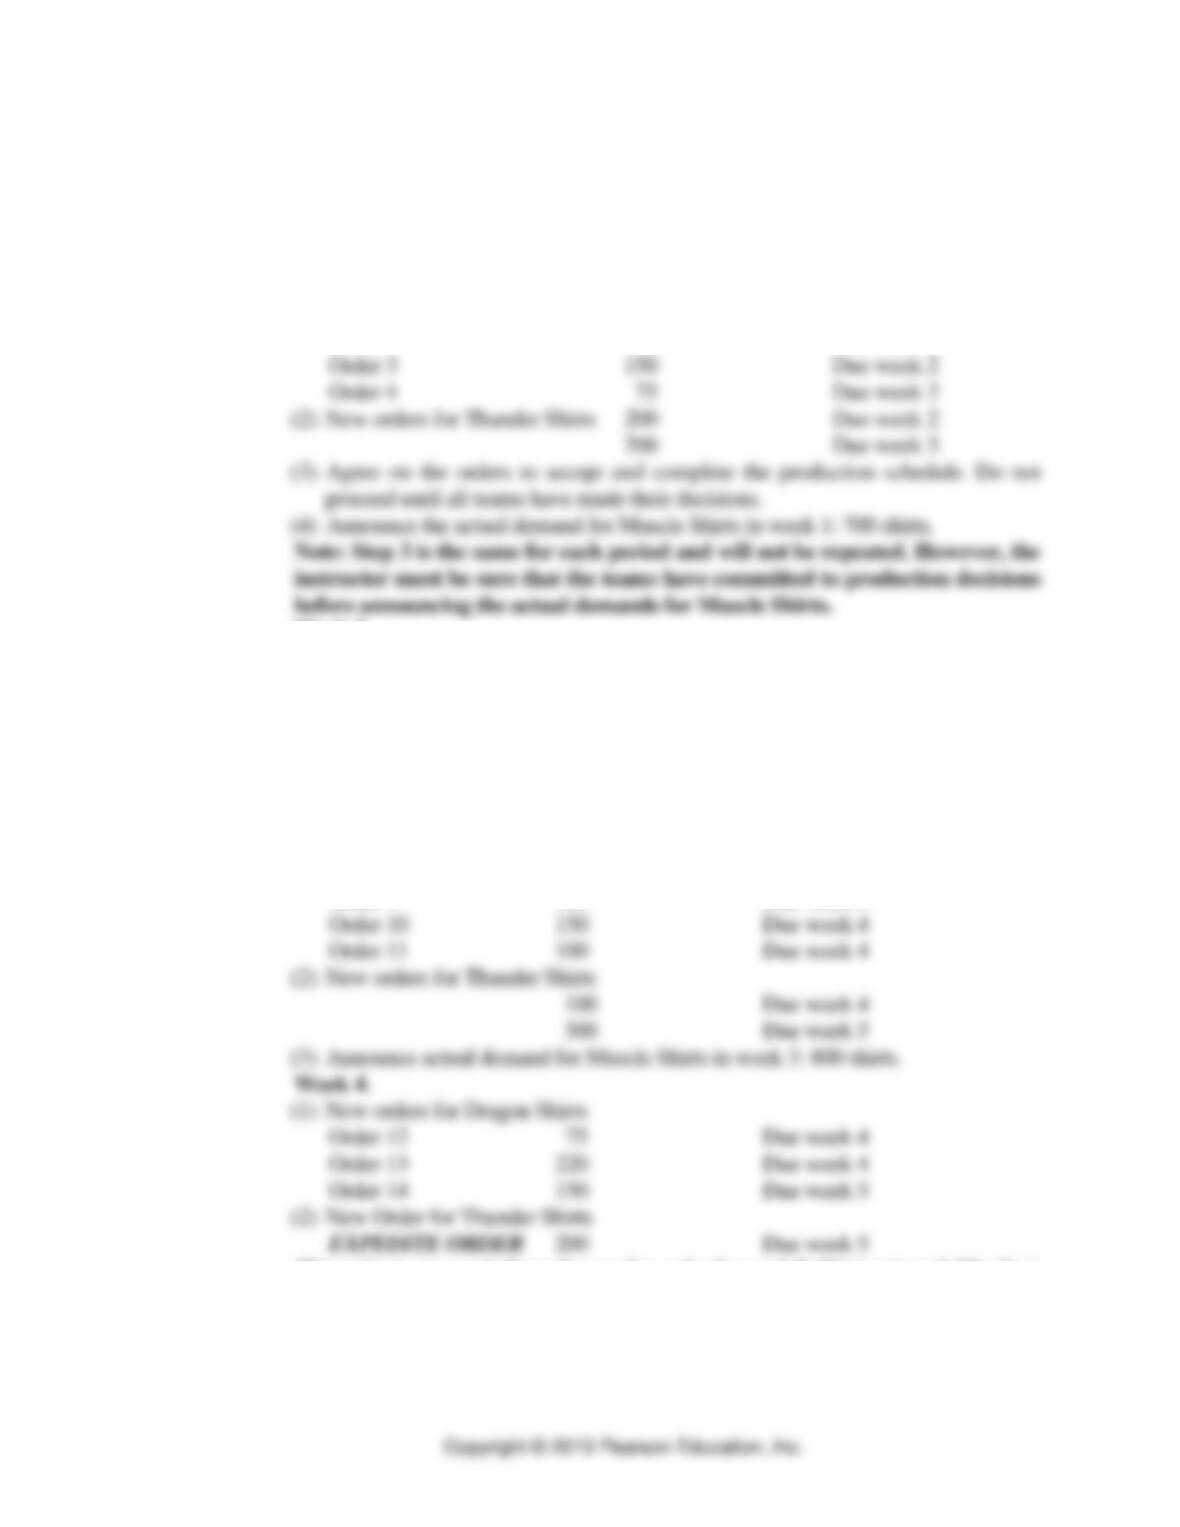
Order 7 300 Due week 3
(2) No new orders for Thunder Shirts
(3) Announce actual demand for Muscle Shirts in week 2: 600 shirts.
Week 3.
(1) New orders for Dragon Shirts
Order 8 50 Due week 3
Order 9 125 Due week 3
This order is over and above the regular order for week 5. If it is rejected, Min-Yo is
out of the Thunder Shirt business.
(3) Announce the actual demand for Muscle Shirts: 1000 shirts.
Week 5.
⚫ PART 1 ⚫ Managing Processes
5-18
(1) New orders for Dragon Shirts
Order 15 200 Due week 5
Order 16 100 Due week 5
Order 17 80 Due week 6
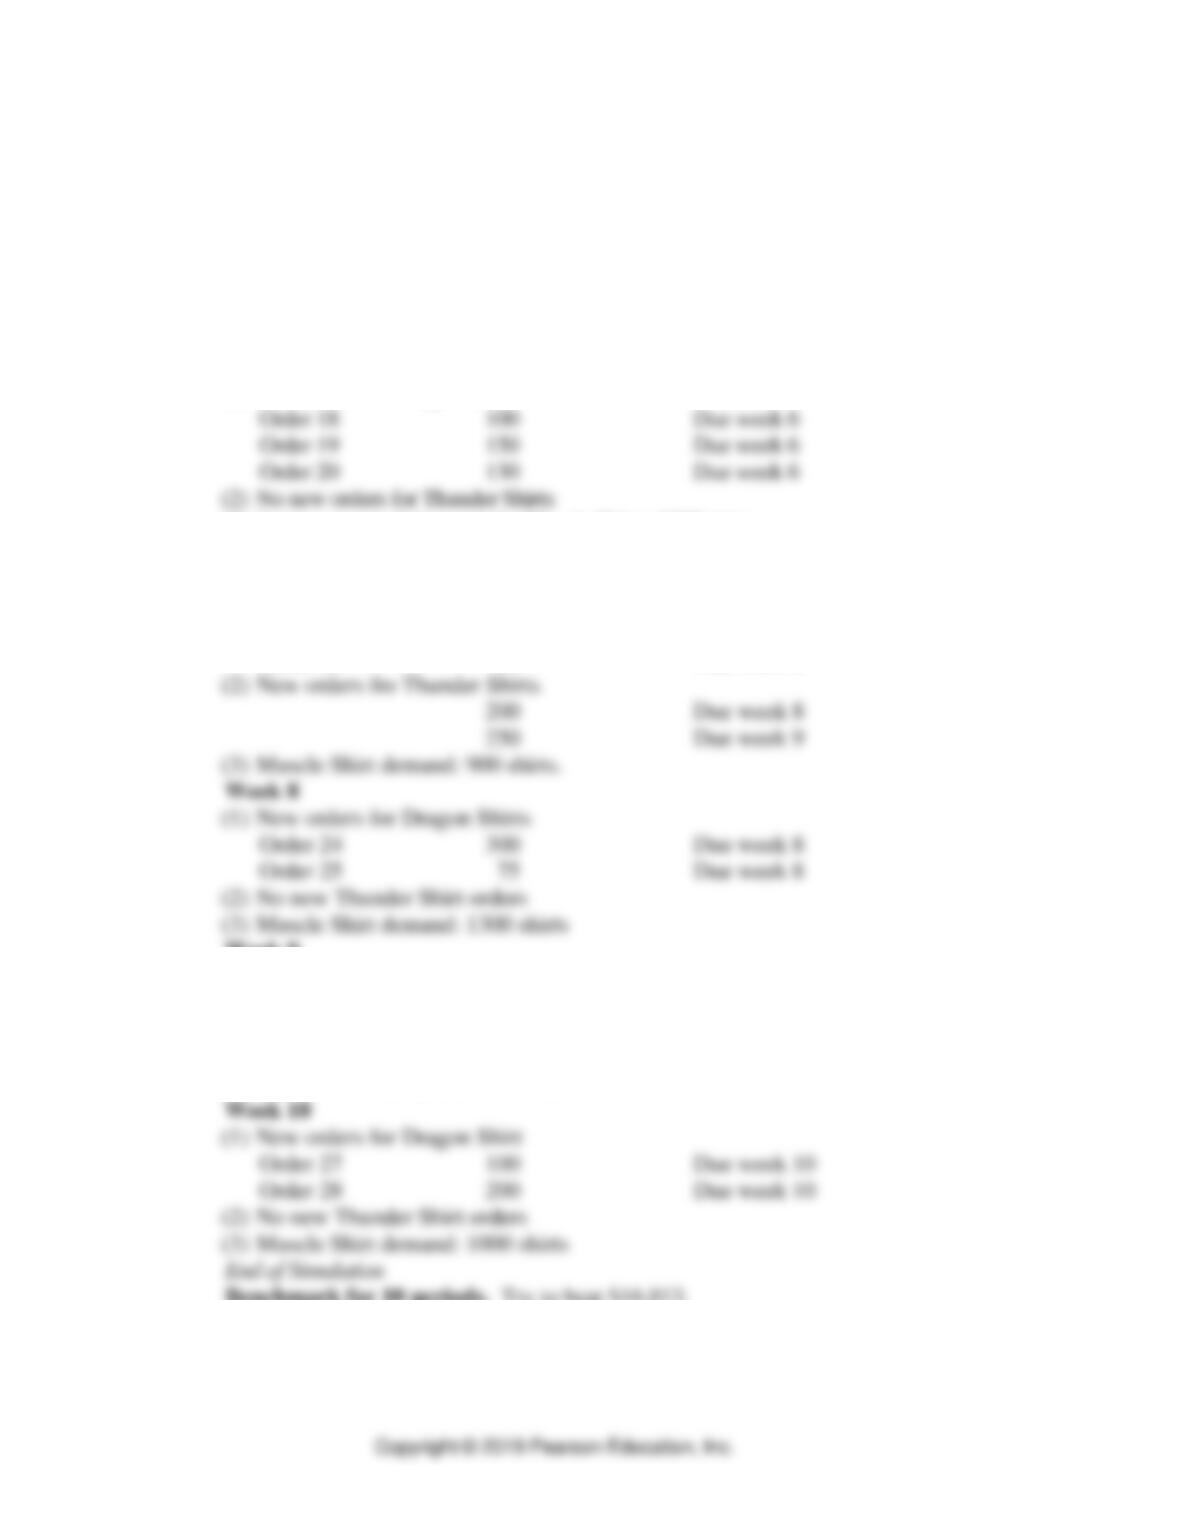
(2) New orders for Thunder Shirts
250 Due week 6
150 Due week 7
(3) Announce actual demand for Muscle Shirts: 1100 shirts.
Week 6
(1) New orders for Dragon Shirts
(3) Announce actual demands for Muscle Shirts: 1200 shirts.
Week 7
(1) New orders for Dragon Shirts
Order 21 220 Due week 7
Order 22 280 Due week 8
Order 23 60 Due week 8
Week 9
(1) New orders for Dragon Shirts
Order 26 80 Due week 9
(2) New orders for Thunder Shirts
EXPEDITE ORDER 200 Due week 10
(3) Muscle Shirt demand: 800 shirts
Benchmark for 10 periods. Try to beat $16,813.
C. Discussion and Analysis of Results
Constraint Management ⚫ CHAPTER 5
5-19
The discussion and analysis could be as brief as merely finding the team with the
greatest total contribution to profits and asking them to characterize their strategy in light
of the material in Chapter 7 or as involved as using the experience as a motivator to
learn about
the fit of manufacturing processes to market strategies. This latter use of the simulation
can be realized by introducing the concept of contribution margin and how the process
(in this case, represented by the changeover times) plays a role in identifying the most
lucrative markets for the firm. The following guidelines assume the more elaborate
discussion is preferred.
1. Find the best team, as represented by the greatest total contribution to profits. Ask
the team(s) to share their strategy for success. Record the essence of the strategy on
the board for later recall.
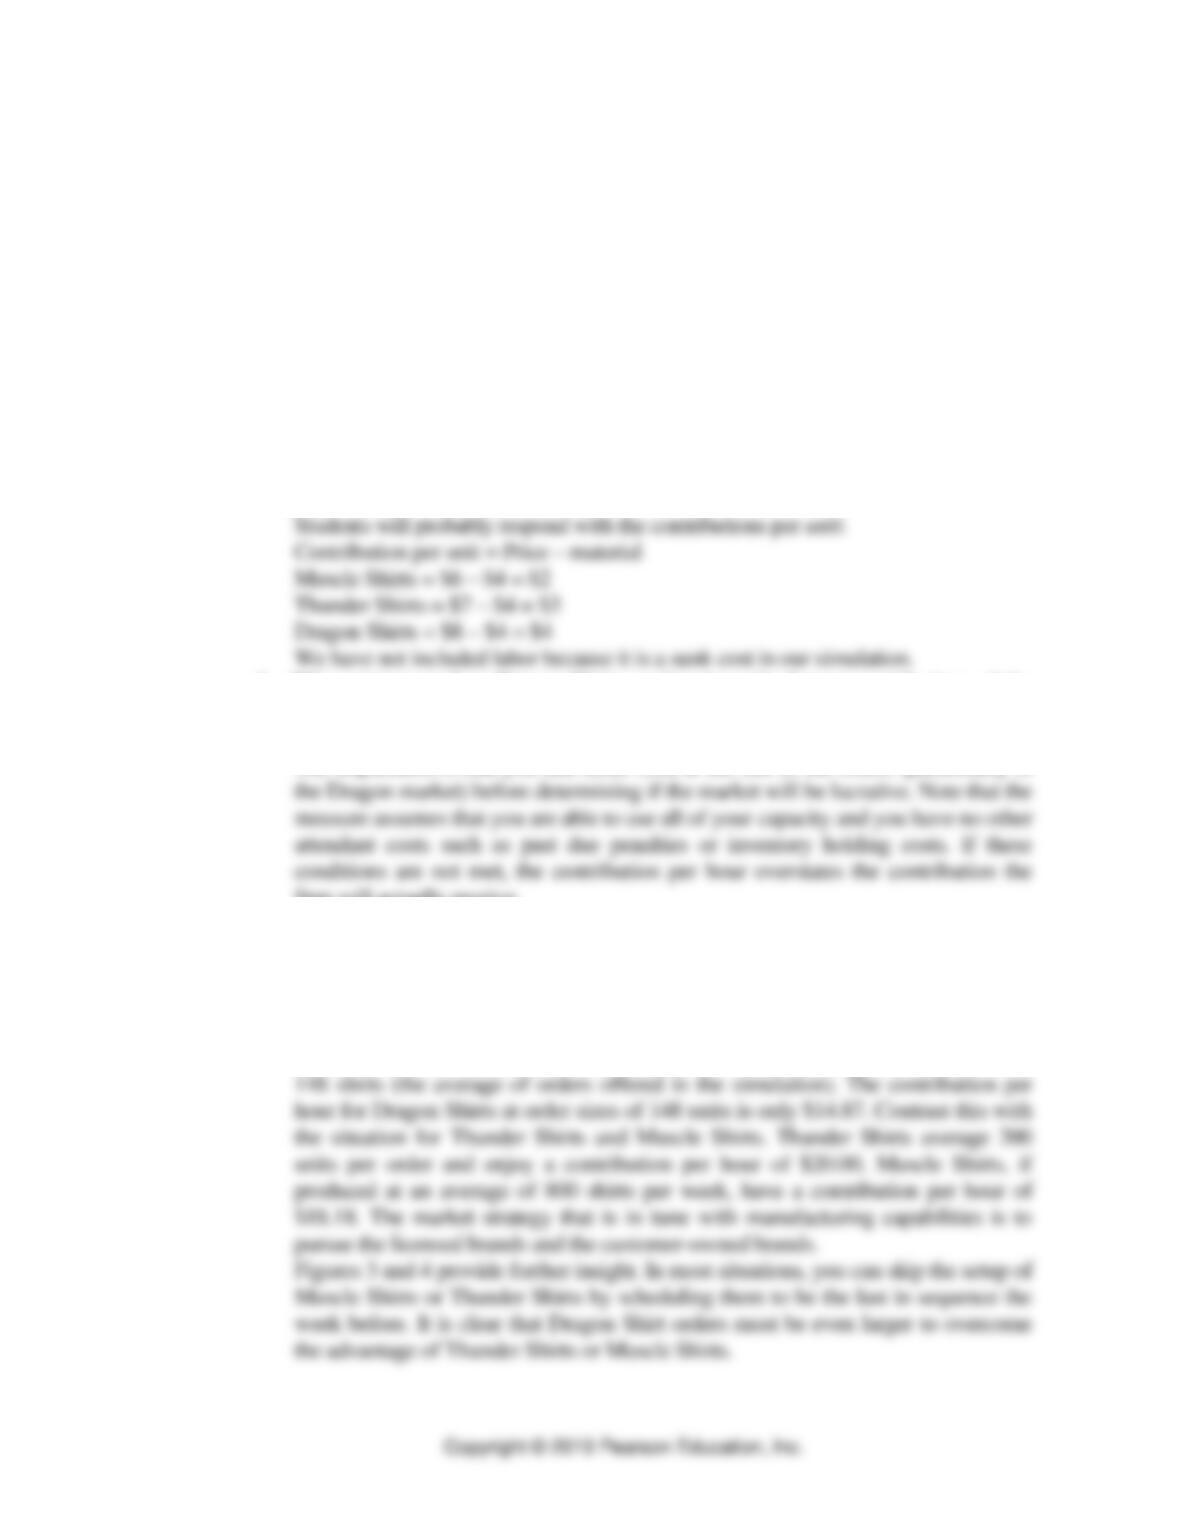
2. What are the marginal contributions to profit of the three product categories
produced by Min-Yo?
3. Why not just produce Dragon Shirts, as they have the largest contributions of the
product line? The answer is that the changeover times are large. Introduce the
concept of contribution per hour. See text Examples 7.2 and 7.3.
The implication is that you had better look at the size of the orders (particularly in
firm will actually receive.
4. What business should Min–Yo be in?
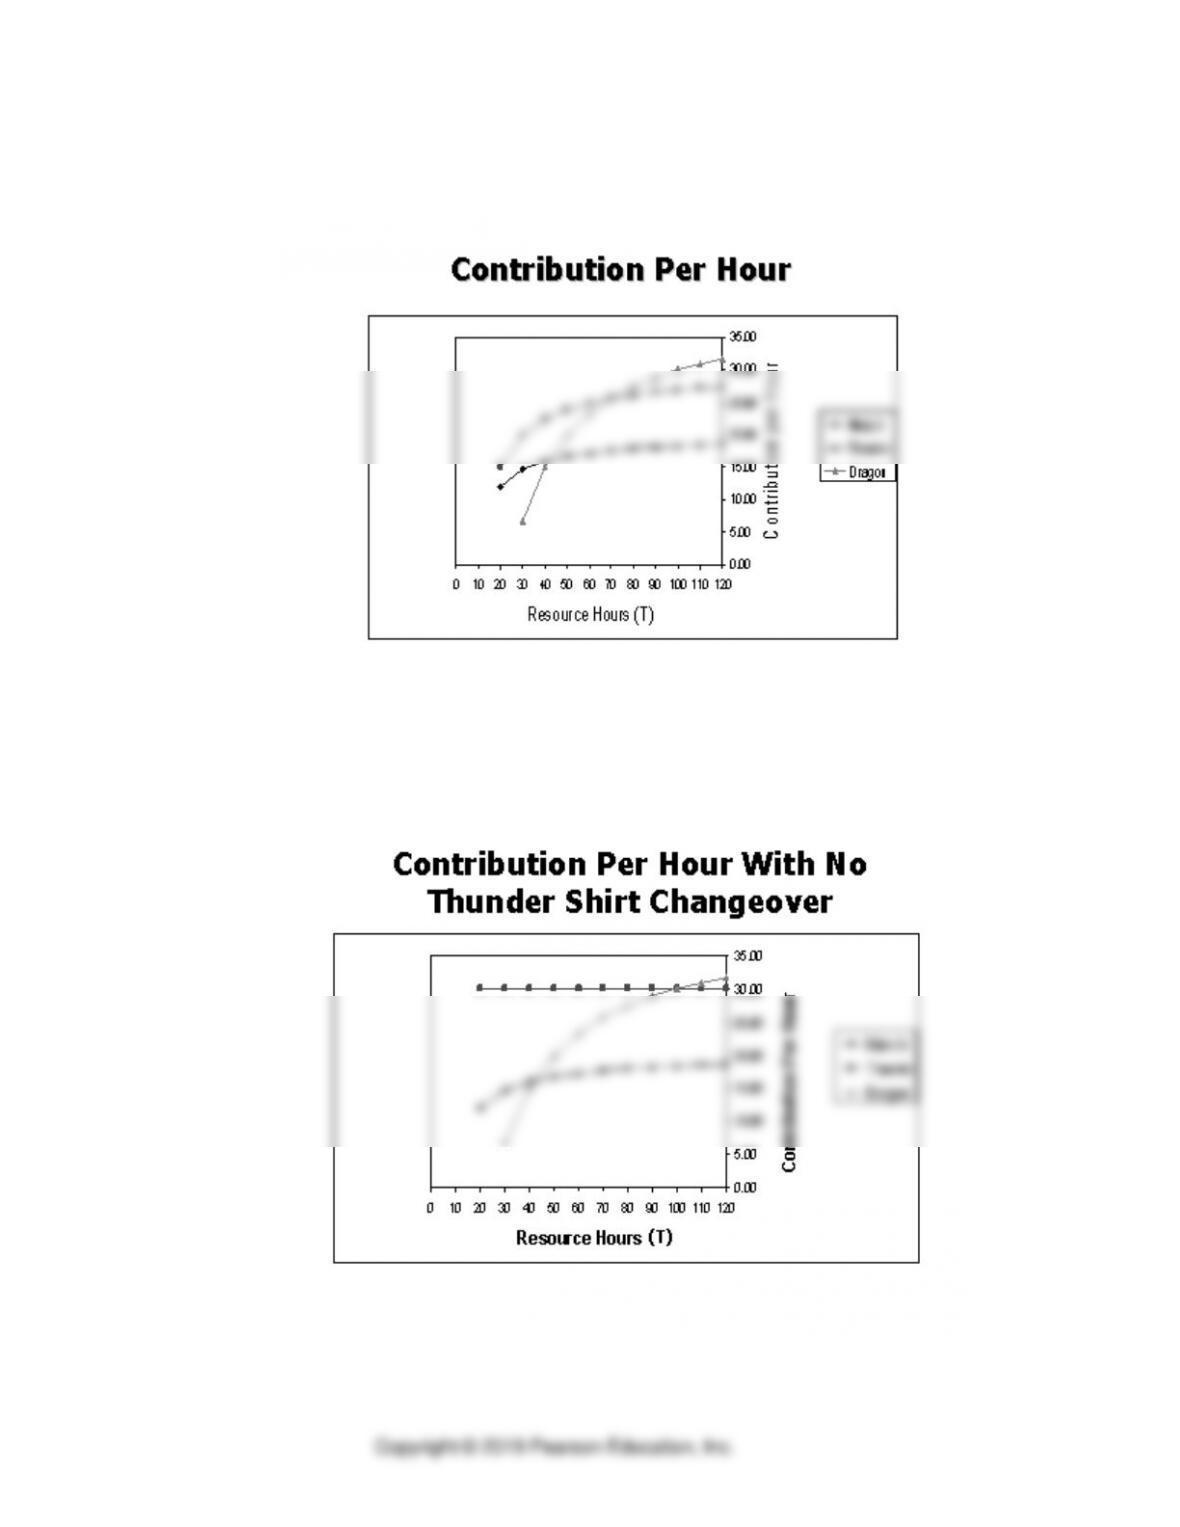
It is informative to look at Figure 2, which is a plot of the contribution per hour for
various time commitments to available order options, assuming the changeover
time for Dragon Shirts is 25 hours. It is clear that if order sizes are greater than 450
(which imply a T value of 70 hours including setup), Dragon Shirts are the most
lucrative. However, in the market for Dragon Shirts, the average order size is only
⚫ PART 1 ⚫ Managing Processes
5-20
This graphical analysis can also help to develop heuristics for selecting which
Dragon Shirt orders to accept. For example, in Figure 3, produce any Thunder
Shirts that are available for delivery. deduct the amount of time consumed. Select
any Dragon orders that can be produced in the remaining time. Use any left over
time for Muscle Shirts.
5. What improvements would you suggest for the garment maker?
Although the answer might depend on the changeover times the instructor used for
6. Points to remember:
a. Winning strategies require close collaboration between marketing and
manufacturing. Deciding which markets to serve requires an understanding of
manufacturing capabilities.
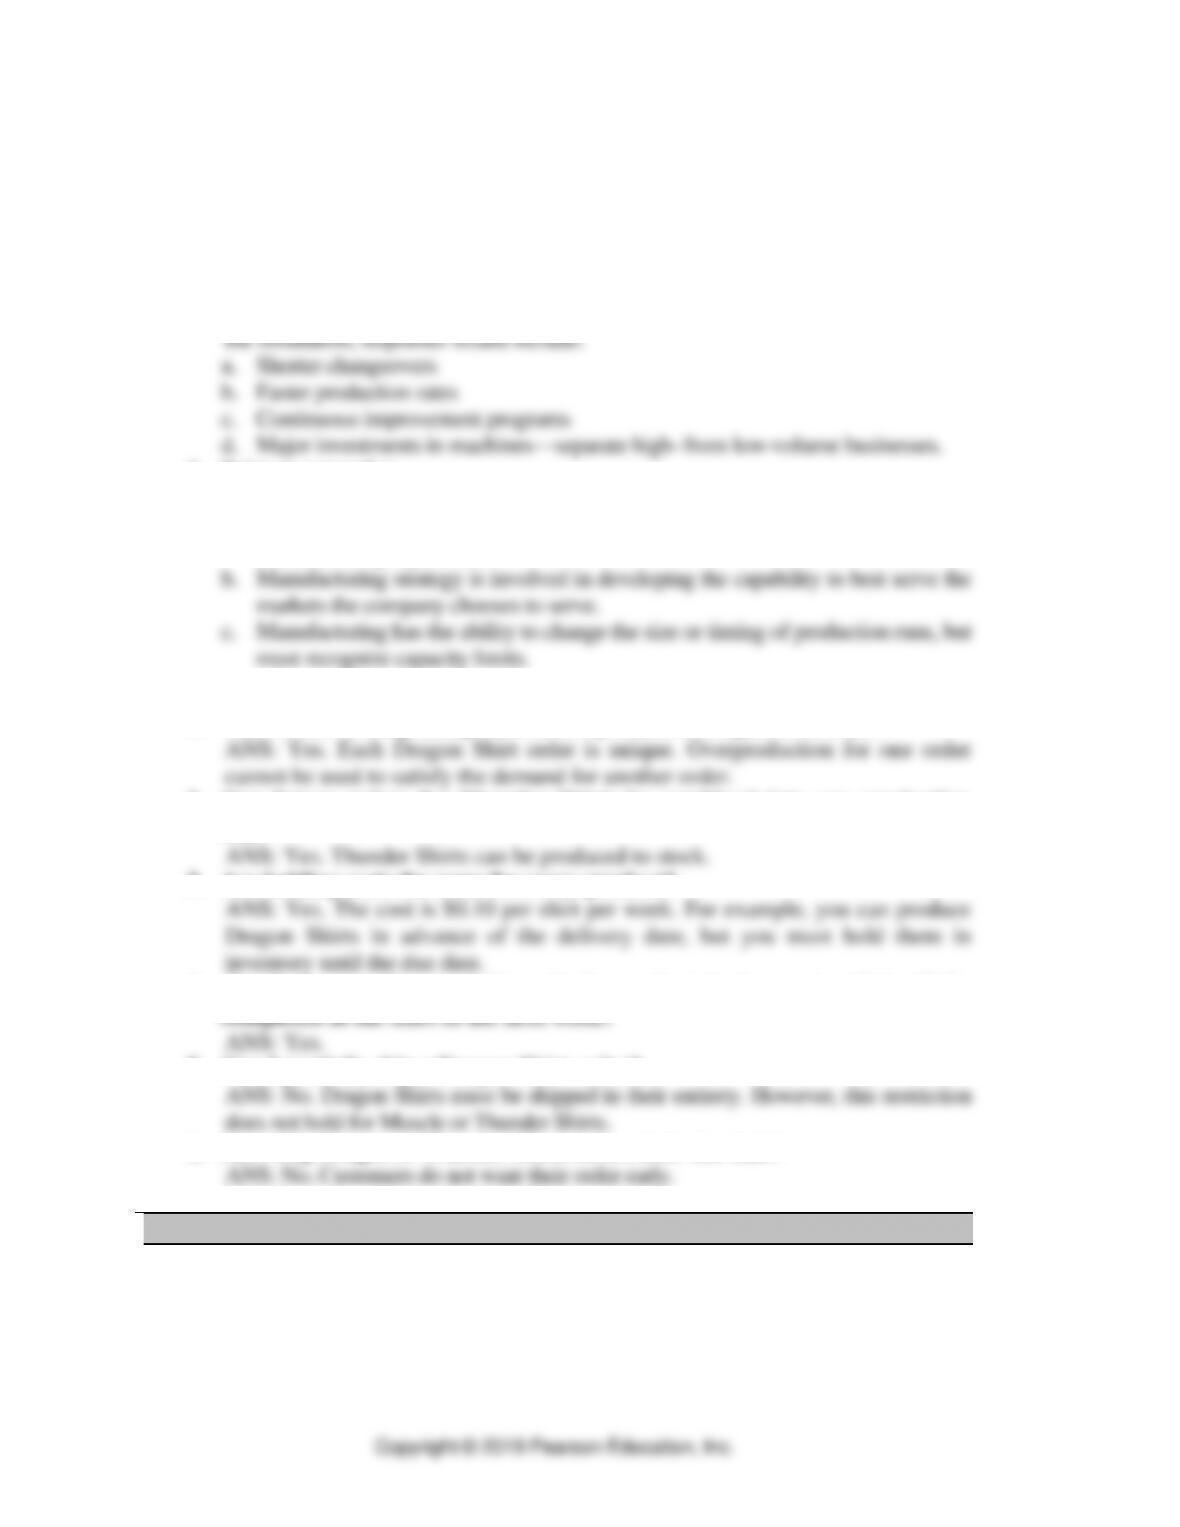
D. Frequently Asked Questions
1. Must I incur a setup charge each time I produce a Dragon Shirt order?
2. Can future orders for Thunder Shirts be combined into one production
run?
3. Are holding costs the same for every product?
4. Can I use some hours at the end of a week to begin a setup that will be
completed at the start of the next week?
5. Can I partially ship a Dragon Shirt order?
6. Can I ship Dragon or Thunder Shirts before their due date?
REPORT
1. Changeover Improvement Study
The Engineering Department reports that the efforts to reduce the changeover times of
the garment maker machine have produced the following results:
Product Changeover Time
Muscle Shirts 8 hours

Constraint Management ⚫ CHAPTER 5
5-21
Thunder Shirts 10 hours
Dragon Shirts 25 hours
The Engineering Department continues to work on reducing changeover times, but no
further improvements are expected in the near future.
2. Inventory Levels
The Materials Management Department indicates that at present there are 600 Muscle
Shirts in stock. The finished goods inventories of all other products have been depleted.
The Materials Management Department respectfully reminds the Production
Department that there is an order for 200 Thunder Shirts that is past due.
3. Notice of Termination
The Min-Yo Garment Company has been purchased by a large international textile
company and will cease all operations at the end of week 6 (or whatever week the
simulation will end). All employees will be reassigned to other duties in the firm. In the
meantime, everyone is expected to do whatever they can to maximize the contribution to
profits until then. We regret any inconvenience this may impose.
⚫ PART 1 ⚫ Managing Processes
5-22
Min-Yo Guide
MIN-YO Spreadsheet
The spreadsheet is intended to minimize the paper work necessary to conduct the Min-Yo
simulation. The simulation is interactive with an environment that is unaffected by other
teams. Your team will be making decisions each period with the goal of maximizing
your firm’s profits by the end of the simulation. The spreadsheet has four major elements:
1. Open Order File
The open order file contains your commitments for orders placed by your
Thunder shirt and Dragon shirt customers. You do not have to accept all of the
orders you have access to, however the orders you do accept must be recorded by
same file for the entire simulation.
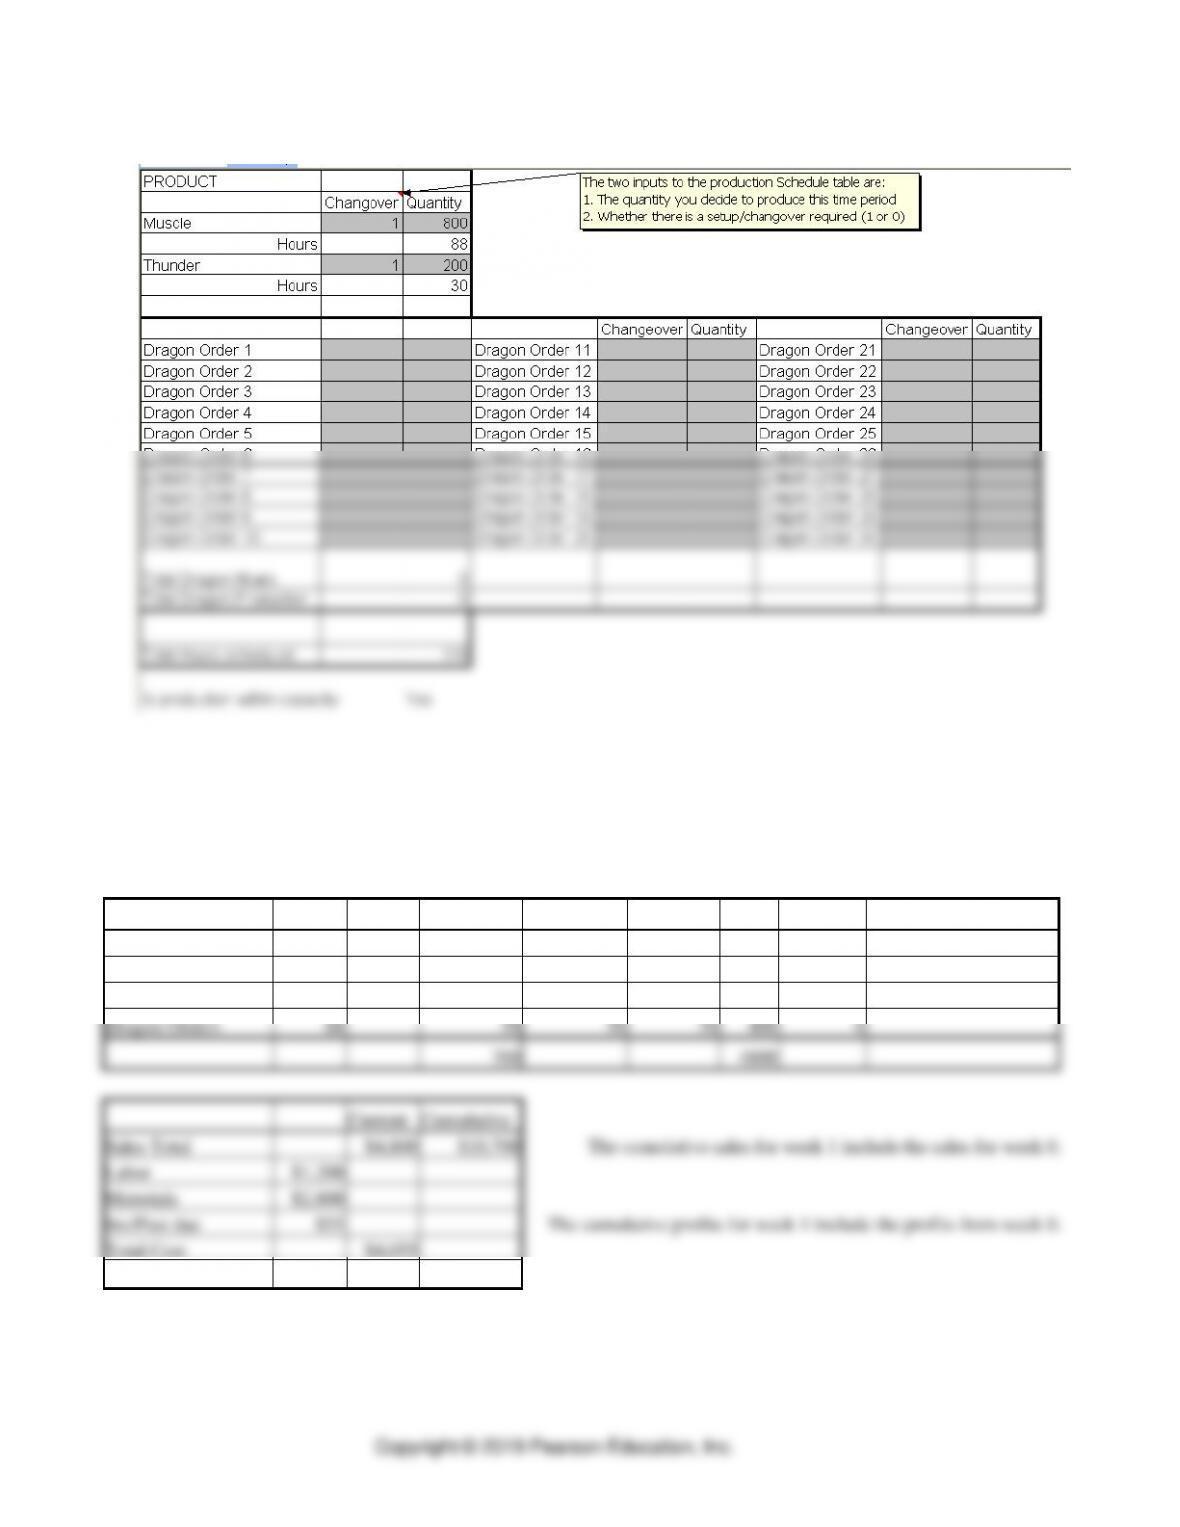
2. Production Schedule
There is a Production Schedule sheet for each week of the simulation. Enter the
production quantities for Muscle shirts, Thunder shirts, and each Dragon shirt
order you want to produce this week. For each production quantity, enter a “1’ in
the changeover column. Zero (or blank) indicates no changeover is required; a 1
indicates a changeover is required. For example, if you want to produce two
not exceeded.
3. Profit and Loss Statement (P&L)
This statement is provided for each week just below the Production Schedule. The
spreadsheet will automatically update the demand for Thunder and Dragon orders
4. Summary Sheet
Constraint Management ⚫ CHAPTER 5
5-23
The spreadsheet will automatically update the summary sheet. It shows weekly
production decisions, weekly profit contributions, and cumulative profit
contributions. One very important performance measure is cumulative profits for
the duration of the simulation.
Simulation Procedure
The simulation proceeds week-to-week until the instructor declares that it is over. Teams
should not try to guess the end of the simulation. The simulation can only proceed to the
next week if all firms are committed to their decisions for the current week. The first weeks
of the simulation typically take longer than the following weeks as you get more familiar
with the nature of the decisions you have to make. There are five steps for each week of the
simulation:
1. The instructor provides order opportunities for the week. These will be customer
orders for Thunder shirts (not every week) and Dragon shirts (each week).
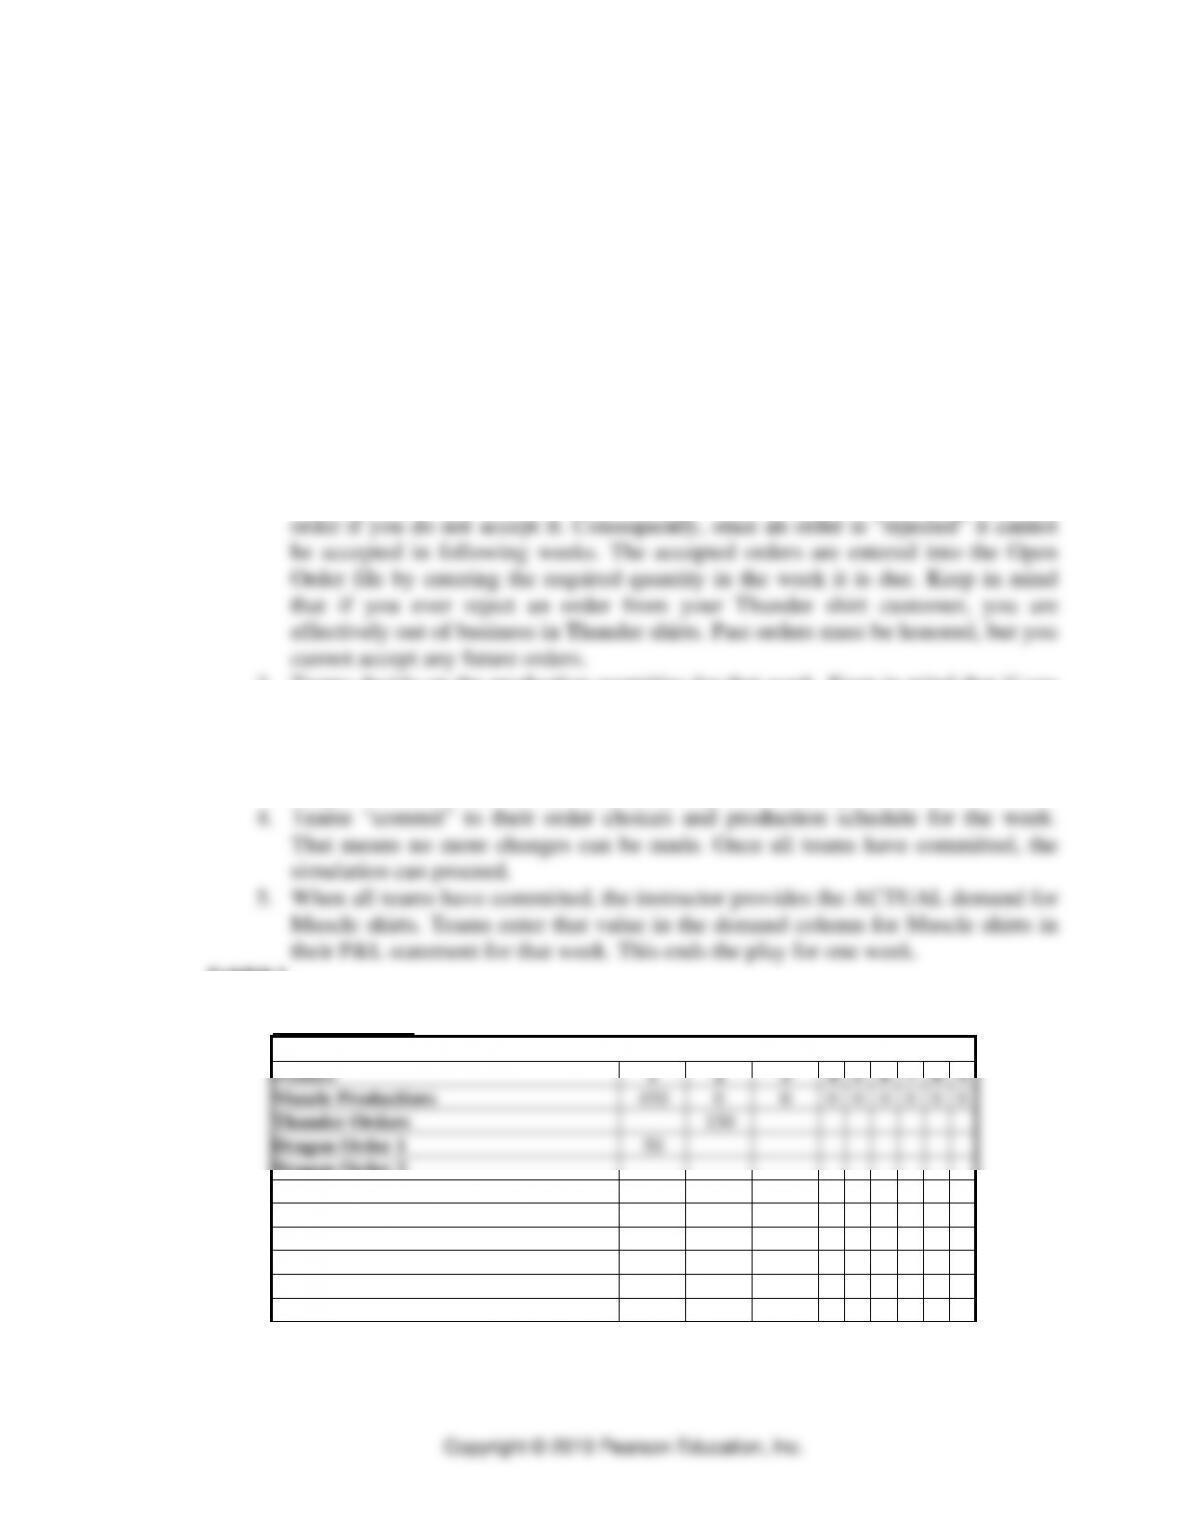
2. Teams decide which of the offered orders to accept. Customers withdraw their
3. Teams decide on the production quantities for that week. Keep in mind that if you
accepted an order for delivery in a future week, you do not have to produce it in
the current week. Or, you can produce an order in the current week for delivery in
a future week by holding it in inventory. Your Thunder shirt customer and the
Dragon shirt customers do not want early shipments of the product.
Exhibit 1
MIN-YOU GARMENT COMPANY
Open Order File (Record of commitments)
Week Order is Due
Product
1
2
3
4
5
6
7
8
9
Muscle Productions
450
0
0
0
0
0
0
0
0
Thunder Orders
150
Dragon Order 1
50
Dragon Order 2
Dragon Order 3
Dragon Order 4
100
Dragon Order 5
Dragon Order 6
Dragon Order 7
Dragon Order 8
⚫ PART 1 ⚫ Managing Processes
5-24
Exhibit 2
Exhibit 3
The input to this table is: Actual demand for the product
P&L STATEMENT
200 units of pending order for Thunder has been added to this week.
Product
Price
Beg Inv
Production
Available
Demand
Sales
End Inv
Inv/Past due costs
Muscle
$8
600
450
1050
500
3000
550
Thunder
$7
200
200
200
1400
0
Dragon Orders
$8
50
50
50
400
0
700
4800
Current
Cumulative
Sales Total
$4,800
$10,700
The cumulative sales for week 1 include the sales for week 0.
Labor
$1,200
Materials
$2,800
Inv/Past due
$55
The cumulative profits for week 1 include the profits from week 0.
Total Cost
$4,055
Profit Contribution
$745
$1,185
Constraint Management ⚫ CHAPTER 5
5-25
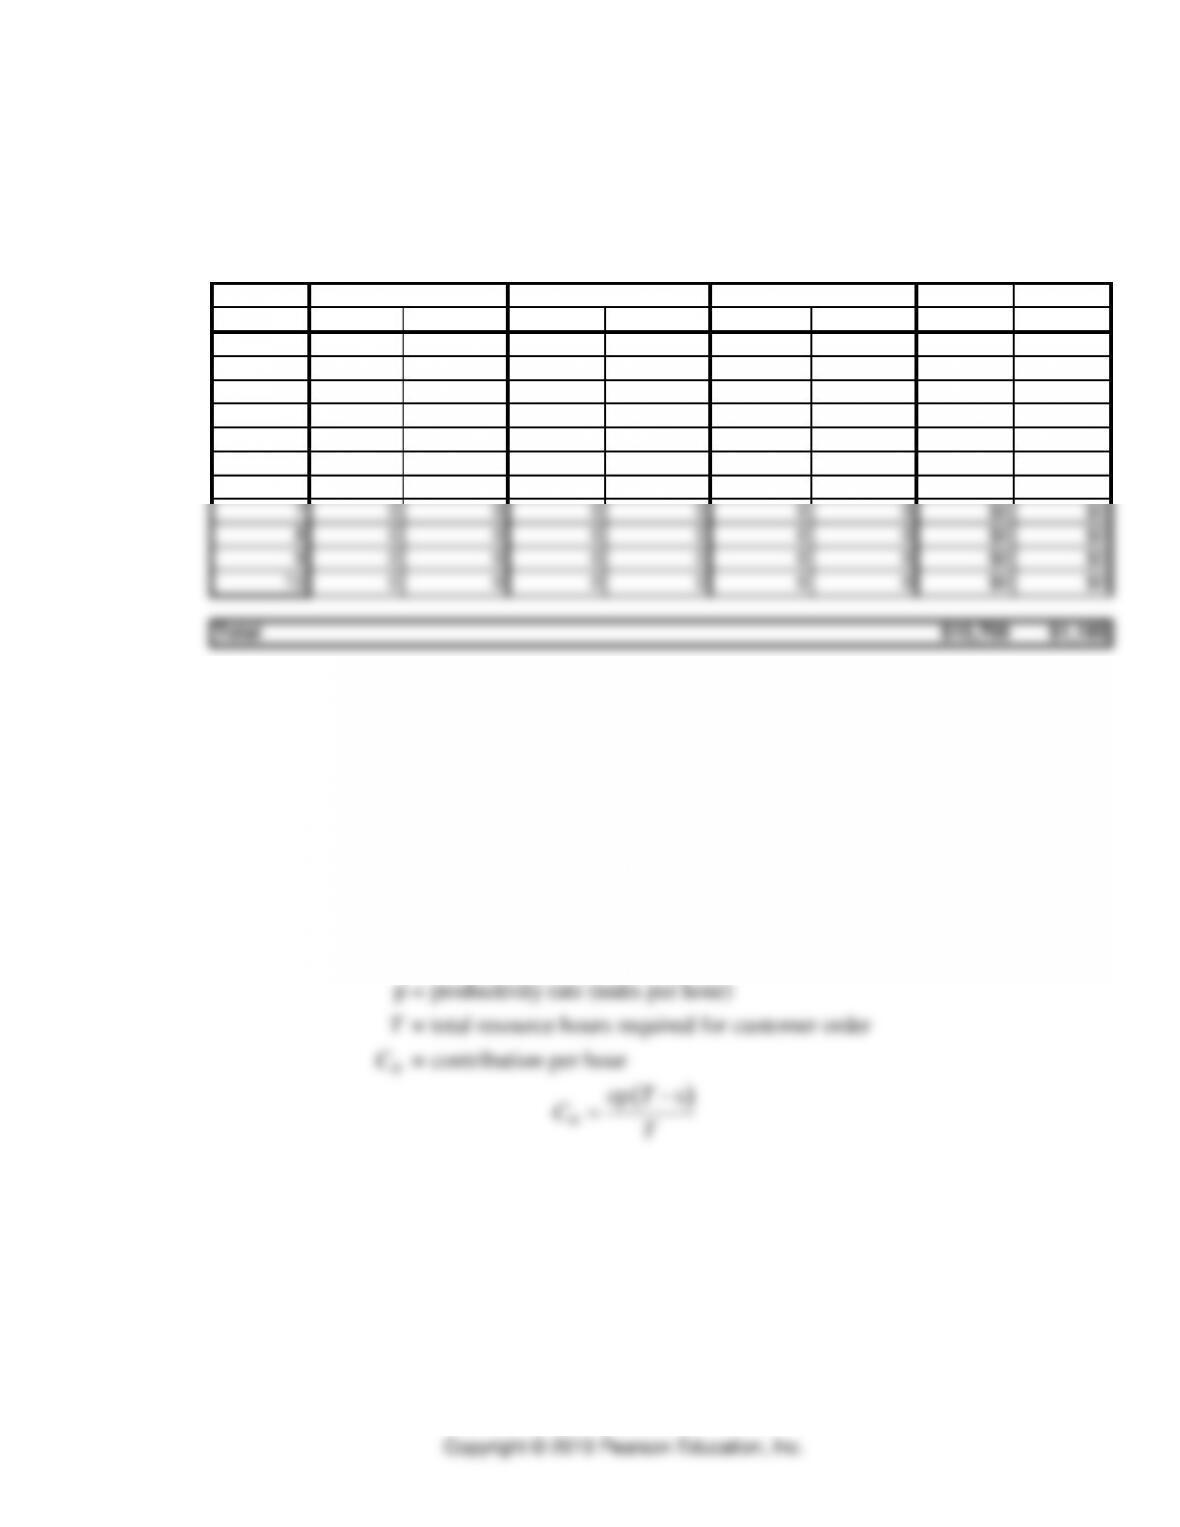
Exhibit 4
MIN-YO GARMENT COMPANY
Summary sheet
Week Hours Production Hours Production Hours Production Sales Profit
088 800 30 200 0 0 $5,900 $440
153 450 20 200 30 50 $4,800 $745
2 0 0 0 0 0 0 $0 $0
3 0 0 0 0 0 0 $0 $0
4 0 0 0 0 0 0 $0 $0
5 0 0 0 0 0 0 $0 $0
6 0 0 0 0 0 0 $0 $0
7 0 0 0 0 0 0 $0 $0
8 0 0 0 0 0 0 $0 $0
9 0 0 0 0 0 0 $0 $0
10 0 0 0 0 0 0 $0 $0
Total $10,700 $1,185
Muscle
Thunder
Dragon
Figure 1
Contribution per Hour
How Can I Tell Which Market Will
Be Most Profitable?
Contribution per hour
c = contribution to profits and overhead per unit
s = changeover time (hrs.)
p = productivity rate (units per hour)
= total resource hours required for customer order
= contribution per hour
H
T
C
( )
cp s
H
T
CT
−
=
⚫ PART 1 ⚫ Managing Processes
5-26
Figure 2
Contribution per Hour – All Changeovers Required
Figure 3
Contribution per Hour – No Thunder Shirt Changeover Required
Constraint Management ⚫ CHAPTER 5
5-27
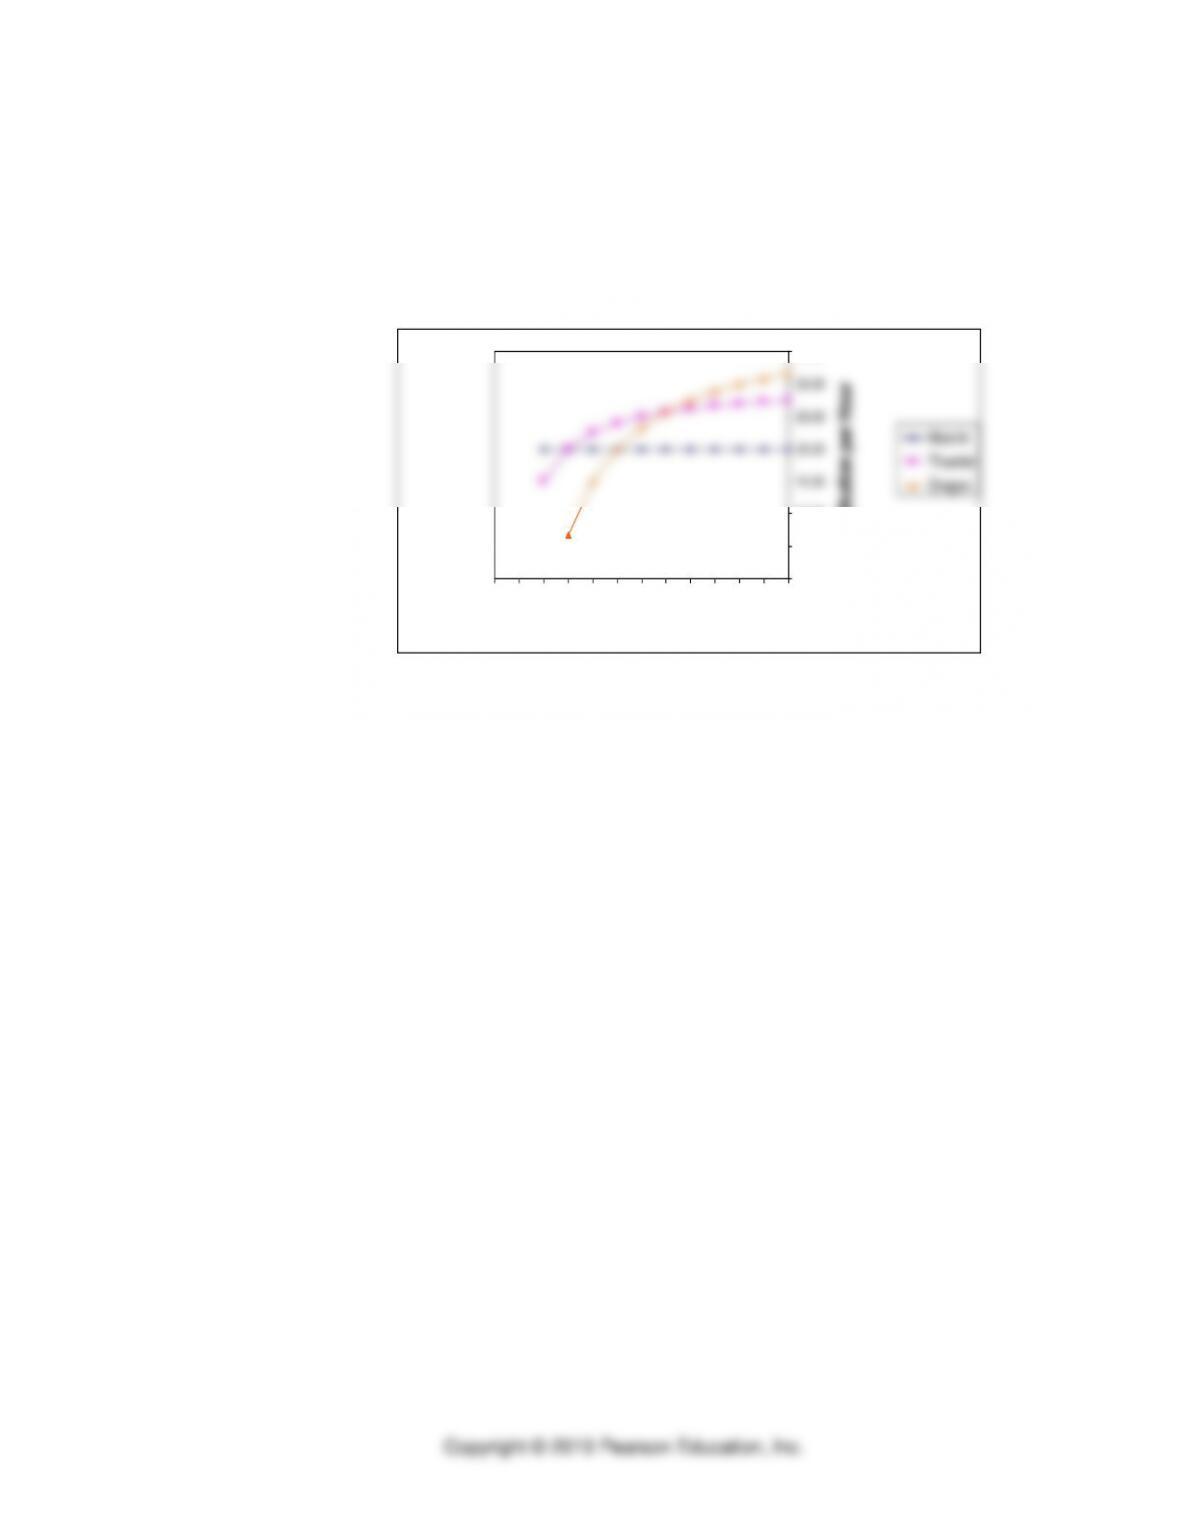
Figure 4
Contribution per Hour – No Muscle Shirt Changeover Required
0.00
5.00
10.00
15.00
20.00
25.00
30.00
35.00
010 20 30 40 50 60 70 80 90 100 110 120
Resource Hours
Muscle
Thunder
Dragon
(T)
Contribution Per Hour With No
Muscle Shirt Changeover
Contribution per Hour