Chapter
5
Constraint Management
DISCUSSION QUESTIONS
1. Examples of everyday bottlenecks include traffic lights, drive-thru windows at the
bank or fast food restaurants. On the highway merging lanes and speed zones.
2. A change in demand can easily shift bottlenecks. For instance, fast food restaurants
can provide promotional pricing on certain types of sandwiches or fries, which
3. There are many ways that process efficiency may be improved further. In the case
of our banking example, a manager might: (1) reduce processing time by providing
forms to be filled out by the customer before the customer reaches the teller
window, (2) reduce processing variability by restricting each customer to three
PROBLEMS
Managing Bottlenecks in Service Processes
1. Bill’s Barbershop
a. 10 + 8 + (15+10)/2 + 9 = 39.5 minutes
⚫ PART 1 ⚫ Managing Processes
5-2
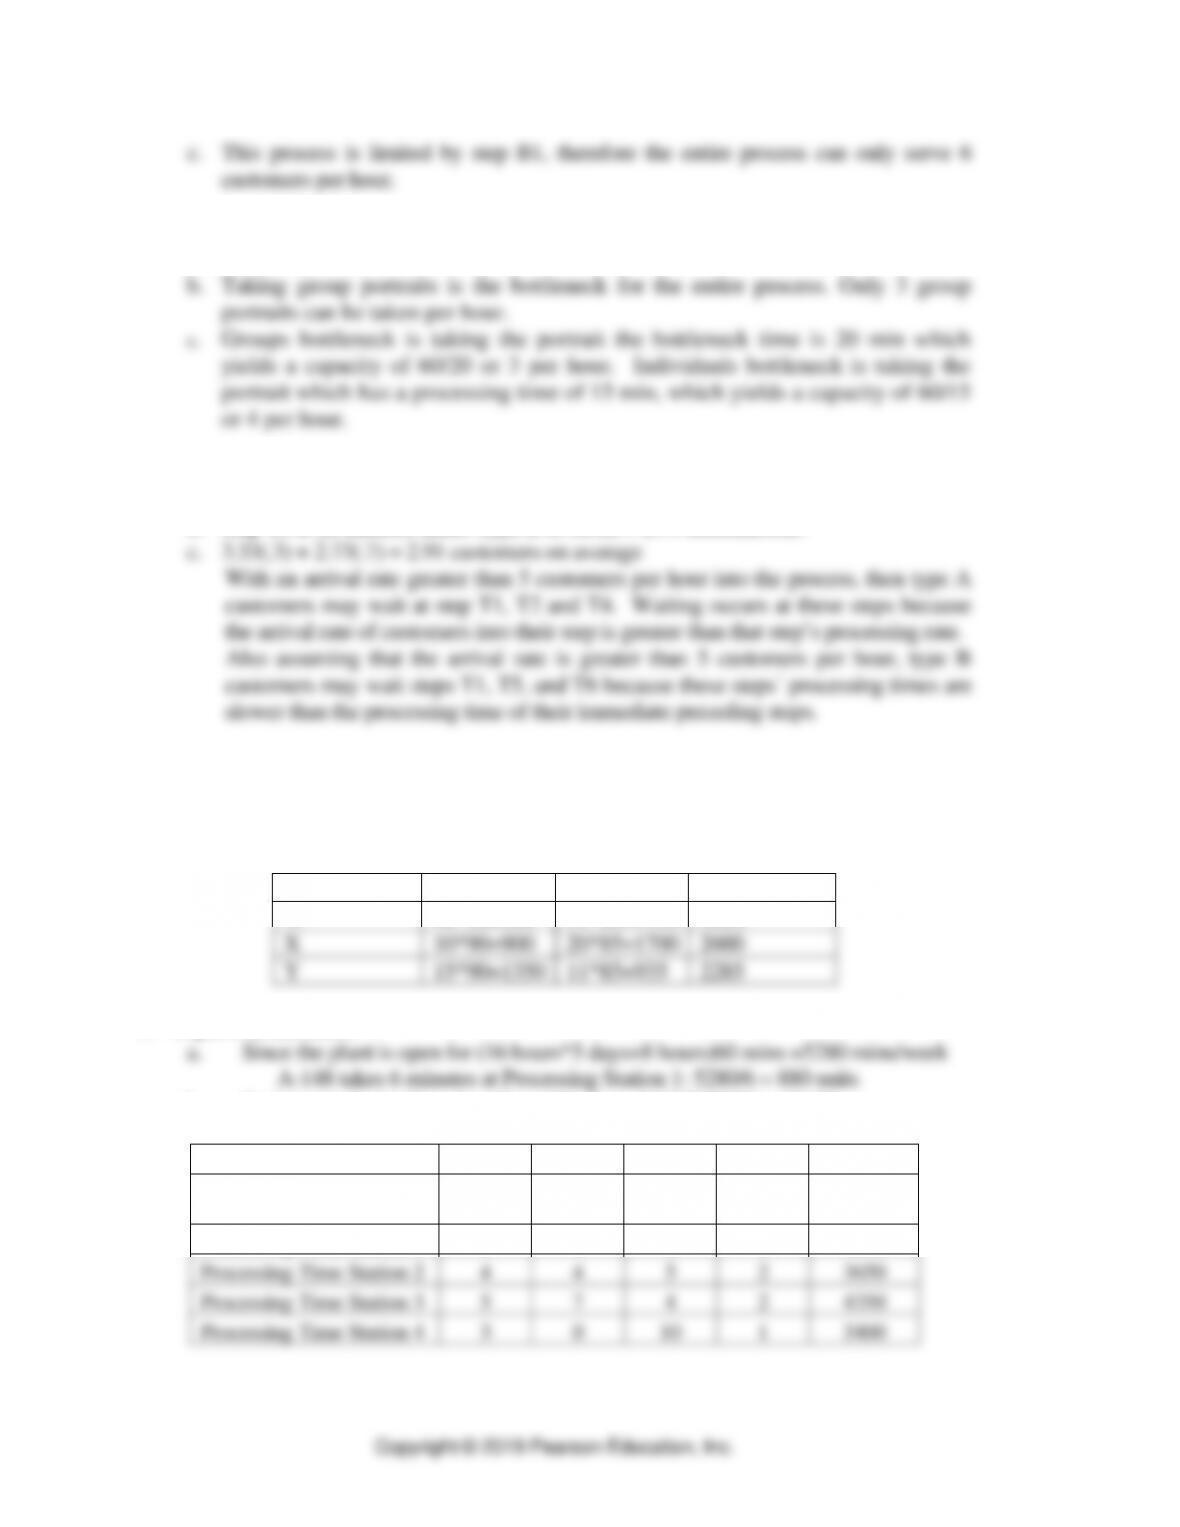
c. This process is limited by step B1, therefore the entire process can only serve 6
customers per hour.
2. Melissa’s Photo Studio
a. 5 + (5+7)2 + 20 + 7 = 38 min
3. Barbara’s Boutique
a. 3 [the bottleneck is step T4 at 18 minutes – 3.33 customers per hour or 3]
b. Step T6 at 22 minutes limits Type B to 60/22 = 2.73 customers/hr.
Managing Bottlenecks in Manufacturing Processes
4. CKC
Station X is the bottleneck – 2600 minutes
Work Station
Product A
Product B
Total Load
W
10*90=900
14*85=1190
2090
X
10*90=900
20*85=1700
2600
Y
15*90=1350
11*85=935
2285
5. Super Fun Industries
b. Station 1 is the bottleneck with a utilization of (4850/5280) = 91.9%.
A-148
B-356
B-457
C-843
Weekly Demand
200
250
250
300
Total
Load
Processing Time Station 1
6
5
0
8
4850
Processing Time Station 2
4
4
5
2
3650
Processing Time Station 3
5
7
4
2
4350
Processing Time Station 4
3
0
10
1
3400
Constraint Management ⚫ CHAPTER 5
5-3
6. Super Fun Industries continued
Station 3 is the new bottleneck with a utilization of (4500/5280) = 85.2%.
A-148
B-356
B-457
C-843
Weekly Demand
100
400
250
100
Total
Load
Processing Time Station 1
6
5
0
8
3400
Processing Time Station 2
4
4
5
2
3450
Processing Time Station 3
5
7
4
2
4500
Processing Time Station 4
3
0
10
1
2900
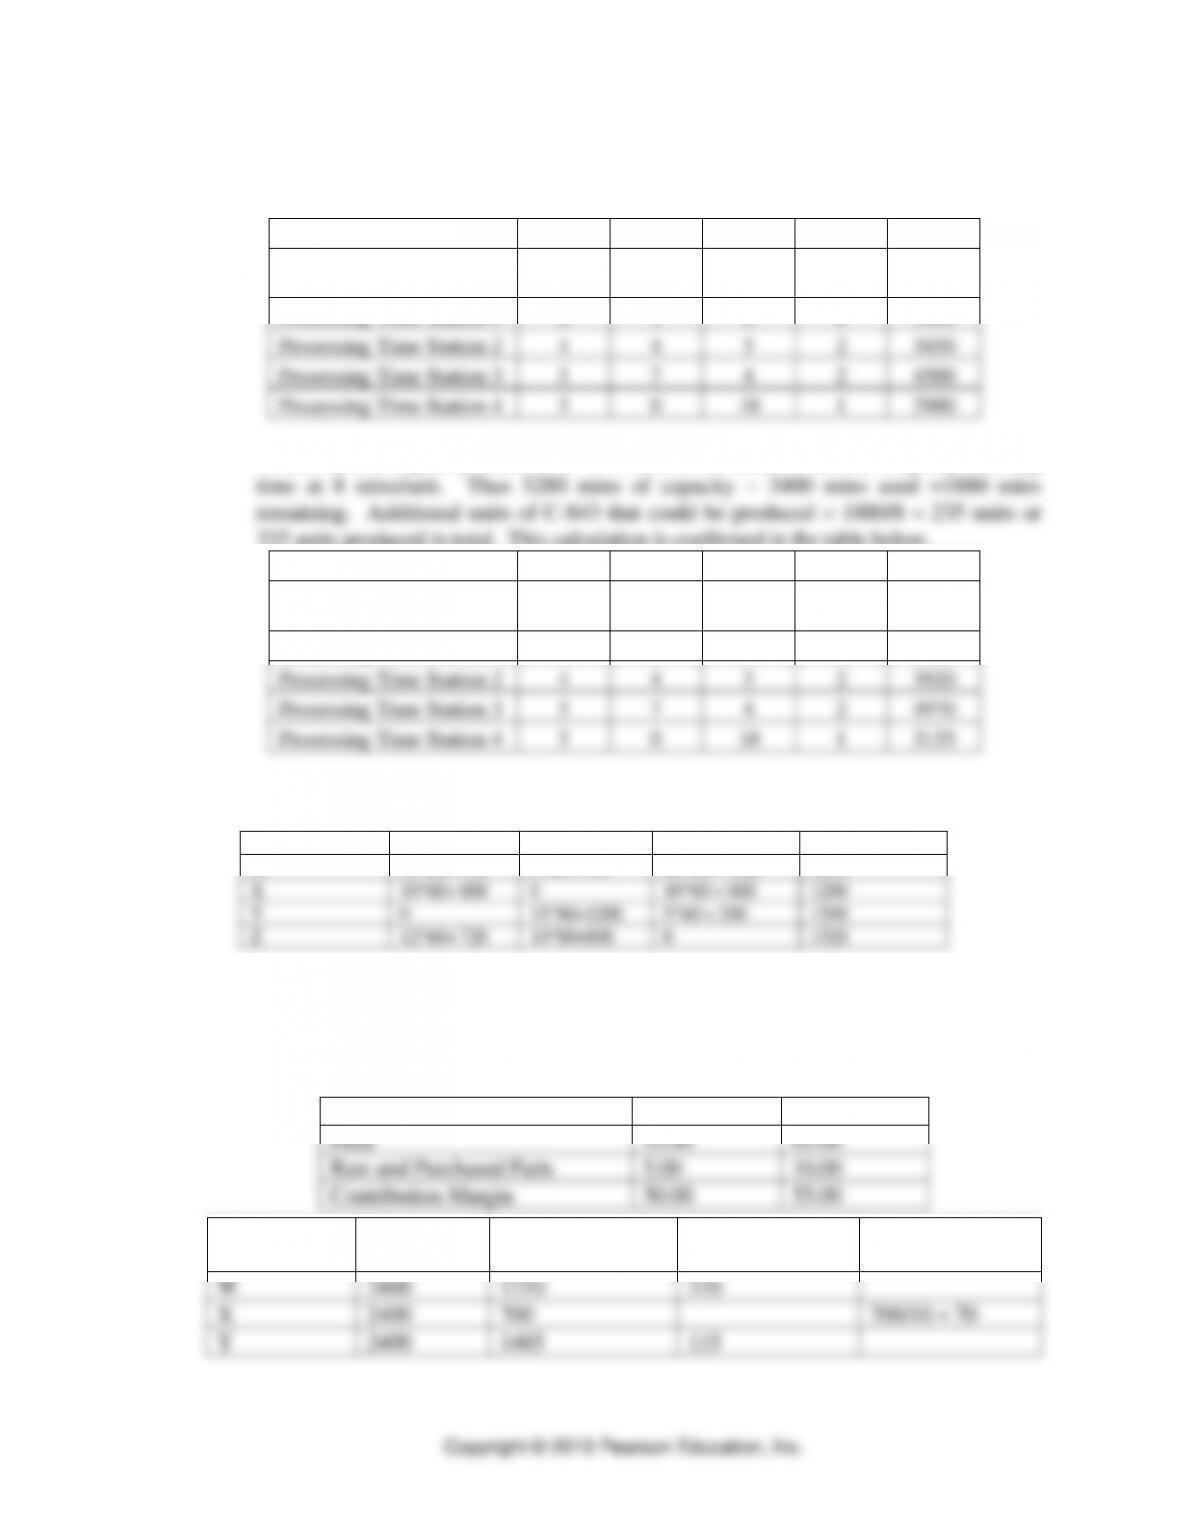
While maximizing the production of C-843, note that station 1 has the longest processing
335 units produced in total. This calculation is confirmed in the table below.
A-148
B-356
B-457
C-843
Weekly Demand
100
400
250
335
Total
Load
Processing Time Station 1
6
5
0
8
5280
Processing Time Station 2
4
4
5
2
3920
Processing Time Station 3
5
7
4
2
4970
Processing Time Station 4
3
0
10
1
3135
7. YPI Bottleneck
Station W is the bottleneck
Work Station
A
B
C
Total Load
W
12*60= 720
9*80= 720
20*60= 1200
2640
X
10*60= 600
0
10*60 = 600
1200
Y
0
15*80=1200
5*60 = 300
1500
Z
12*60= 720
10*80=800
0
1520
Applying the Theory of Constraints to Product Mix Decisions
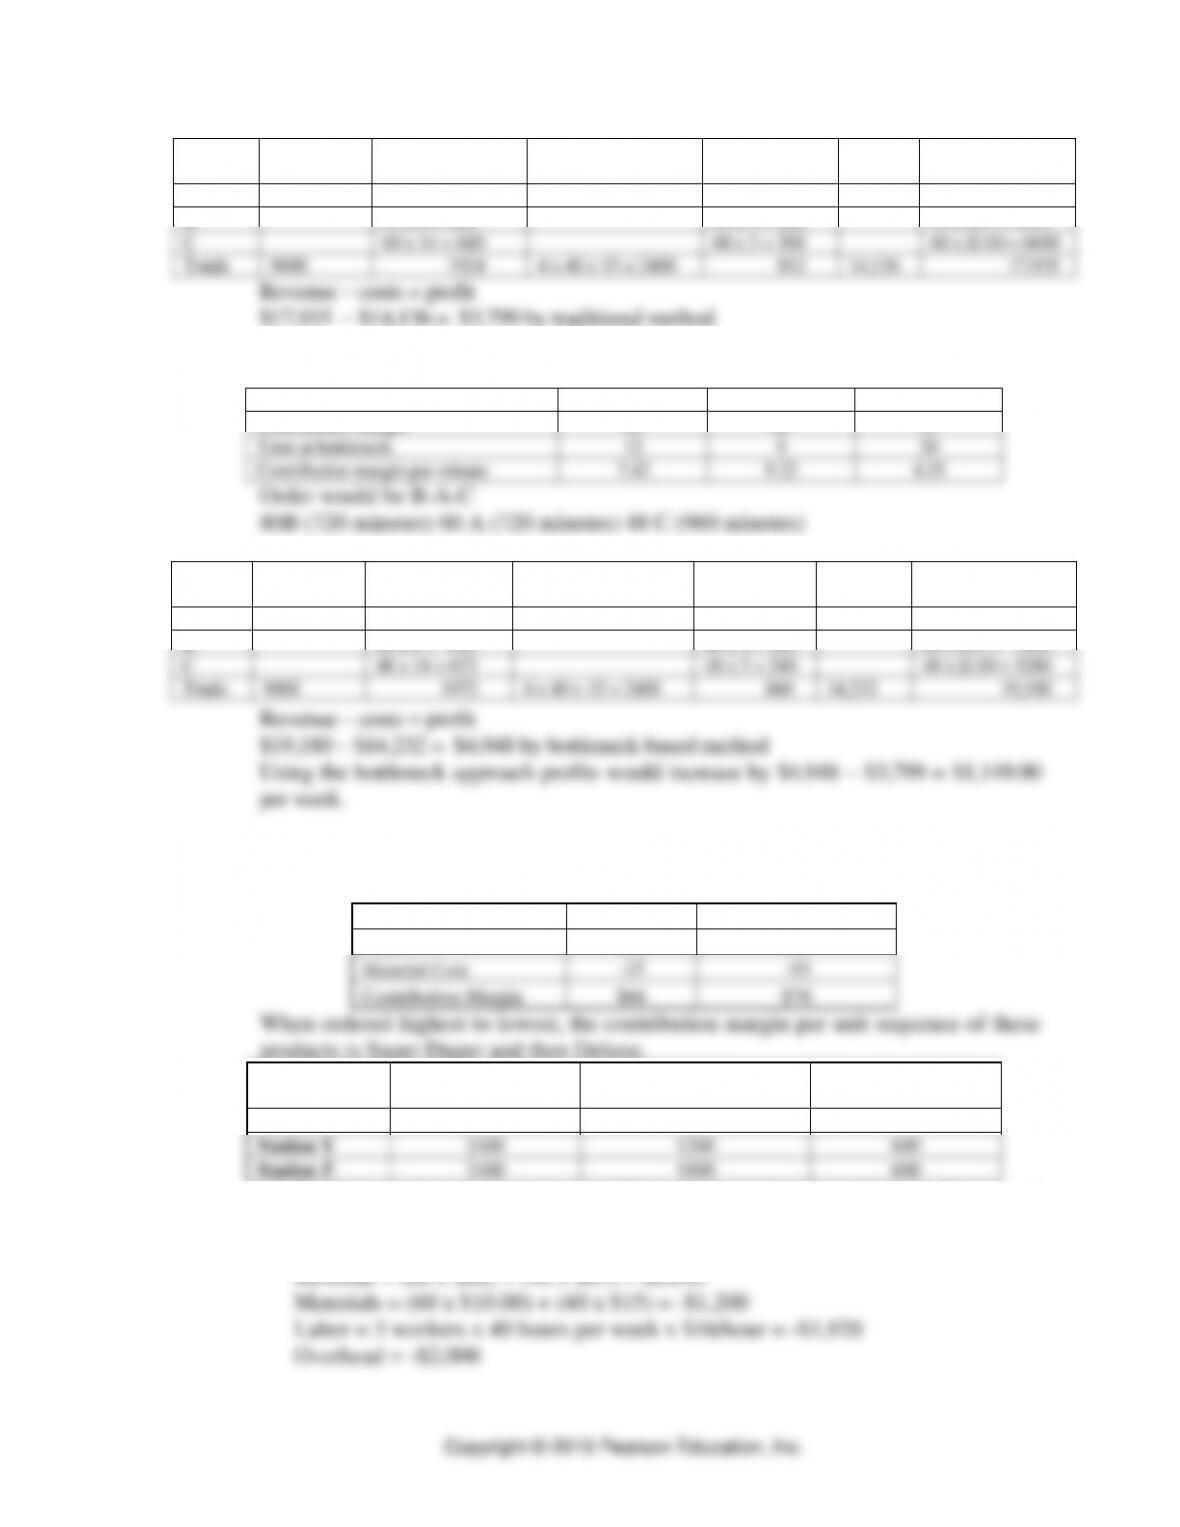
8. CKC
a. Traditional Method: Product B has the higher contribution margin/unit
Product A
Product B
Price
55.00
65.00
Raw and Purchased Parts
5.00
10.00
Contribution Margin
50.00
55.00
Work Station
Minutes at
Start
Mins. Left after
Making 85 Bs
Mins. Left after
Making 90 As
Can Only Make
70 As
W
2400
1210
310
X
2400
700
700/10 = 70
Y
2400
1465
115
⚫ PART 1 ⚫ Managing Processes
5-4
85 units of B and 70 units of A (Product B will use 1700 minutes at station X
leaving 700 for Product A.
Product
Overhead
Raw Mat’l
Labor
Purchase
Parts
Total
Costs
Revenues
A
70 x 2 =140
70 x 3 = 210
70 x $55 = 3850
B
85 x 5 = 425
85 x 5 = 425
85 x $65 = 5525
Totals
3500
565
3 x $6 x
40 hrs =
720
635
5420
9375
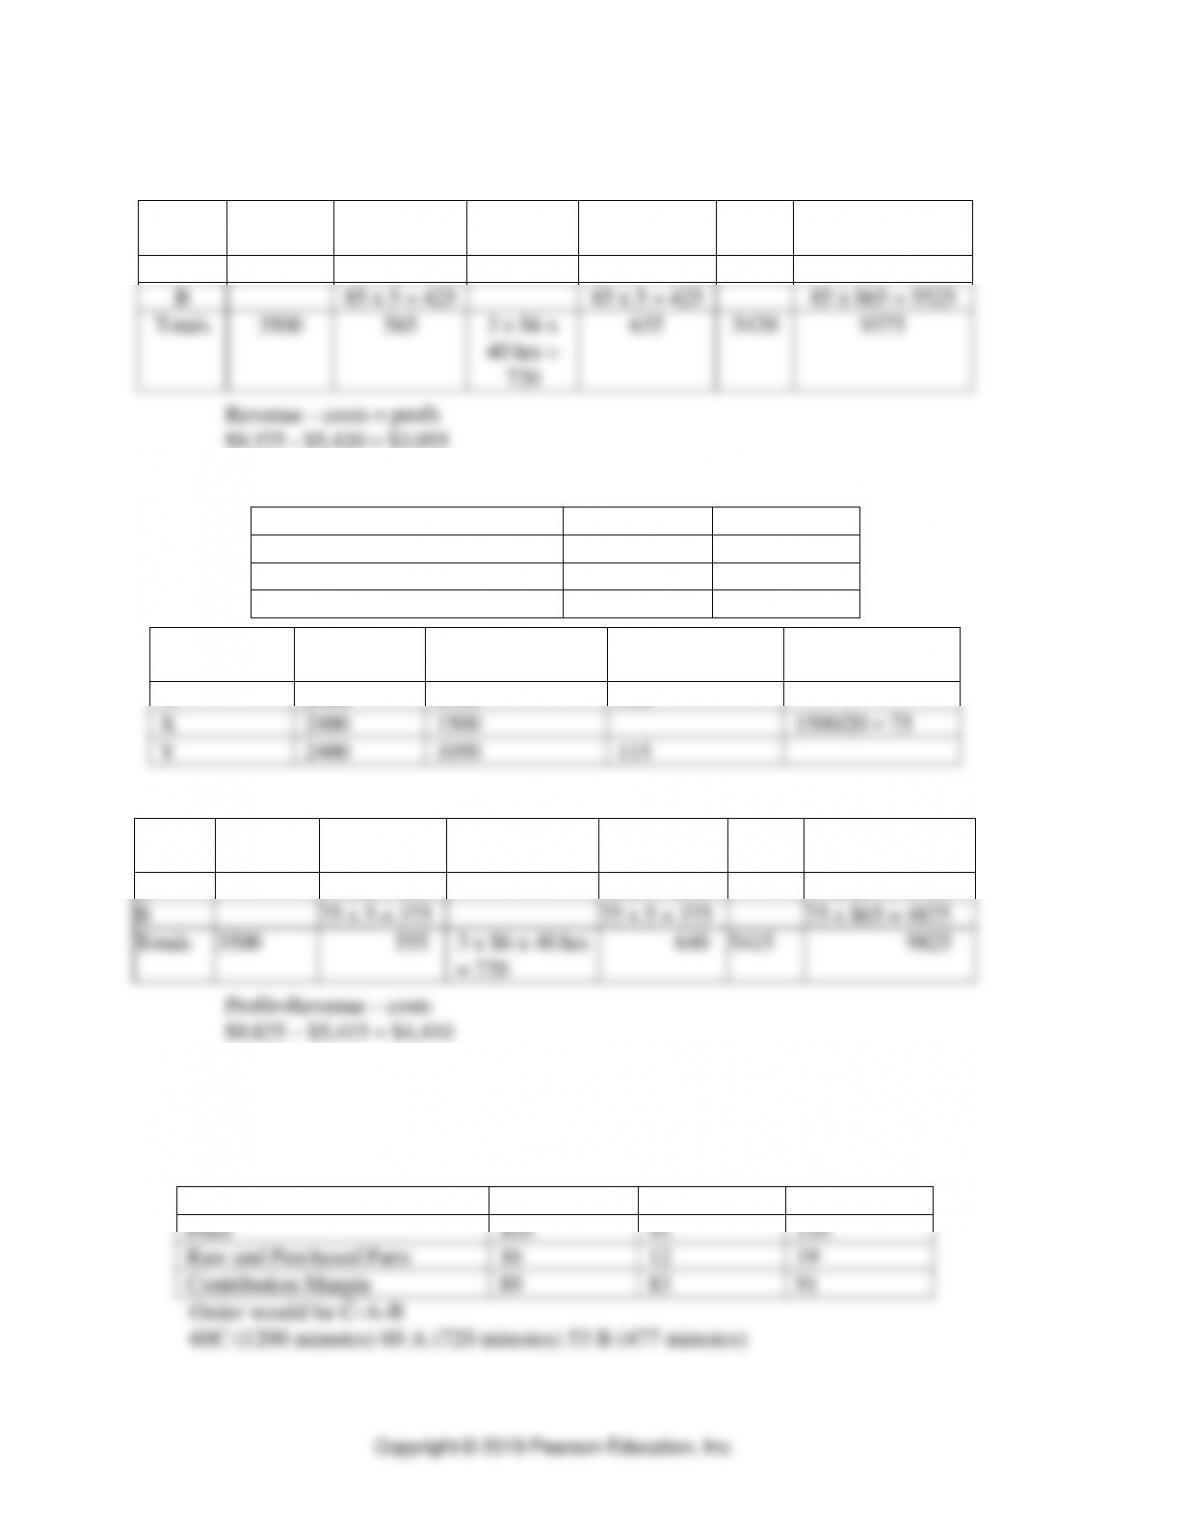
Revenue – costs = profit
$9,375 – $5,420 = $3,955
b. Bottleneck-based approach: Product A has the higher contribution margin/unit at the
bottleneck
Product A
Product B
Margin
50.00
55.00
Time at bottleneck
10 min
20 min
Contribution margin per minute
5.00
2.75
Work Station
Minutes at
Start
Mins. Left after
Making 90 As
Mins. Left after
Making 85 Bs
Can Only Make
75 Bs
W
2400
1500
310
X
2400
1500
1500/20 = 75
Y
2400
1050
115
Make 90 units of A (900 minutes used – leaves 1500 minutes) can make 75 units of B
Product
Overhead
Raw Mat’l
Labor
Purchase
Parts
Total
Costs
Revenues
A
90 x 2 = 180
90 x 3 = 270
90 x $55 = 4950
B
75 x 5 = 375
75 x 5 = 375
75 x $65 = 4875
Totals
3500
555
3 x $6 x 40 hrs
= 720
640
5415
9825
Profit=Revenue – costs
$9,825 – $5,415 = $4,410
c. $4,410– $3,955 = $455 increase using TOC, which is a 12% increase
9. YPI profits by traditional method:
A
B
C
Price
105
95
110
Raw and Purchased Parts
16
12
19
Contribution Margin
89
83
91
Constraint Management ⚫ CHAPTER 5
5-5
Product
Overhead
Raw Mat’l
Labor
Purchase Parts
Total
Costs
Revenues
A
60 x 11 = 660
60 x 5 = 300
60 x $105 = 6300
B
53 x 8 = 424
53 x 4 = 212
53 x $95 = 5035
C
60 x 14 = 840
60 x 5 = 300
60 x $110 = 6600
Totals
9000
1924
4 x 40 x 15 = 2400
812
14,136
17,935
3
Bottleneck-based approach
A
B
C
Contribution Margin
89
83
91
Time at bottleneck
12
9
20
Contribution margin per minute
7.42
9.22
4.55
Order would be B-A-C
80B (720 minutes) 60 A (720 minutes) 48 C (960 minutes)
Product
Overhead
Raw Mat’l
Labor
Purchase
Parts
Total
Costs
Revenues
A
60 x 11 = 660
60 x 5 = 300
60 x $105 = 6300
B
80 x 8 = 640
80 x 4 = 320
80 x $95 = 7600
C
48 x 14 = 672
48 x 5 = 240
48 x $110 = 5280
Totals
9000
1972
4 x 40 x 15 = 2400
860
14,232
19,180
10. A.J.’s Bird Feeders
a. Traditional Method
Deluxe
Super Duper
Price
$81
$80
Material Cost
–15
–10
Contribution Margin
$66
$70
When ordered highest to lowest, the contribution margin per unit sequence of these
products is Super Duper and then Deluxe.
Work Center
Minutes at the Start
Minutes Left after
Making 60 Super Duper
Can only make 40
Deluxe
Station X
2400
600
0
Station Y
2400
1200
600
Station Z
2400
1800
600
The best product mix using the traditional approach is then 60 Super Duper and
40 Deluxe.
Profit
⚫ PART 1 ⚫ Managing Processes
5-6
Profit = $8,040 – $1,200 – $1,920 – $2,000 = $2,920 per week
b. Bottleneck-based Method
Deluxe
Super Duper
Contribution Margin
$66
$70
Time at Bottleneck
15
30
Contribution margin per minute
$4.40
$2.33
Based on the bottleneck method the manufacturing sequence should be Deluxe
then Super Duper
Work Center
Minutes at
the Start
Minutes Left after
Making 50 Deluxe
Can only make 55
Super Duper
Station X
2400
1650
0
Station Y
2400
1650
550
Station Z
2400
900
350
The best product mix according to the bottleneck method is 50 Deluxe and 55
Super Duper.
Revenue = (55 x $80) + (50 x $81) = $8,450
Materials = (55 x $10.00) + (50 x $15) = -$1,300
11. Cooper River Glass Works (CRGW)
a. Only 8640 minutes are available for production next month (20*8*60*(1–
.1)=8640). As seen in the following Excel spreadsheet, Station 2 has the largest
load which exceeds available capacity and is thereby the bottleneck .
Identify the bottleneck
Product
Station 1
Station 2
Station 3
Station 4
Demand
Alpha
10 min
5 min
15 min
10 min
200 units
Bravo
20 min
10 min
250 units
Charlie
5 min
15 min
5 min
20 min
150 units
Delta
20 min
5 min
10 min
10 min
225 units
Load
7250 min
9375 min
8500 min
7250 min
b. The profit produced from the traditional method is $52,620. All demand is for
products Alpha, Bravo, and Charlie is satisfied, but only enough capacity remains
to produce 78 units of Delta.
Traditional Method
Capacity
Station 1
Station 2
Station 3
Station 4
Profit
Product
Margin
Production
Initial
8640 min
8640 min
8640 min
8640 min
Bravo
$ 85.00
250 units
Remaining
8640 min
3640 min
6140 min
8640 min
$ 21,250
Charlie
$ 82.00
150 units
7890 min
1390 min
5390 min
5640 min
$ 12,300
Alpha
$ 70.00
200 units
5890 min
390 min
2390 min
3640 min
$ 14,000
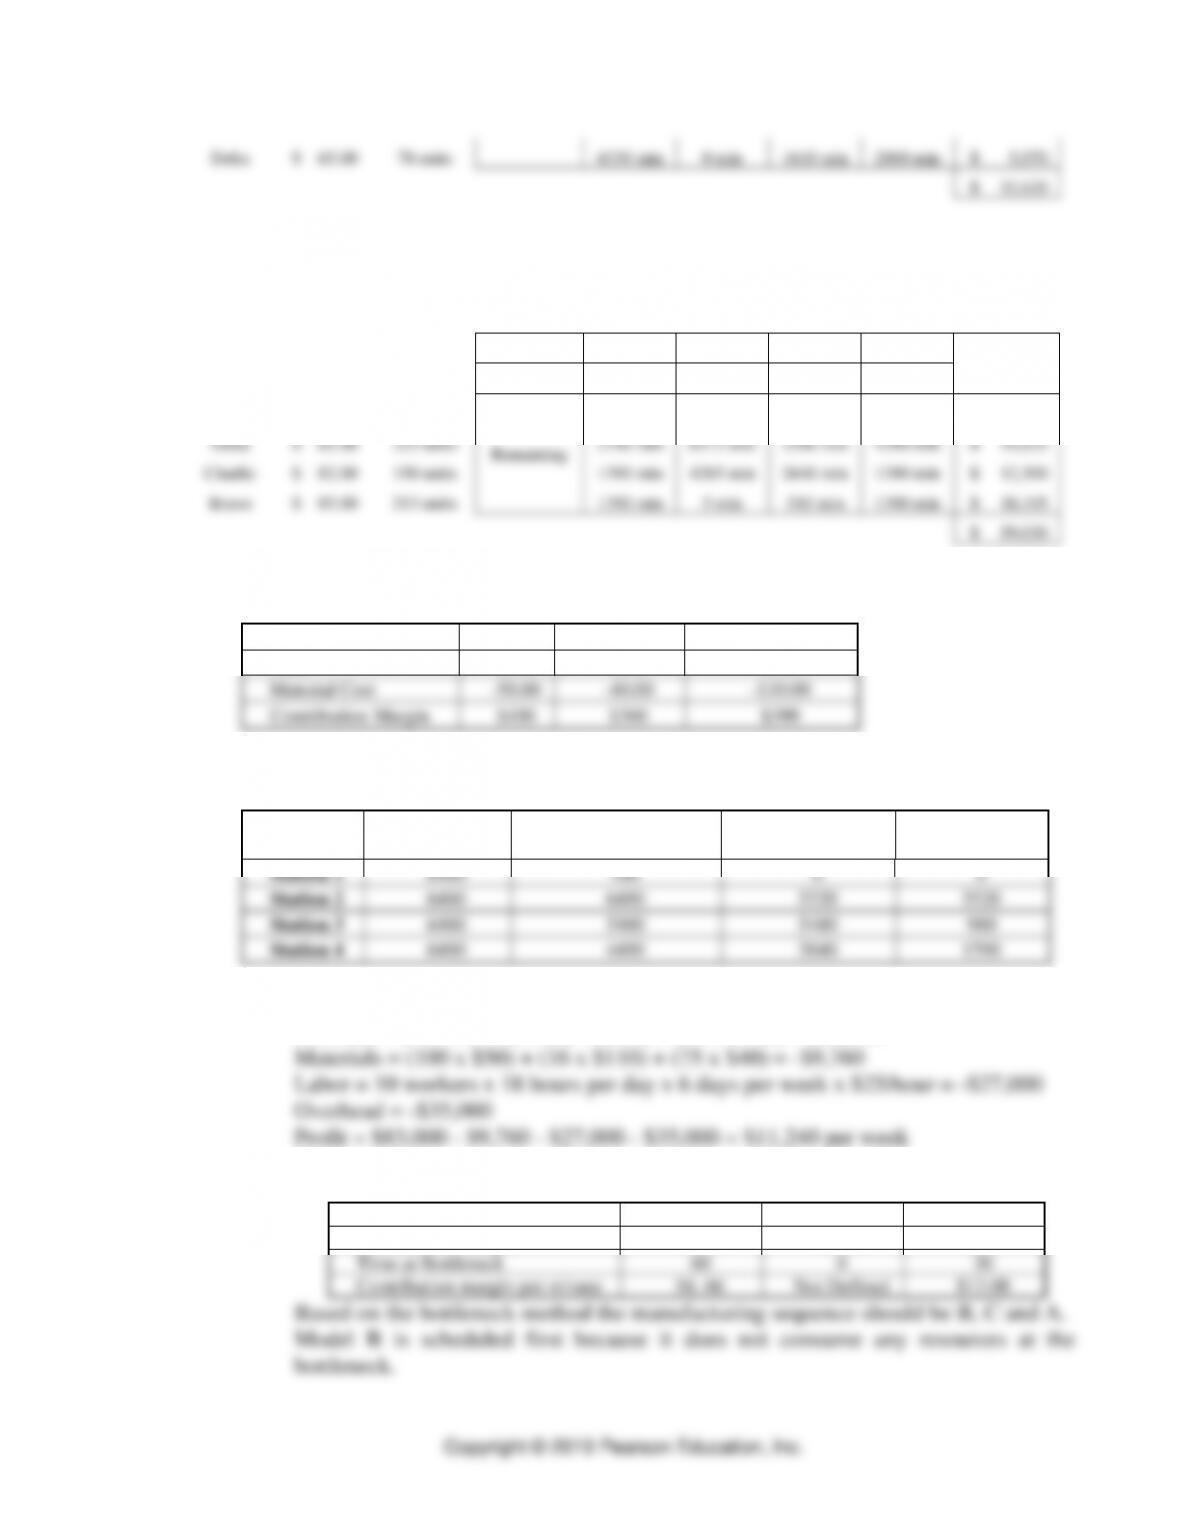
Constraint Management ⚫ CHAPTER 5
5-7
Delta
$ 65.00
78 units
4330 min
0 min
1610 min
2860 min
$ 5,070
$ 52,620
c. The profit produced from the bottleneck method is $59,030. All demand
is for products Alpha, Charlie and Delta is satisfied, but only enough
capacity remains to produce 213 units of Bravo.
Bottleneck Method
Capacity
Station 1
Station 2
Station 3
Station 4
Profit
Product
Margin
Production
Initial
8640 min
8640 min
8640 min
8640 min
Alpha
$ 70.00
200 units
Remaining
6640 min
7640 min
5640 min
6640 min
$ 14,000
Delta
$ 65.00
225 units
2140 min
6515 min
3390 min
4390 min
$ 14,625
Charlie
$ 82.00
150 units
1390 min
4265 min
2640 min
1390 min
$ 12,300
Bravo
$ 85.00
213 units
1390 min
5 min
510 min
1390 min
$ 18,105
$ 59,030
12. Davis Watercraft
a.
A
B
C
Price
$450
$400
$500
Material Cost
-50.00
-40.00
-110.00
Contribution Margin
$400
$360
$390
When ordered highest to lowest, the profit margin per unit sequence of these
products is A, C,B.
Work
Center
Minutes at
the Start
Minutes Left after
Making 100 A
Can only make
16 C
Can still
Make 75 B
Station 1
6480
480
0
0
Station 2
6480
6480
5520
5520
Station 3
6480
5480
5480
980
Station 4
6480
4480
3840
1590
The best product mix using the traditional approach is then 100 A, 16 C and 75 B.
Revenue = (100 x $450) + (16 x $500) + (75 x $400) = $83,000
b.
A
B
C
Contribution Margin
$400
$360
$390
Time at Bottleneck
60
0
30
Contribution margin per minute
$6. 66
Not Defined
$13.00
Based on the bottleneck method the manufacturing sequence should be B, C and A.
Model B is scheduled first because it does not consume any resources at the
bottleneck.
⚫ PART 1 ⚫ Managing Processes
5-8
Work Center
Minutes at the
Start
Minutes Left after
Making 75 B
Minutes Left after
Making 40 C
Can only
Make 88 A
Station 1
6480
6480
5280
0
Station 2
6480
6480
4080
4080
Station 3
6480
1980
1980
1100
Station 4
6480
4230
2630
870
The best product mix according to the bottleneck method is 75B, 40C and 88A.
Profit
Revenue = (88 x $450) + (40 x $500) + (75 x $400) = $89,600
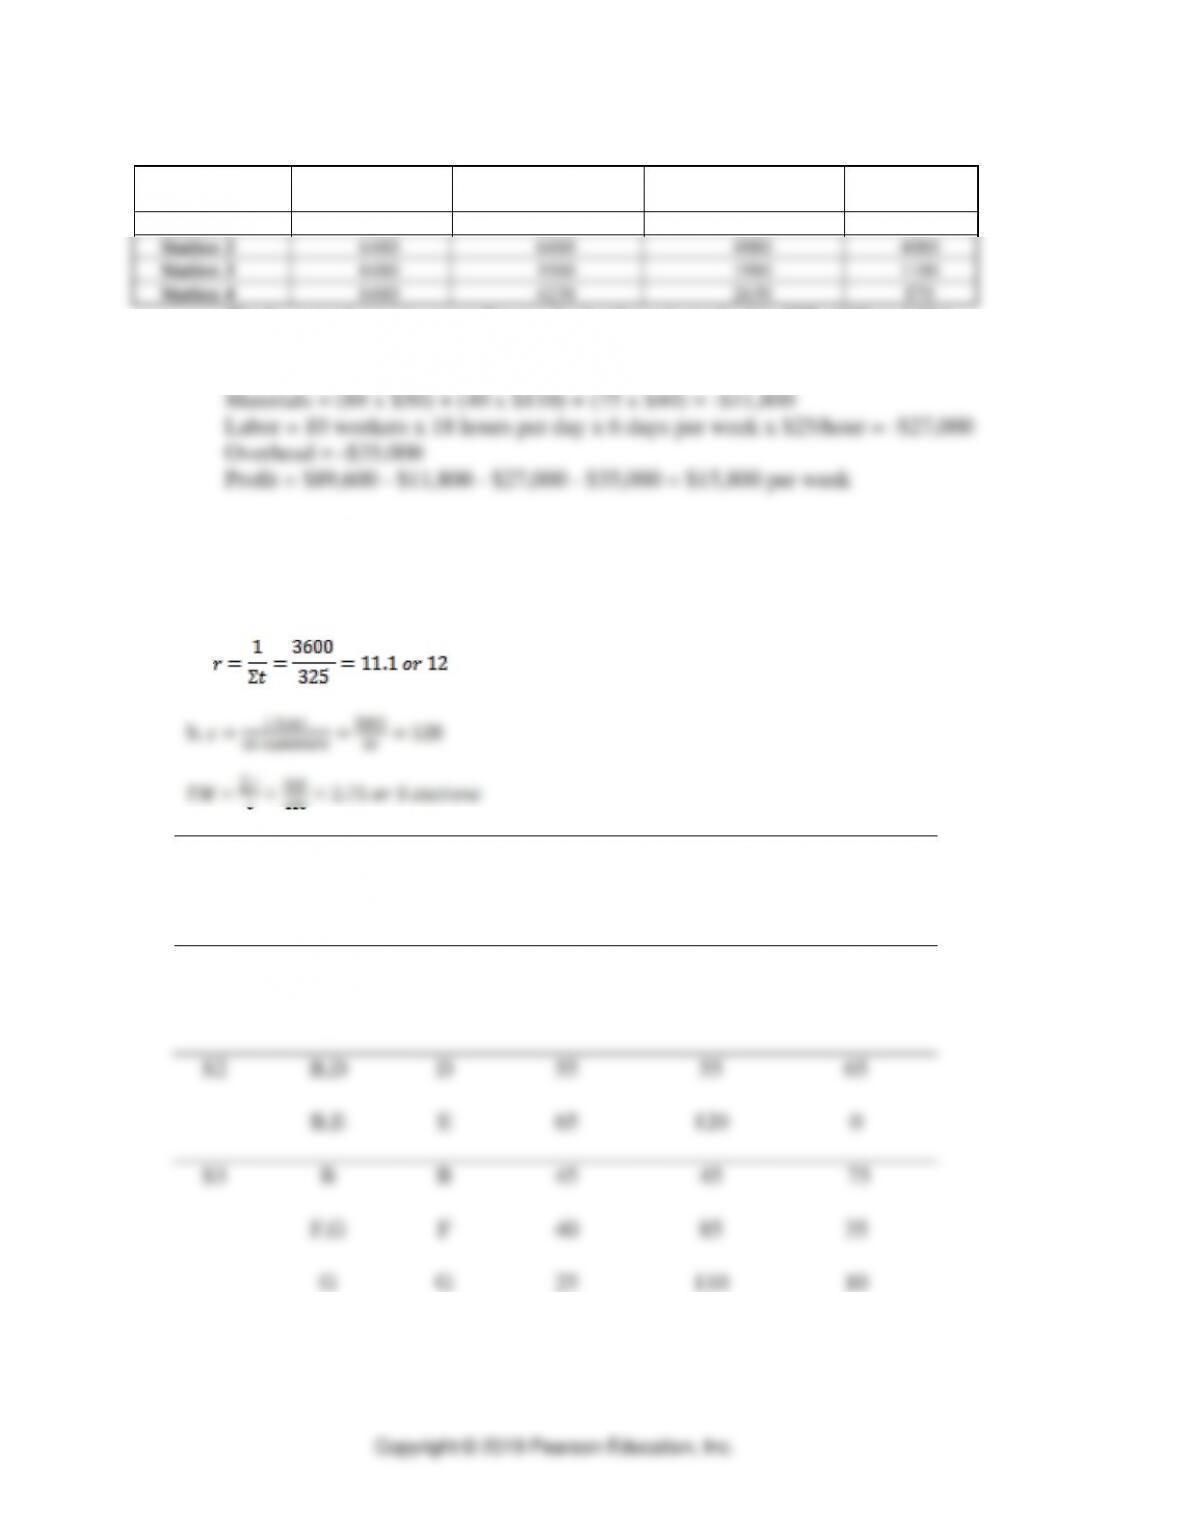
Managing Constraints in Line Processes
13. Quick Stop Pharmacy
a.
c.
Work Element
Cumulative
Idle Time
Station
Candidate(s)
Choice
Time (sec)
Time (sec)
(c=120 sec)
S1
A
A
40
40
80
B,C
C
55
95
25
S2
B,D
D
55
55
65
B,E
E
65
120
0
S3
B
B
45
45
75
F,G
F
40
85
35
G
G
25
110
10
d. Station number 2 is the bottleneck with no capacity cushion.
Constraint Management ⚫ CHAPTER 5
5-9
14. Assembly-line balancing with longest work element rule to produce 40 units per
hour.
a.
cr
= = = =
1 1 3600 sec 90
hour
40 units 40 units
sec
unit
415 ===
t
Work Element
Cumulative
Idle Time
Station
Candidate(s)
Choice
Time (sec)
Time (sec)
(
c=90
sec)
S1
A
A
40
40
50
C
C
30
70
20
E
E
20
90
0
S2
B
B
80
80
10
S3
D, F, G
G
60
60
30
D, F, I
D
25
85
5
S4
F, H, I
H
45
45
45
F, I
F
15
60
30
I
I
10
70
20
S5
J
J
75
75
15
K
K
15
90
0
t
=
78%
.
e. S1 = {A, C, E}, S2 = {B}, S3 = {F,D,H}, S4 = {G, I}, S5 = {J, K}
Work Element
Cumulative
Idle Time
Station
Candidate(s)
Choice
Time (sec)
Time (sec)
(
c=90
sec)
S1
A
A
40
40
50
C
C
30
70
20
E
E
20
90
0
S2
B
B
80
80
10
S3
D, F, G
F
15
15
75
D, G, J
H
D
H
25
45
40
85
50
5
S4
G, J
G
60
60
30
I
I
10
70
20
S5
J
J
75
75
15
K
K
15
90
0
⚫ PART 1 ⚫ Managing Processes
5-10
15. Johnson Cogs
A
40
B
30
C
50
G
15
F
25
D
40
E
6
H
20
I
18
J
30
a. Before calculating the theoretical minimum number of stations, we find the cycle
time as:
3600 sec hr 60 sec unit
60 units/hr
c==
.
60
274 ===
c
t
b. Task assignments using longest work-element time rule:
Cumulative
Idle Time
Station
Candidates
Assignment
Time
(
c=60
)
S1
A
A
40
20
S2
B, C
C
50
10
S3
B, F, G
B
30
30
E, F, G
F
55
5
S4
D, E, G
D
40
20
E, G
G
55
5
S5
E, I
I
18
42
E
E
24
36
H
H
44
16
S6
J
J
30
30
c. Efficiency with 5 workstations:
( )
605
274
c
t
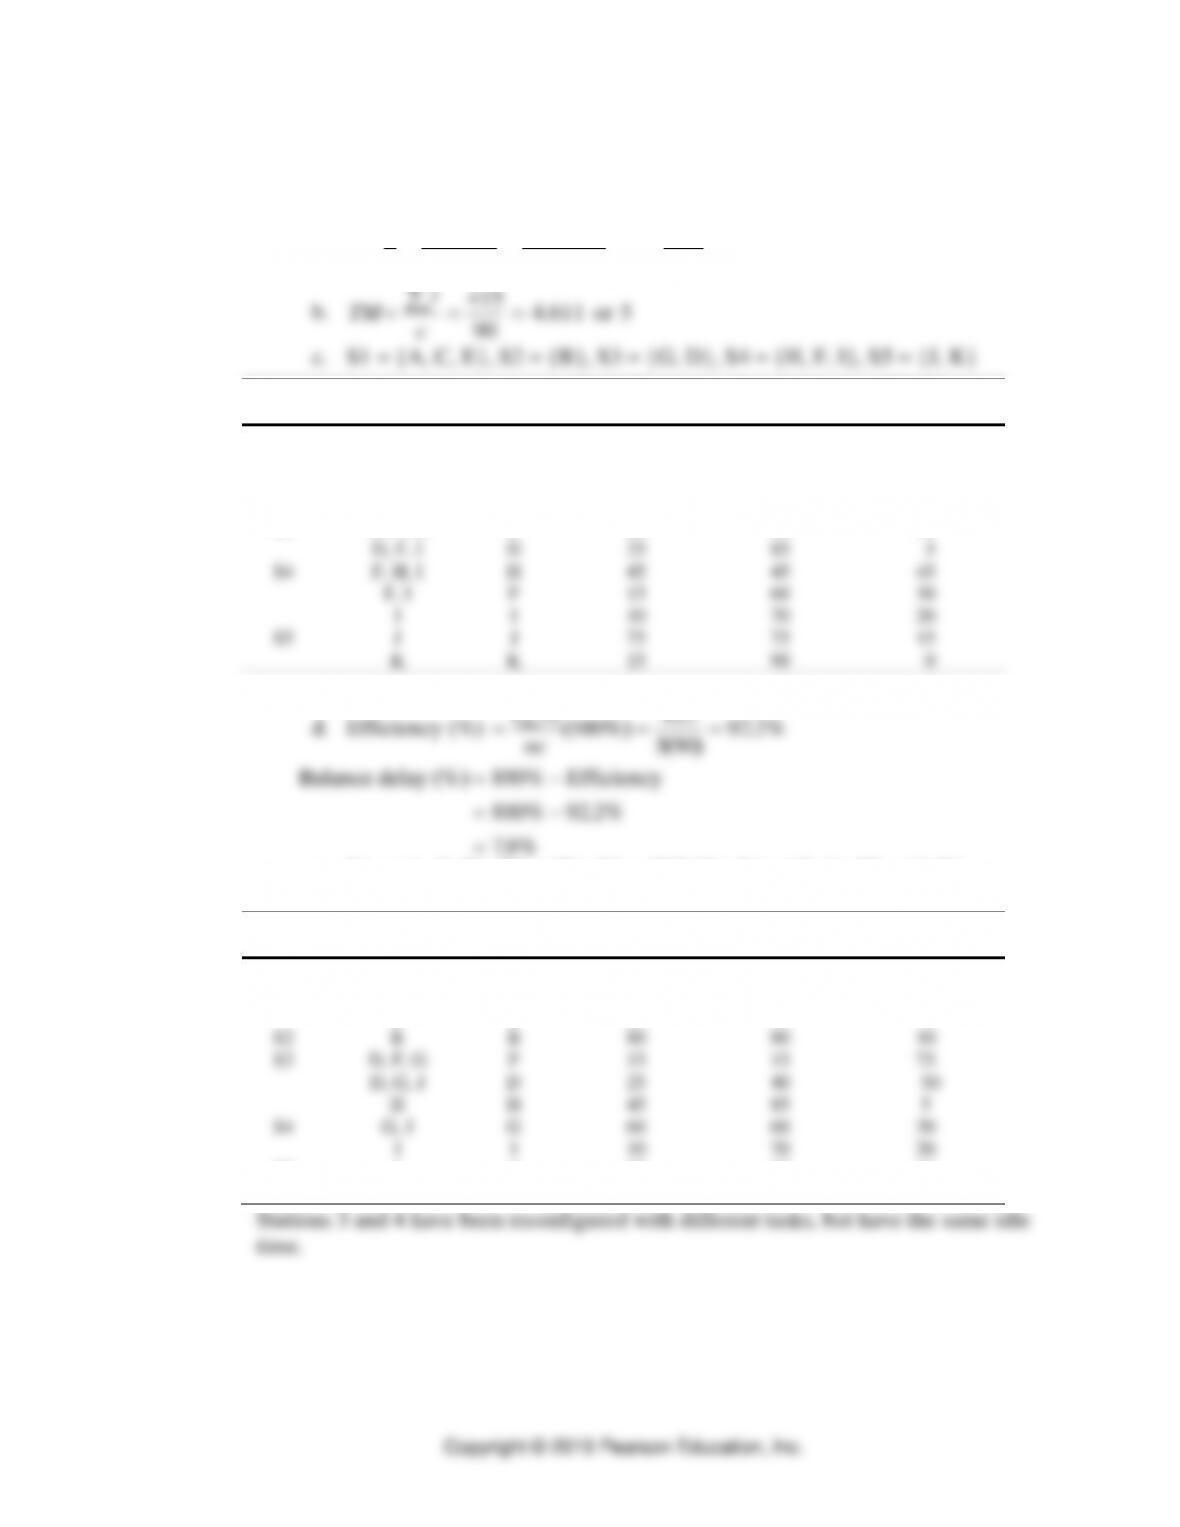
16. Trim line at PW
a. Precedence diagram for PW.
Constraint Management ⚫ CHAPTER 5
5-11
A ID
F
E
KH
MLJG
C
B
1.8 1.41.5
0.7
0.5
0.4 0.8 1.4 1.0 0.8
1.6 1.4 0.5
b. The trim line must handle 20 cars per hour. This translates into 3 minutes per
car. Thus, the cycle time is 3 minutes.
c. The total work content is 13.8 minutes. The theoretical minimum number of
stations is:
stations5or6.4
3
8.13 ===
c
t
TM
d.
Balance
Work Ready Work
Station element Time Time left elements
A,B,C
1 A 1.8 1.2 B,C,D,E
E .7 .5 B,C,D,F
F .5 0 B,C,D
2 C 1.6 1.4 B,D,H
H 1.4 0 B,D,K
e. The most followers decision rule provides the following solution: S1= {A,B,E},
S2={C,G,F}, S3={D,H}, S4={J,I}, S5={K,L,M}. Since this solution only requires 5
stations, the efficiency is improved. The POM for Windows solution follows.
Balance
Work Ready Work
Station element Time Time left elements
A(7),B(4),C(3)
⚫ PART 1 ⚫ Managing Processes
5-12
E .7 .1 C(3),D(2),G(3),F(3)
2 C 1.6 1.4 D(2),G(3),F(3),H(2)
G .8 .6 D(2),F(3),H(2)
F .5 .1 D(2),H(2),J(2)
3 D 1.5 1.5 H(2),J(2),I(1)
Summary Statistics
Cycle time = 3 minutes
Min (theoretical) # of stations = 5
Actual # of stations = 5
Balance Delay = 8%
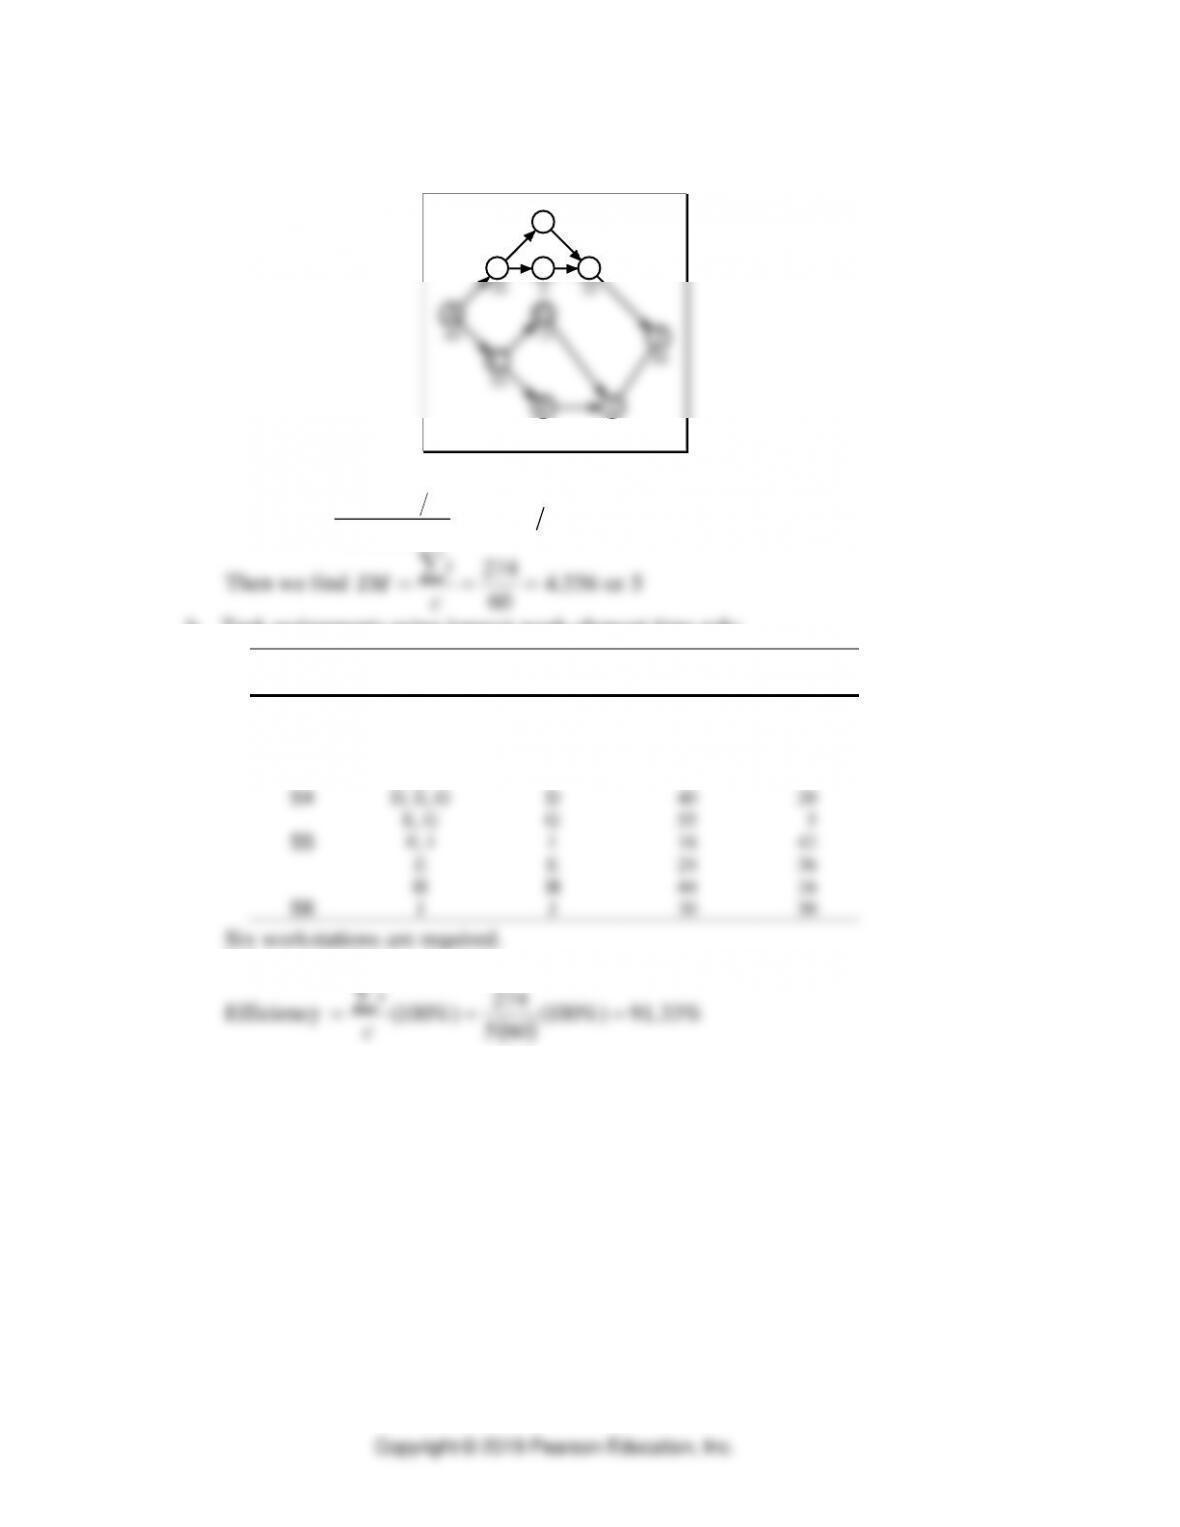
17. Trim line at PW (part 2)
Precedence diagram for PW.
AI
D
F
E
K
H
M
L
J
G
C
B
1.8 1.41.5
0.7
0.5
0.4 0.8 1.4 1.0 0.8
1.6 1.4 0.5
The trim line must handle 20 cars per hour. This translates into 3 minutes per car.
Thus, the cycle time is 3 minutes.
The total work content is 13.8 secs. The theoretical minimum number of stations
3
c
Using the precedence diagram as a guide, packing each station as close as
possible to the cycle time, and considering the two zoning constraints, the
following solution results:
Work Elements
Total
Station
Assigned
Content
Station Slack
S1
A, B, E
2.9
0.1
S2
C, F, G
2.9
0.1
S3
D, H
2.9
0.1
S4
2.8
0.2
Constraint Management ⚫ CHAPTER 5
5-13
S5
K, L, M
2.3
0.7
The following solution works with the same results:
S1={A,E,B}, S2={C,H}, S3={D,I}, S4={G,F,J}, S5={L,K,M}
Efficiency
=( ) ( )( ) =
138 5 3 100 92%.
18. Penny’s Pie Shop
a. Output rate equals 50/week which is 50/40 or 1.25 per hour
Cycle time = 1/ 1.25 hours per unit or 48 minutes per unit
b. b.
2or458.1
min48
min70 ===
c
t
TM
( )
min484
c
19. Calculators
a. Maximum hourly output rate.
Total Time
Station
per Cycle
Station Slack
S1
2.7
0.3
S2
1.5
1.5
S3
3.0
0.0
S4
2.3
0.7
S5
2.2
0.8
S6
2.4
0.6
Total 14.1
3.9
b. The cycle time would be 3 minutes, allowing no idle time for the “bottleneck”
station S3.
20. Jane’s Custom Cards
a. Output rate equals 10/ 8 hours which is 1.25 per hour
Cycle time = 1/ 1.25 hours per unit or 48 minutes per unit
⚫ PART 1 ⚫ Managing Processes
5-14
Efficiency
( )
%167.29%)100(
min485
min70
%)100( ===
c
t
Balance Delay = 100-29.167 = 70.833 percent
d. The cycle time would increase from 48 minutes to 96 minutes. The new
21. Six Points Saco
a. With one employee, the cycle time = total of all task times (because one person
b. Output rate equals 3600sec/45 customers or 80 sec/customer. The minimum
e. From part d, we know that the bottleneck task is Task C (35 seconds). Thus,
Greg should add one worker to help out with task C, thereby reducing the
EXPERIENTIAL LEARNING: MIN-YO GARMENT COMPANY
A. Synopsis
The Min-Yo Garment simulation case is intended to be used in conjunction with
Chapter 7. The case describes a company that has established a sound reputation in the
garment industry but has not established a consistent market strategy. The company is
opportunistic, trying to maintain the make–to–stock business on which it had built its
reputation while branching out into more lucrative markets. Its manufacturing strategy is
to build flexibility in the production process. This was accomplished by investing in a
machine that can produce every product the firm manufactures. However, the machine
is not a perfect match for any of the markets the firm is pursuing. Profits are declining,