Unlock document.
This document is partially blurred.
Unlock all pages and 1 million more documents.
Get Access
Chapter
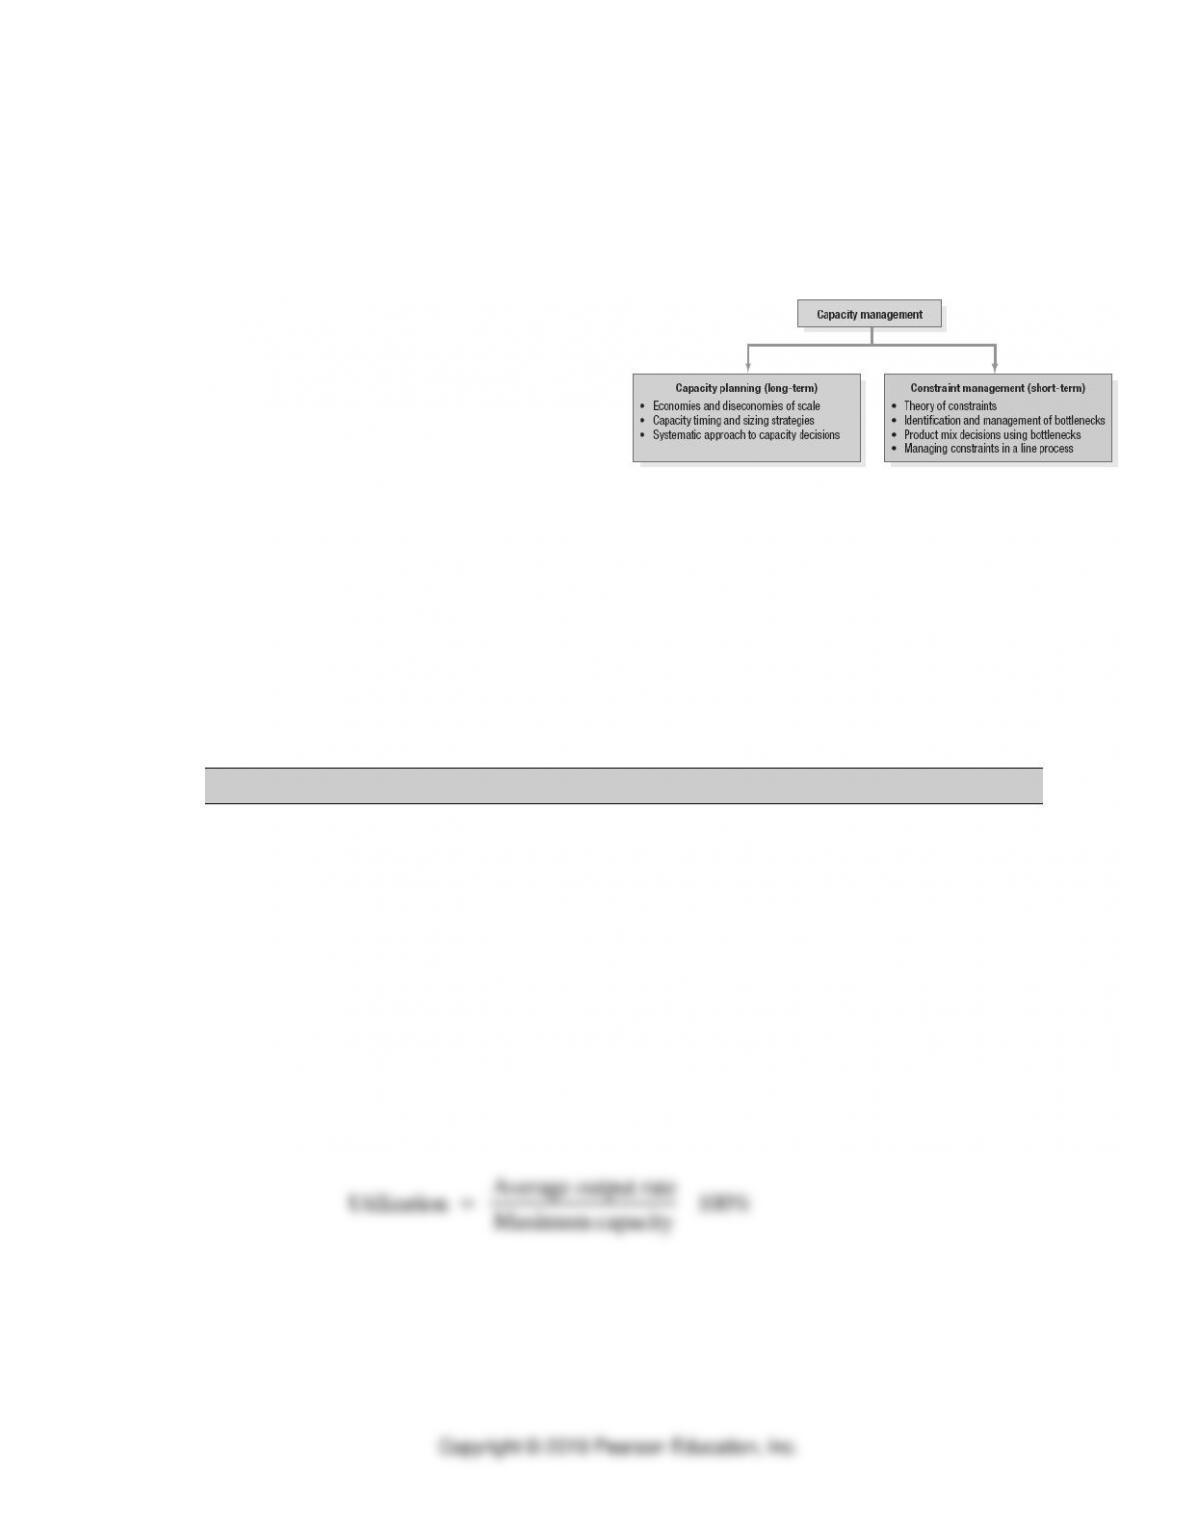
4 Capacity Planning
1. Define Capacity:
2. How are constraint and capacity decisions related?
a. Accounting:
b. Finance:
c. Marketing:
d. Management information systems:
1. Planning Long-Term Capacity
1. Long-term capacity planning
2. Measures of capacity and utilization
a. Output measures
b. Input measures
c. Utilization
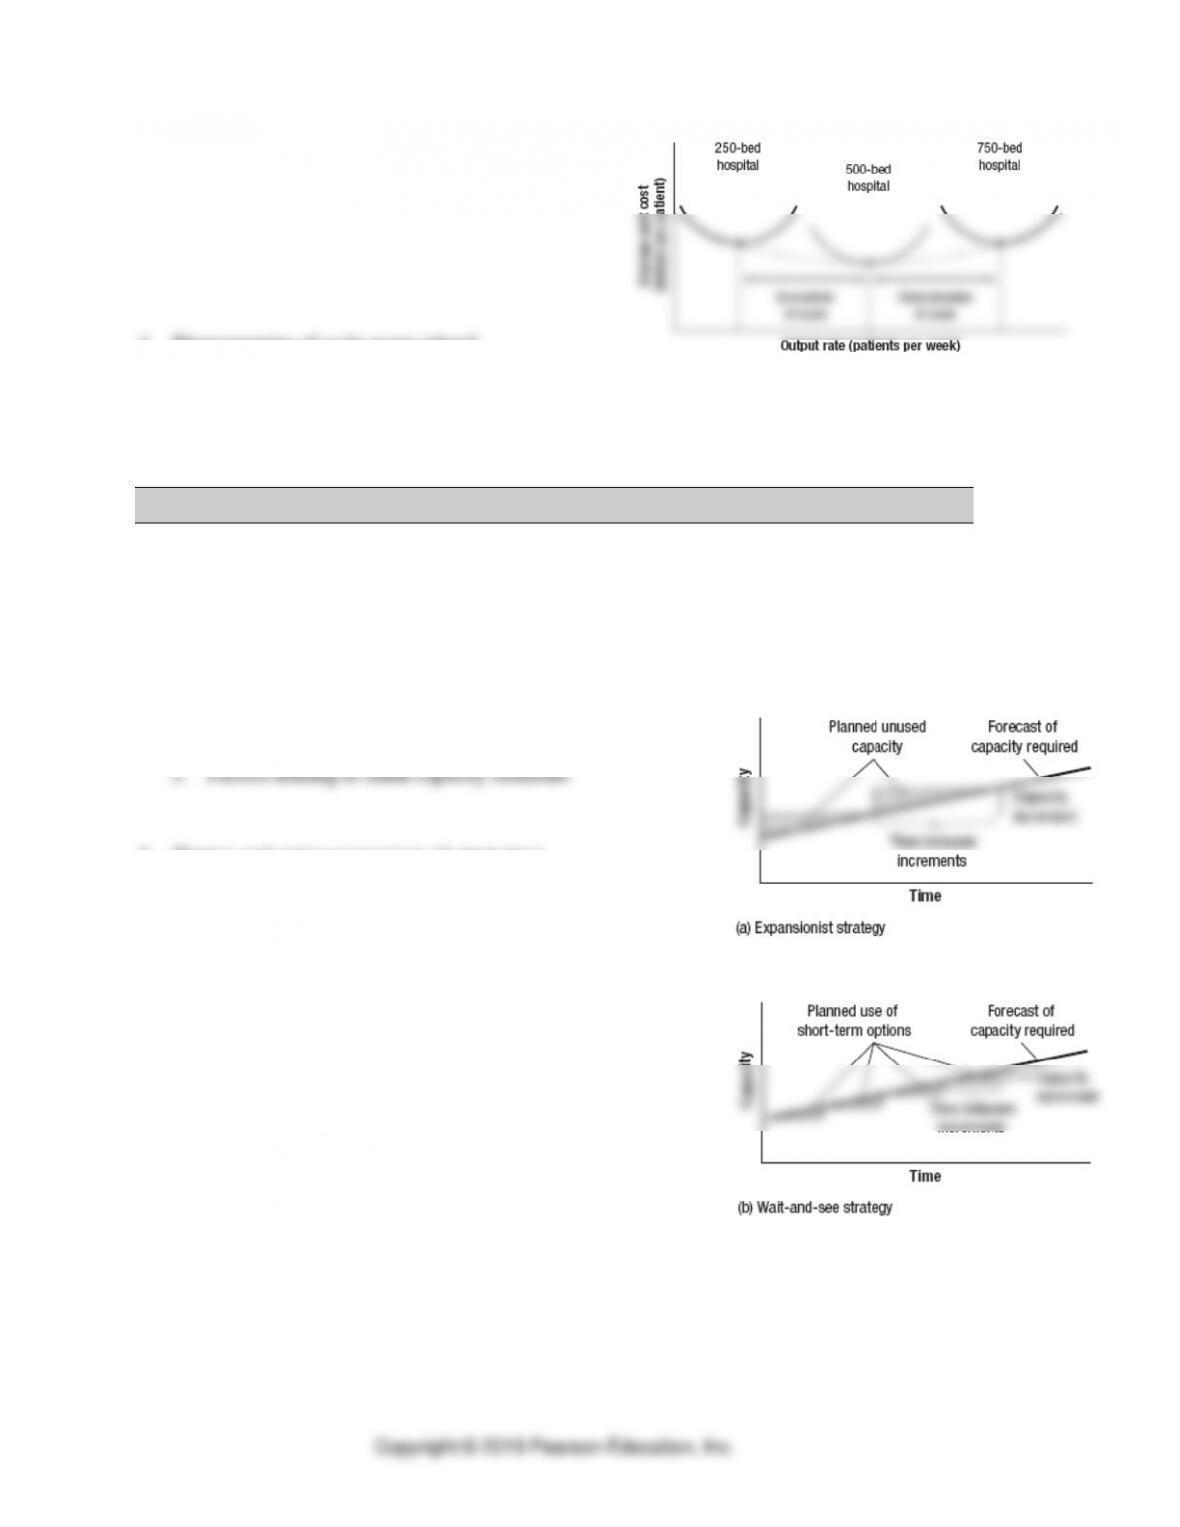
3. Economies of scale occur when?
4. Diseconomies of scale occur when?
2. Capacity Timing and Sizing Strategies
Three dimensions to capacity strategy
1. Sizing capacity cushions
a. Average utilization rate near 100% indicate:
b. Factors leading to large capacity cushions:
2. Timing and sizing expansions (3 strategies)
a. Expansionist strategy
b. Wait and see strategy
c. An intermediate strategy, could be to follow the
leader, expanding when others do
3. Linking process capacity and other operating decisions
3. A Systematic Approach to Long-Term Capacity Decisions
1. Step 1: Estimate Capacity Requirements
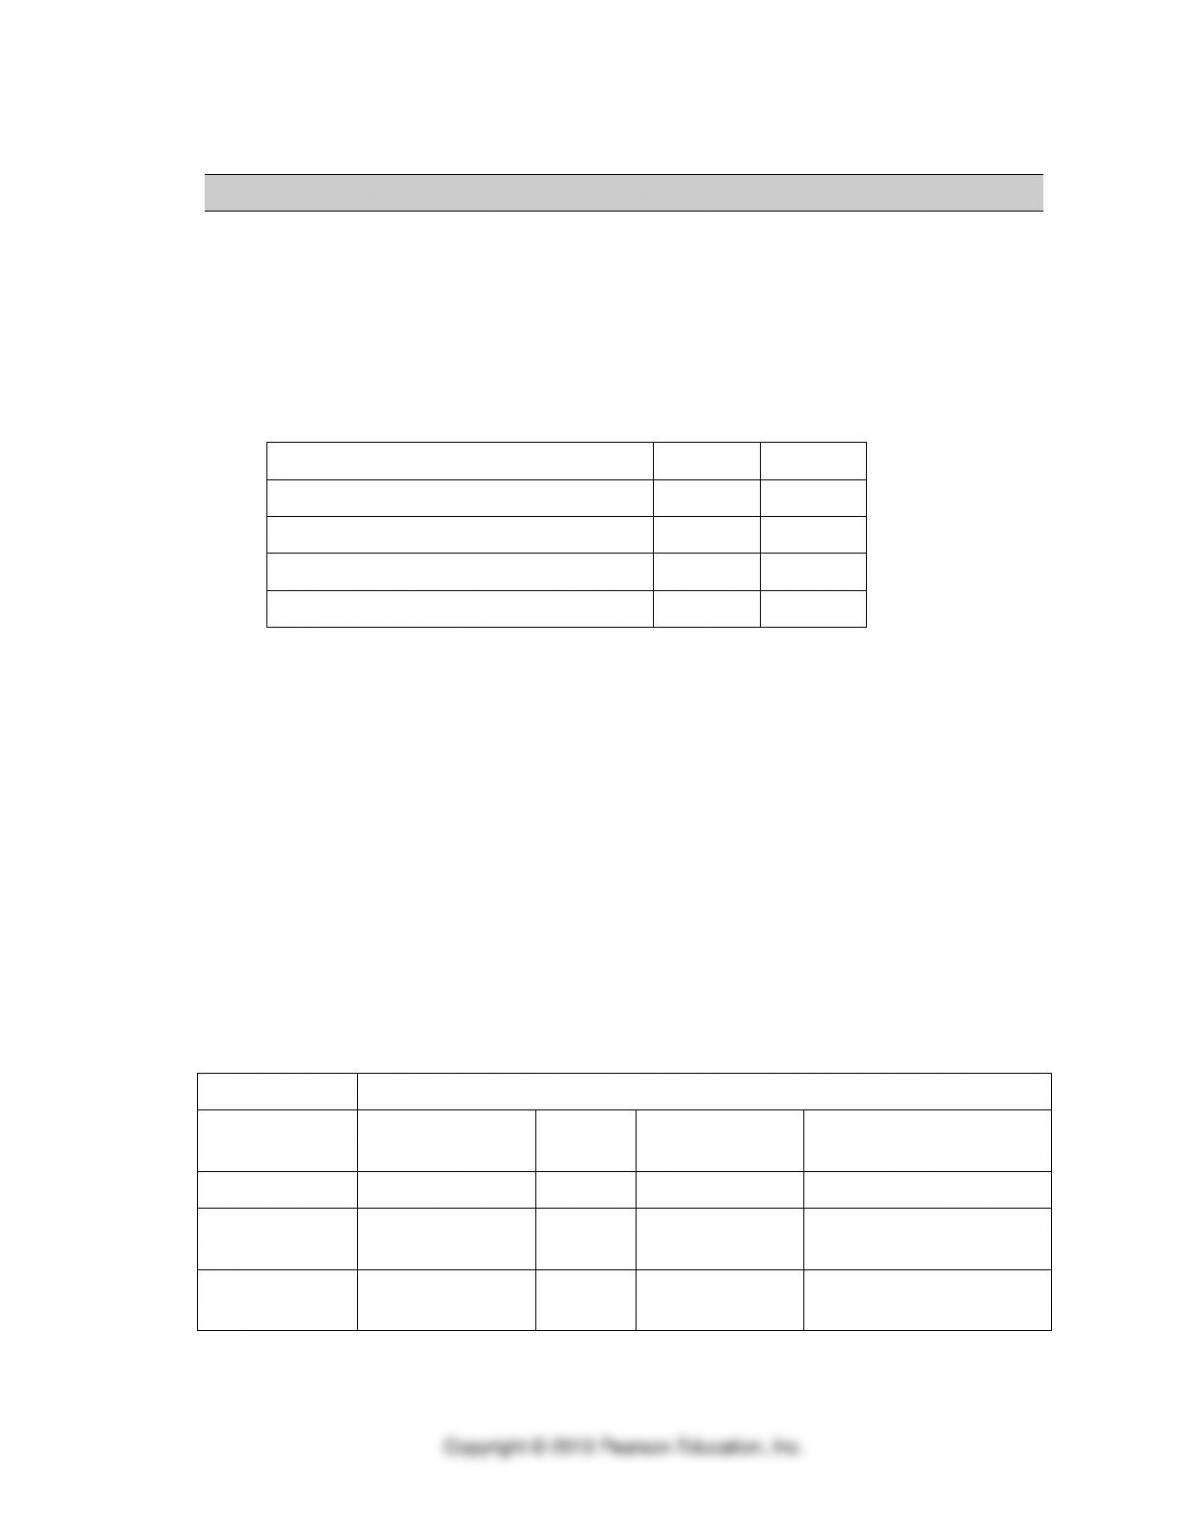
Example 4.1: A copy center in an office building prepares bound reports for two clients. The
center makes multiple copies (the lot size) of each report. The processing time to run, collate,
and bind each copy depends on, among other factors, the number of pages. The center
operates 250 days per year, with one 8-hour shift. Management believes that a capacity
cushion of 15 percent (beyond the allowance built into time standards) is best. It currently
has three copy machines. Based on the following table
Item
Client X
Client Y
Annual demand forecast (copies)
2,000
6,000
Standard processing time (hour/copy)
0.5
0.7
Average lot size (copies per report)
20
30
Standard setup time (hours)
0.25
0.40
a.
b.
c.
d. Application 4.1: Surefoot Sandal Company
You have been asked to put together a capacity plan for a critical operation at Surefoot
sandal Company. Your capacity measure is number of machines. Three products
(men’s, women’s, and children’s sandals) are manufactured. The time standards
(processing and setup), lot sizes, and demand forecast are given in the following table.
The firm operates two 8-hour shifts, 5 days per week, 50 weeks per year. Experience
shows that a capacity cushion of 5 percent is sufficient.
Time Standards
Product
Processing
(hr/pair)
Setup
(hr/pair)
Lot Size
(pairs/lot)
Demand Forecast
(pairs/year)
Men’s sandals
0.05
0.5
240
80,000
Women’s
sandals
0.10
2.2
180
60,000
Children’s
sandals
0.02
3.8
360
120,000
2. Step 2: Identify Gaps
a.
b.
3. Step 3: Develop Alternatives
a.
b.
c. Example 4.2: Grandmother’s Chicken Restaurant
Grandmother’s Chicken Restaurant expects to serve a total of 80,000 meals this year. Although
the kitchen is operating at 100 percent capacity, the dining room can handle a total of 105,000
diners per year. Forecasted demand for the next five years is 90,000 meals for next year, followed
by a 10,000-meal increase in each of the succeeding years. One alternative is to expand both the
kitchen and the dining room now, bringing their capacities up to 130,000 meals per year. The
initial investment would be $200,000, made at the end of this year (year 0). The average meal is
priced at $10, and the before-tax profit margin is 20 percent. The 20 percent figure was arrived at
by determining that, for each $10 meal, $6 covers variable costs and $2 goes toward fixed costs
(other than depreciation). The remaining $2 goes to pretax profit.
What are the pretax cash flows from this project for the next five years compared to those of the
base case of doing nothing?
Solution
Year 2:
Demand = 100,000
Cash flow =
Year 3:
Demand = 110,000
Cash flow =
Year 4:
Demand = 120,000
Cash flow =
Year 5:
Demand = 130,000
Cash flow =
d. Application 4.2: Grandmother’s Chicken Restaurant (continued)
This alternative expands the kitchen at the end of year 0, raising its capacity from 80,000 meals
per year to that of the dining area (105,000 meals per year).
If sales in year 1 and 2 live up to expectations, the capacities of both the kitchen and the dining
room will be expanded at the end of year 3 to 130,000 meals per year.
This upgraded capacity level should suffice up through year 5. The initial investment would be
$80,000 at the end of year 0 and an additional investment of $170,000 at the end of year 3. The
pretax profit is $2 per meal.
What are the pretax cash flows for this alternative through year 5, compared with the base case?
Solution
Year 0:
Demand = 80,000
Cash flow =
Year 1:
Demand = 90,000
Cash flow =
Year 2:
Demand = 100,000
Cash flow =
Year 3:
Demand = 110,000
Cash flow =
Year 4:
Demand = 120,000
Cash flow =
Year 5:
Demand = 130,000
Cash flow =
4. Step 4: Evaluate the Alternatives
a.
b.
4. Tools for Capacity Planning
1. Waiting line models
2. Simulation
3. Decision trees


