Capacity Planning ⚫ CHAPTER 4 ⚫
Copyright © 2019 Pearson Education, Inc.
period is longer than 4 years, it does not meet Darren’s threshold.
Consequently, the project should not be undertaken.
25. Dintell Corporation. Assuming a five-year life.
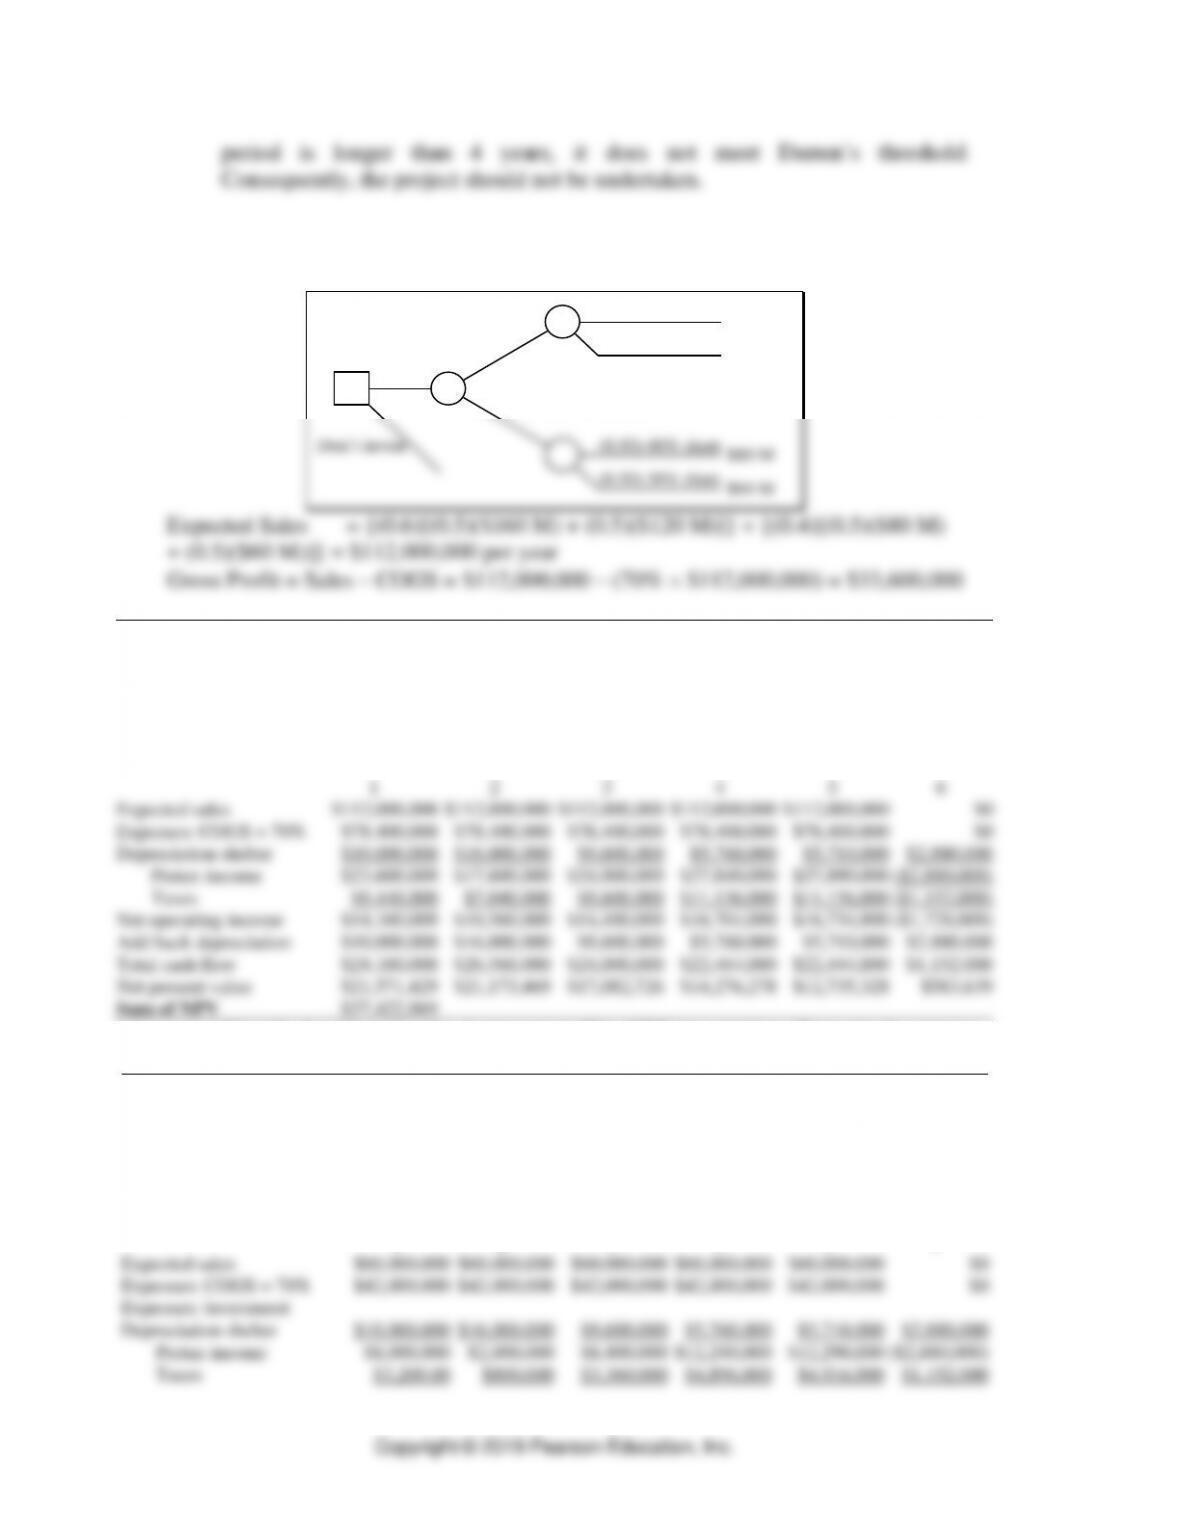
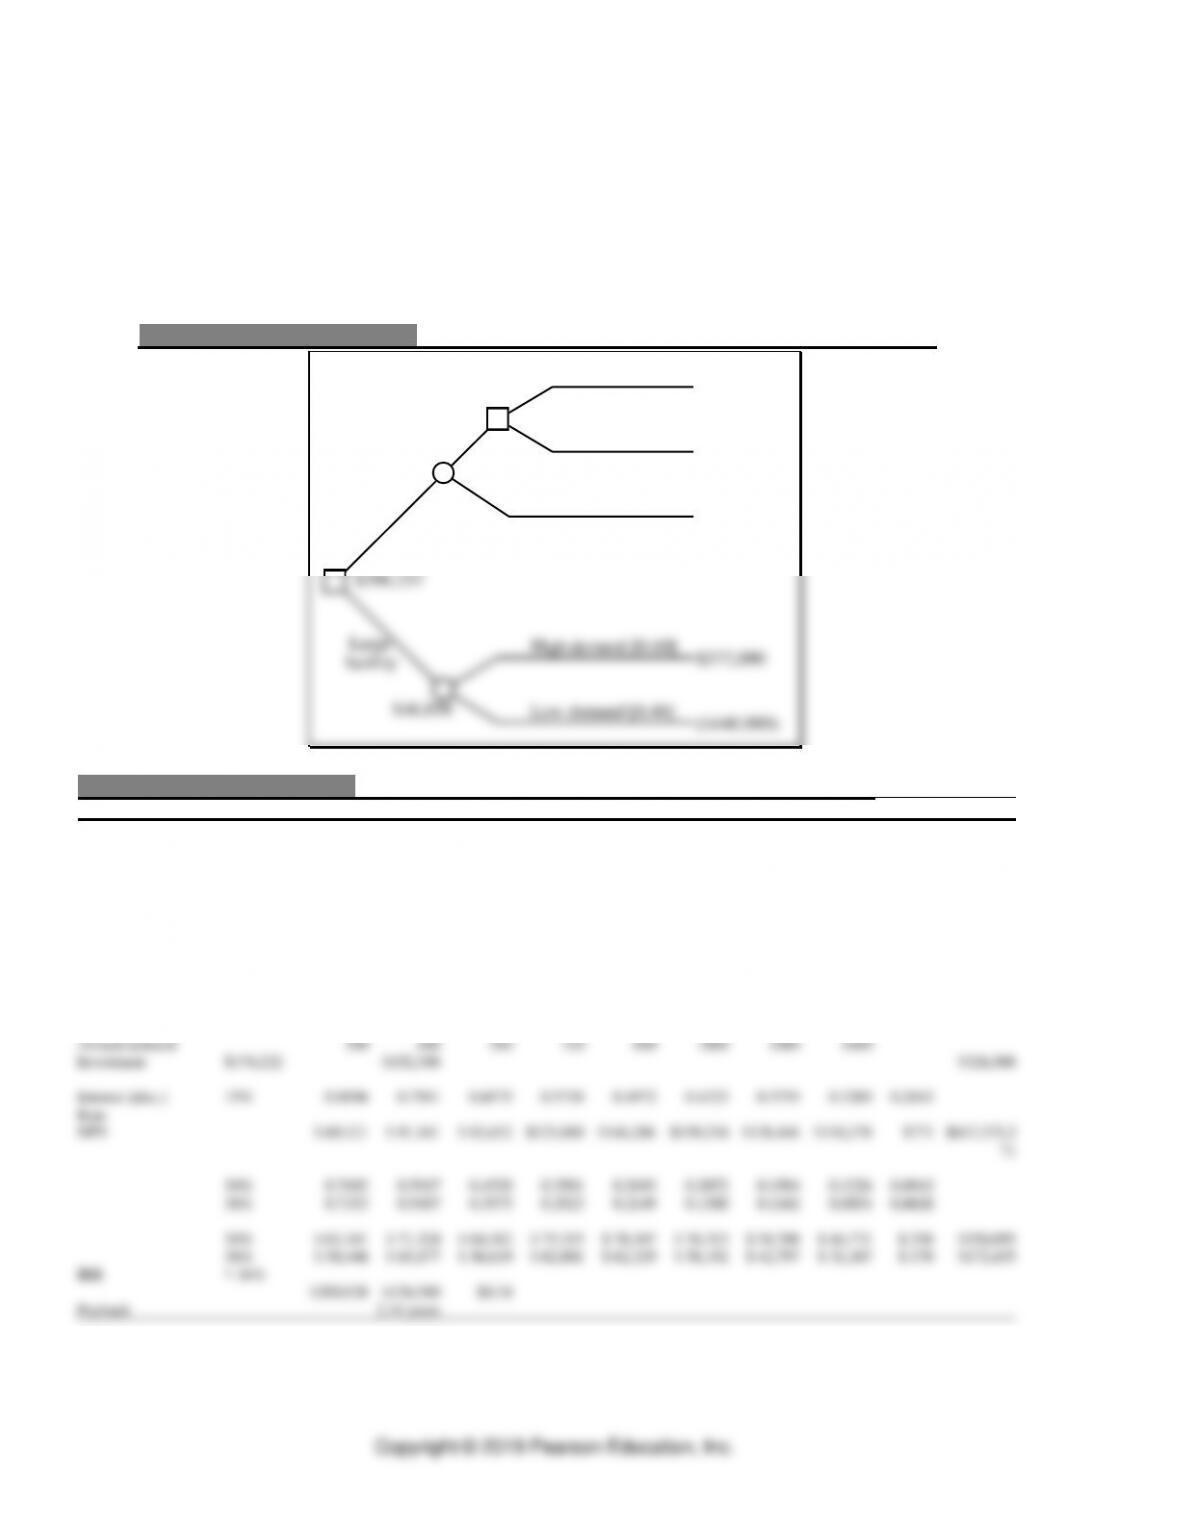
Decision tree:
Invest
(0.50) 40% share
Don’t invest
$160 M
(0.50) 30% share $120 M
(0.50) 40% share $80 M
(0.50) 30% share $60 M
(0.60) $400 M market
(0.40) $200 M market
Initial information
Initial investment
$50,000,000
Tax rate
0.40
Discount rate
0.12
MACRS depreciation
0.2000
0.3200
0.1920
0.1152
0.1142
0.0576
Present value factor
0.8929
0.7972
0.7118
0.6355
0.5674
0.5066
Year
1
2
3
4
5
6
Expected sales
$112,000,000
$112,000,000
$112,000,000
$112,000,000
$112,000,000
$0
Expenses: COGS = 70%
$78,400,000
$78,400,000
$78,400,000
$78,400,000
$78,400,000
$0
Depreciation shelter
$10,000,000
$16,000,000
$9,600,000
$5,760,000
$5,710,000
$2,880,000
Pretax income
$23,600,000
$17,600,000
$24,000,000
$27,840,000
$27,890,000
($2,880,000)
Taxes
$9,440,000
$7,040,000
$9,600,000
$11,136,000
$11,156,000
($1,152,000)
Net operating income
$14,160,000
$10,560,000
$14,400,000
$16,704,000
$16,734,000
($1,728,000)
Add back depreciation
$10,000,000
$16,000,000
$9,600,000
$5,760,000
$5,710,000
$2,880,000
Total cash flow
$24,160,000
$26,560,000
$24,000,000
$22,464,000
$22,444,000
$1,152,000
Net present value
$21,571,429
$21,173,469
$17,082,726
$14,276,278
$12,735,328
$583,639
Sum of NPV
$37,422,869
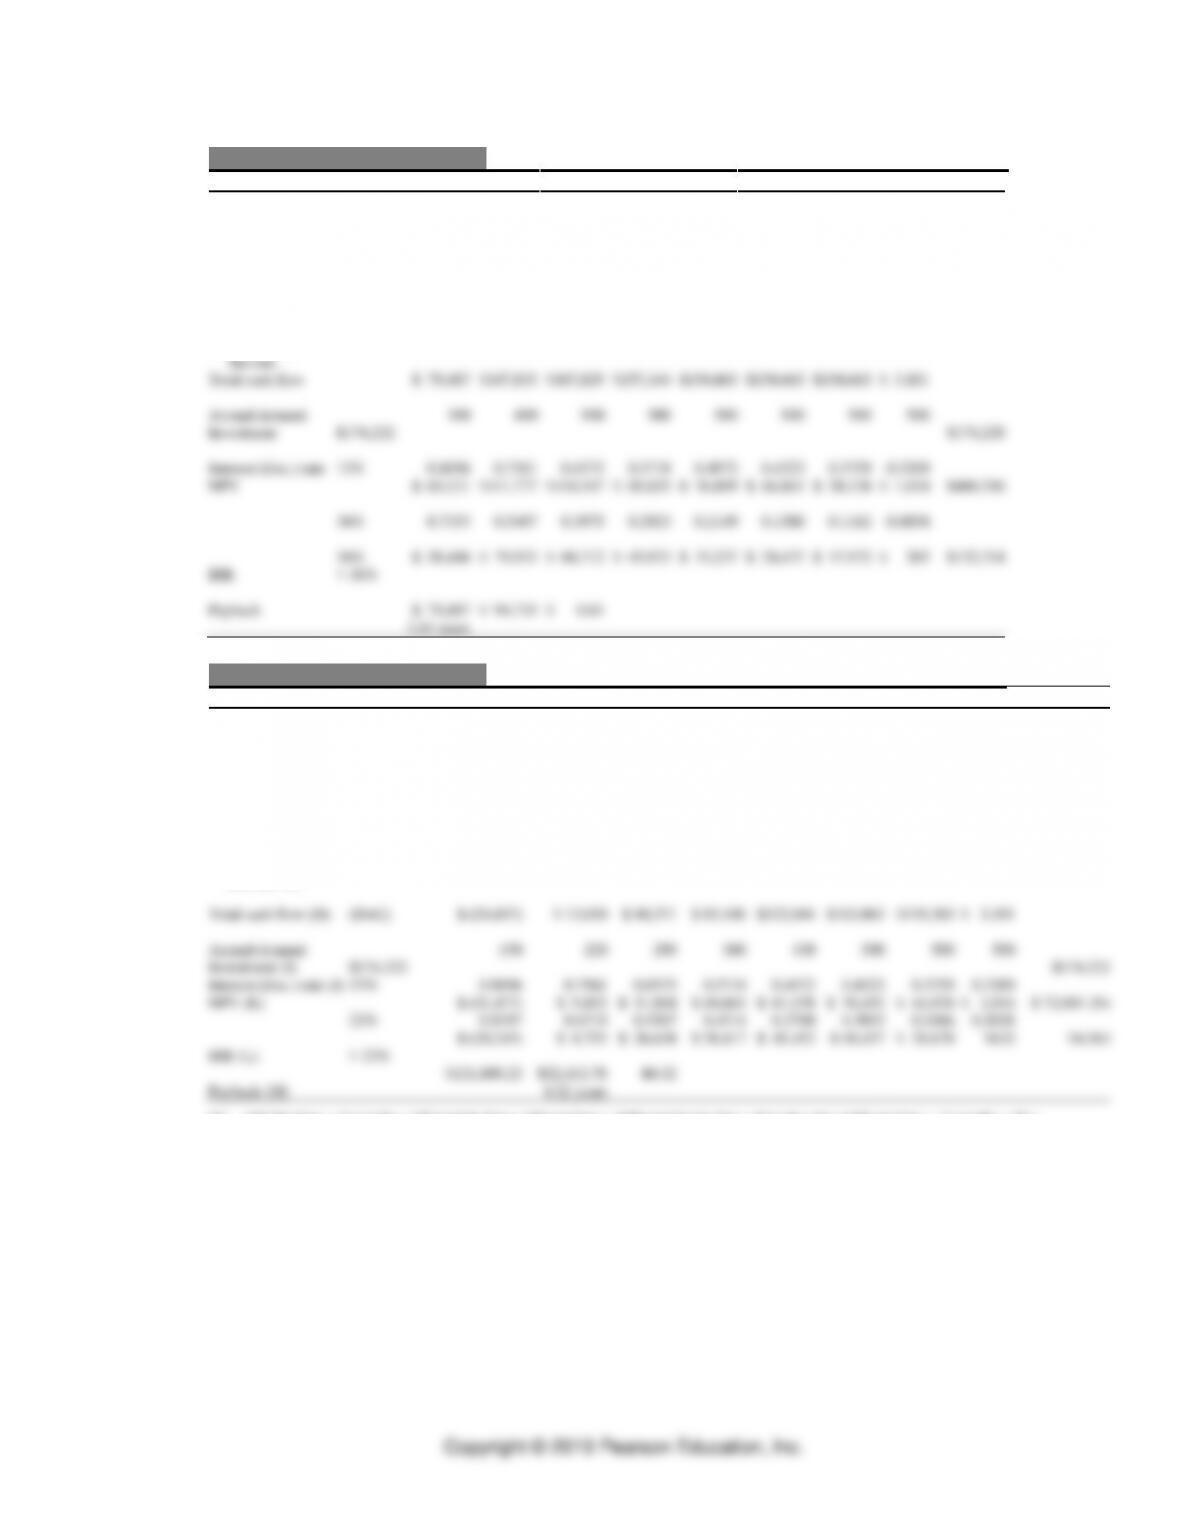
a. Dintell should make the investment. The NPV is positive. Even in the worst
case, as shown below (Sales = $60 M), the NPV remains positive.
Initial information
Initial investment
$50,000,000
Tax rate
0.40
Discount rate
0.12
MACRS depreciation
0.2000
0.3200
0.1920
0.1152
0.1142
0.0576
Present value factor
0.8929
0.7972
0.7118
0.6355
0.5674
0.5066
Year
1
2
3
4
5
6
Expected sales
$60,000,000
$60,000,000
$60,000,000
$60,000,000
$60,000,000
$0
Expenses: COGS = 70%
$42,000,000
$42,000,000
$42,000,000
$42,000,000
$42,000,000
$0
Expenses: investment
Depreciation shelter
$10,000,000
$16,000,000
$9,600,000
$5,760,000
$5,710,000
$2,880,000
Pretax income
$8,000,000
$2,000,000
$8,400,000
$12,240,000
$12,290,000
($2,880,000)
Taxes
$3,200.00
$800,000
$3,360,000
$4,896,000
$4,916,000
$1,152,000
Capacity Planning ⚫ CHAPTER 4 ⚫
4-17
Net operating income
$4,800,000
$1,200,000
$5,040,000
$7,344,000
$7,374,000
($1,728,000)
Add back depreciation
$10,000,000
$16,000,000
$9,600,000
$5,760,000
$5,710,000
$2,880,000
Total cash flow
$14,800,000
$17,200,000
$14,640,000
$13,104,000
$13,084,000
$1,152,000
Net present value
$13,214,286
$13,711,735
$10,420,463
$8,327,829
$7,424,213
$583,639
Sum of NPV
$3,682,164
b. The decision remains the same. Greater expected payoffs favor making the
investment.
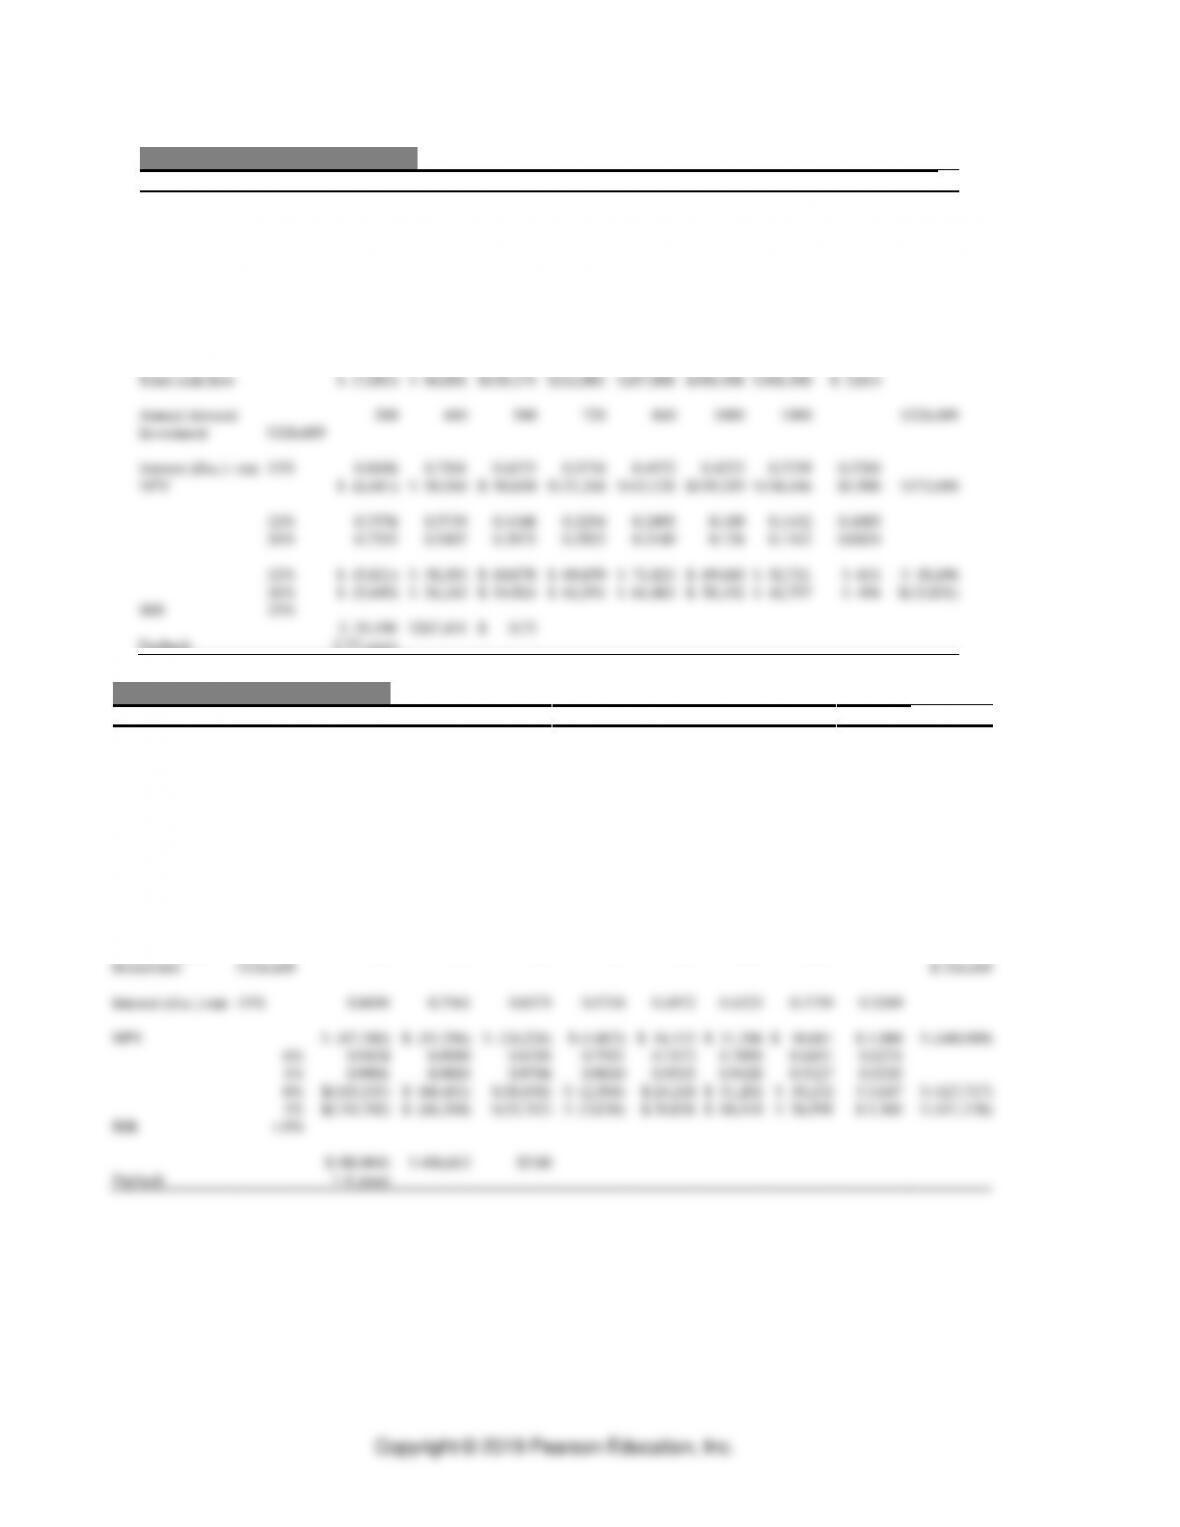
c. A decrease in the discount rate will have no effect on the decision. The
following spreadsheet shows that even at a discount rate = 12% + 15% = 27%,
the NPV remains positive.
Initial information
Initial investment
$50,000,000
Tax rate
0.40
Discount rate
0.27
MACRS depreciation
0.2000
0.3200
0.1920
0.1152
0.1142
0.0576
Present value factor
0.7874
0.6200
0.4882
0.3844
0.3027
0.2383
Year
1
2
3
4
5
6
Expected sales
$112,000,000
$112,000,000
$112,000,000
$112,000,000
$112,000,000
$0
Expenses: COGS = 70%
$78,400,000
$78,400,000
$78,400,000
$78,400,000
$78,400,000
$0
Depreciation shelter
$10,000,000
16,000,000
$9,600,000
$5,760,000
$5,710,000
$2,880,000
Pretax income
$23,600,000
$17,600,000
$24,000,000
$27,840,000
$27,890,000
($2,880,000)
Taxes
$9,440,000
$7,040,000
$9,600,000
$11,136,000
$11,156,000
($1,152,000)
Net operating income
$14,160,000
$10,560,000
$14,400,000
$16,704,000
$16,734,000
($1,728,000)
Add back depreciation
$10,000,000
$16,000,000
$9,600,000
$5,760,000
$5,710,000
$2,880,000
Total cash flow
$24,160,000
$26,560,000
$24,000,000
$22,464,000
$22,444,000
$1,152,000
Net present value
$19,023,622
$16,467,233
$11,716,559
$8,635,196
$6,793,313
$274,556
Sum of NPV
$12,910,479
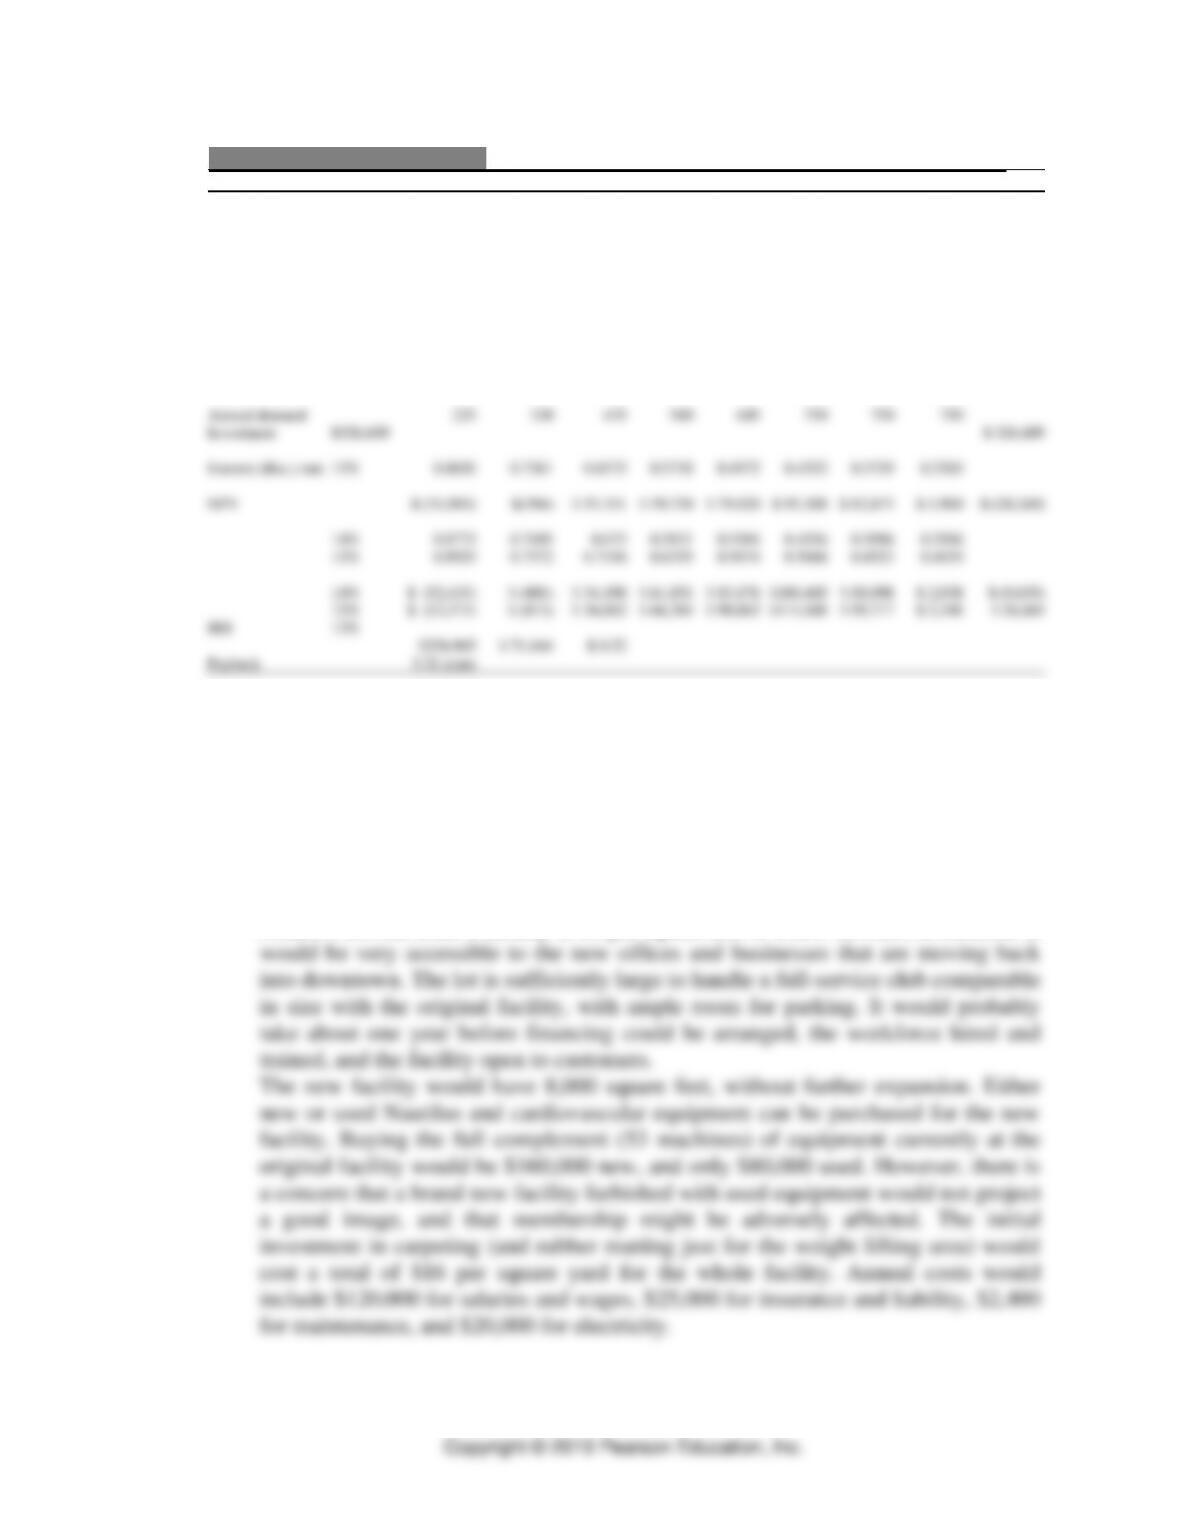
d. If we consider an additional investment of $10,000,000 in the third year,
depreciation would greatly complicate the calculations, but would not change
Initial investment
$50,000,000
Third year investment
$10,000,000
Tax rate
0.40
Discount rate
0.12
MACRS depreciation
0.3333
0.4445
0.1481
0.0741
Present value factor
0.8929
0.7972
0.7118
0.6355
0.5674
0.5066
Year
1
2
3
4
5
6
Depreciation shelter
$3,333,000
$4,445,000
$1,481,000
$741,000
Pretax income (loss)
($3,333,000)
($4,445,000)
($1,481,000)
($741,000)
Taxes
$1,333,200
($1,778,000)
($592,400)
($296,400)
Net operating income
($1,999,800)
($2,667,000)
($888,600)
($444,600)
Add back depreciation
$3,333,000
$4,445,000
$1,481,000
$741,000
Adjustment to cash flow
($8,666,800)
$1,778,000
$592,400
$296,400
Previous cash flow
$24,160,000
$26,560,000
$24,000,000
$22,464,000
$22,444,000
$1,152,000
Total cash flow
$24,160,000
$26,560,000
$15,333,200
$24,242,000
$23,036,400
$1 ,448,400
Net present value
$21,571,429
$21,173,469
$10,913,869
$15,406,229
$13,071,472
$733,805
Sum of NPV
$22,870,273

Capacity Planning ⚫ CHAPTER 4 ⚫
CASE: FITNESS PLUS (PART A) *
A. Synopsis
Fitness Plus is a full-service health, fitness, and sports club located in a growing
market. The increase in demand on its facilities brought on by a sizable growth in
membership over the past few years has led to membership’s complaints of
overcrowding of club facilities and the unavailability of equipment. As with most
service organizations, Fitness Plus experiences large shifts in demand both during
the week and within each particular day. The owners are wondering what the
existing capacity of the club is and whether it is time to think about a capacity
expansion move.
B. Purpose
The case presents the students with a set of capacity planning issues within the
context of a service organization. Data in the case provide the opportunity to
address the following issues:
1. How should capacity of the facility be measured? Is there an overall measure of
facility capacity, or is it more appropriate to look at the individual areas (work
centers) and measure their capacity? The different areas may require different
types of capacity measurement. The cardiovascular room can accommodate only
29 people and is more like a job shop where the Nautilus area is similar to an
assembly line where people flow through the equipment.
2. There is the issue of calculating capacity levels and distinguishing between
utilization of capacity at peak versus average demand levels. Toward this end,
students should address the issue of how large a capacity cushion is desired in
this service setting.
3. A major decision facing the students after the measurement issues have been
addressed is the capacity expansion issue. There is information that requires the
students to focus not only on the timing and sizing issue but also on the location
issue.
4. Finally, the students must address the competitive priorities issue as they decide
on a capacity expansion strategy. This is a long-term decision, and new
competition has entered the market. Does Fitness Plus compete by having a full–
service line of equipment, providing flexibility and quality; or is convenience
and location a major competitive factor? Also, what part does cost/price play in
attracting and retaining members?
C. Analysis
Students should begin by analyzing the capacity of the facility; however, the
analysis is not as straightforward as it first may seem. There is an issue of how
capacity should be measured. Students should quickly recognize that an overall
* This case was prepared by Dr. Brooke Saladin, Wake Forest University, as a basis for classroom
discussion.
Capacity Planning ⚫ CHAPTER 4 ⚫
4-19
aerobics. In other areas, such as the Nautilus equipment, the measure may be an
“input measure,” the number of machines available.
A second set of complicating issues deals with the impact that management policies
and assumptions have on capacity measures. In their analysis the students need to
determine how many members can be serviced in each area of the club. The number
served per hour in the cardiovascular area, for example, will depend on whether
management chooses to limit the time on each machine during peak hours of
With these issues in mind, the students can develop capacity estimates similar to the
following:
1. Aerobics
❑ Assumption: Aerobics classes begin on the hour and last for 50 minutes.
❑ Capacity: 1 class per hour for 35 members
2. Cardiovascular
❑ Assumption: During peak demand times, each piece of equipment is limited to
30 minutes per member.
❑ Capacity: With 29 pieces of C-V equipment, 58 members per hour peak
capacity
3. Nautilus

Capacity Planning ⚫ CHAPTER 4 ⚫
Tennis:
12 members/hour for singles
24 members/hour for doubles
Racquetball:
16 members/hour for singles
32 members/hour for doubles
There were no details given in the case to determine the capacity of the free-weight
area. So, if we aggregate the individual capacities into an overall measure, the club
can accommodate a peak capacity of 181 to 209 members per hour, excluding the
free-weight area—far more than the peak demand of 80 per hour. Of course, what is
important is not the aggregate demand level, but rather the demand mix and how
this mix matches the individual area capacities.
The next step in the analysis is to focus the students on estimating the demands that
are placed on the club facilities. Because this is a service being provided, the focus
should be on looking at the club’s ability to satisfy peak demand. Students should
quickly derive the following estimates of peak demand:
Arrival rate at peak
=
80 members/hour
Aerobics @ 30%
=
24 members/hour
Cardiovascular @ 40%
=
32 members/hour
Nautilus @ 25%
=
20 members/hour
Racquetball @ 15%
=
12 members/hour
Tennis @ 10%
=
8 members/hour
Free-Weights @ 20%
=
16 members/hour
These potential demand rates during the peak times indicate a number of things.
First, when compared to the area capacities calculated earlier, there seems to be
plenty of excess capacity in all areas of the club. Second, it is obvious that members
use more than one area of the club during their visits, as the total potential demand
across all areas of the club adds to 112-person hours, impossible with only 80
members arriving per hour.
capacity expansion needs to be addressed. The fact is, members are complaining,
and expected service levels are not being met. The analysis should focus on both
short-term and long-term solution alternatives and looking at the pros/cons of each.
Exhibit TN.1 gives an example of how to present this analysis. Be sure to tie the
alternatives into other operating decisions and discuss how each may impact
different competitive priorities, such as convenience and location, full-service range

Capacity Planning ⚫ CHAPTER 4 ⚫
4-21
of activities with quality facilities, availability of services in a timely manner, or
low costs/price.
D. Recommendations
When this decision case is used as an outside assignment, the instructor should be
prepared to respond to three types of recommendations:
1. No action needed: Students who compare the demand rates at peak times with
the designed capacity may conclude that there is plenty of excess capacity.
These students will not seriously consider the need for a capacity cushion, or
conclude that it is already large enough.
E. Teaching Suggestions
This case is best used as an in-class discussion case to present the issues
surrounding capacity management decisions in service organizations. If a more in–
depth discussion is desired, the case can be assigned overnight. However, the data
are not present in the case to allow a thorough analysis of the capacity expansion
issue. Students will find it difficult to address the “capacity cushion” issues.
However, if the case is used in class to introduce capacity concepts, then the
discussion can be quite good.
The class discussion should begin with determining how capacity in a service
organization should or can be measured. Make sure students understand the
importance of peak-load planning. The second stage of the discussion should flow
to the determination of demands on the service system. Once the variability in
demand across time and service areas is established and it looks as though capacity
is sufficient, the concept of “capacity cushions” should be introduced. Finally, get
the students to address the various capacity alternatives, both short and long term.
Here you can reintroduce the concept of competitive priorities and discuss how
different capacity strategies support different competitive strategies.
To fully discuss each of these four areas—capacity measurements, demand
measurements, capacity cushions, and capacity expansion alternatives—will take a
good 45 minutes, especially when the students begin to argue about different
managerial assumptions and policies that affect capacity.

Capacity Planning ⚫ CHAPTER 4 ⚫
F. Board Plan
Capacity
Demand
Expansion
Alternatives
Measures
Measures
Short
Long
+ –
+ –
G. A Note on Waiting Lines
Some students may try to apply waiting line models. Waiting line theory does not
apply very well to the Fitness Plus (A) case, because of inappropriate assumptions
and missing information. The aerobics class is a good example of inappropriate
assumptions. Most likely an aerobics class is prescheduled, and everybody arrives
at the start of the class. There is no variability on the processing rate. The time it
takes for one customer is the same that it takes to handle 35 customers
simultaneously, assuming a one hour class.
On the other hand, we might apply at least approximately waiting line analysis to an
operation such as the 29 pieces of cardiovascular equipment. We must make some
Herculean assumptions to proceed. However, let’s assume that all 29 machines are
available (no maintenance downtime), and that 32 customers will spend their time
at this operation for about 20 minutes per machine and work out on between 2 and 3
machines (say 2.5 machines on the average) during their visit. Thus the service rate
might be 3 customers per hour (20 minutes per machine). As for the arrival rate, we
could assume that a customer “enters” the system an average of 2.5 times during an
hour. If we assume 32 customers arrive to the whole operation per hour, this pace
gets translated into an arrival rate of 80 customers per hour (32 2.5), taking into
account repeat visits.
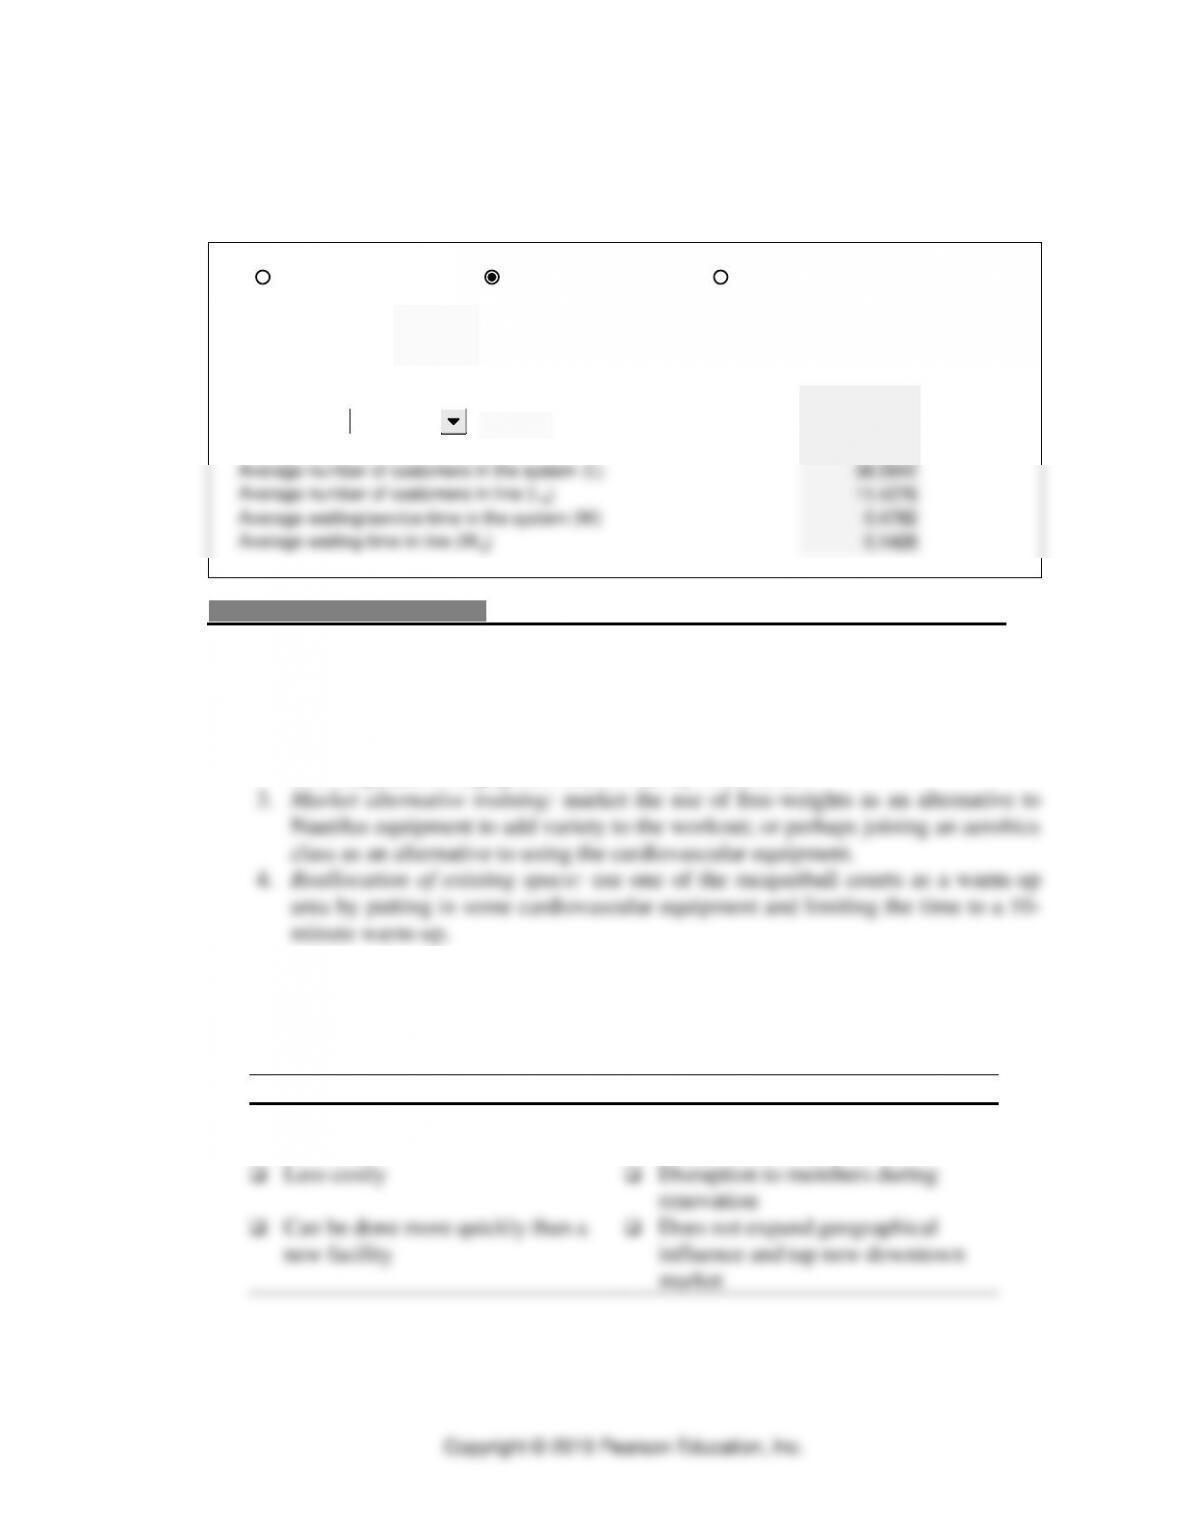
Shown below is some output from OM Explorer’s Waiting Lines Solver that
approximates this set of assumptions. Here the capacity cushion is less than 10
percent and ON EACH MACHINE the customer waits an average of 8.6 minutes to
get a machine (0.1428 x 60).
A second way to analyze the situation is to look at some of the more popular
cardiovascular machines (the real bottlenecks) and apply the single channel
approach used in the Queuing at 1st Bank Villa Italia bank video. It is still an
approximation, but should give some insight. However, customers surely will
“balk” and “renege” as shown in the video. They will move from one place to
another, depending on the lines. To capture more realism such as that, you can turn
to simulation (such as with the SimQuick package).
Of course, there is also a fourth method—actually observing the operation in peak
periods to see how the customers behave, how long the lines are, and so forth.
Interviewing customers who have complaints (the Six Sigma way) would also give
insights.
Capacity Planning ⚫ CHAPTER 4 ⚫
4-23
Inputs
Solver – Waiting Lines
Enter data in yellow shaded areas.
Servers 29
Arrival Rate (l)80
Service Rate (m)3
Probability of zero customers in the system (P0)0.0000
Probability of 4
customers in the system (Pn)0.0000
Average utilization of the server (r)0.9195
Average number of customers in the system (L) 38.0942
Average number of customers in line (Lq)11.4276
Average waiting/service time in the system (W) 0.4762
Average waiting time in line (Wq)0.1428
Single-server model
Multiple-server model
Finite-source model
at most
EXHIBIT TN.1
Capacity Expansion Alternatives
A. Short-term alternatives
1. Use of differential pricing: base on either time of the day or area of the club to
be used.
2. Time limits during peak hours: increase the use of time restrictions being placed
on or adjusted for equipment that is heavily in demand.
B. Long-term alternatives
1. Expand existing facility: this would entail both adding on to the facility where
possible and redesigning the existing space to accommodate high-demand
services.
+
–
❑ Help balance demand and service
area usage
❑ May be temporary solution to long-
term problem of growth
❑ Less costly
❑ Disruption to members during
renovation
❑ Can be done more quickly than a
new facility
❑ Does not expand geographical
influence and tap new downtown
market

Capacity Planning ⚫ CHAPTER 4 ⚫
Copyright © 2019 Pearson Education, Inc.
2. Open a new facility downtown: this is a more aggressive long-term move to
expand the market area.
+
–
❑ Is a strategic answer to a long-term issue
❑ May not help overcrowding at original
facility
❑ Open new markets when competition is
increasing at original facility
❑ More costly; take longer to bring new
capacity on line
❑ Takes longer to bring capacity on line
CASE: FITNESS PLUS (PART B) *
A. Synopsis
This sequel of Fitness Plus (A) opens up even more options for dealing with
capacity issues that are developing at the Greensboro Industrial Park. The economic
growth in the downtown area gives Fitness Plus several new options as they look to
expand. It can restructure the existing layout, expand at the current facility, or add a
new downtown location. If it locates downtown, it can have a one- or two-stage
expansion plan.
B. Purpose
Taken together with Fitness Plus (A), this case lends itself to group projects,
including written report and class presentation. It also can be used on a “cold–call”
basis, if the focus is how the students would proceed in doing the analysis, rather
than actually doing it. It draws from several concepts in the chapter, such as
capacity strategy, decision trees, utilization measures, and cushions. It is more
complex than meets the eye, in terms of capital budgeting analysis and decision
trees. Both qualitative and quantitative analyses are important. The case can be
team taught with a Finance professor to bring home the cross-functional
connections.
C. Analysis
Students should analyze the projected revenue and cost streams for the different
options, taking into account the time value of money and the different demand
scenarios. This analysis can be done with decision trees, with financial analysis
used to determine the present value of different combinations of demand forecasts
and expansion options. The OM Explorer Software offers a spreadsheet approach to
facilitate the financial analysis. Sensitivity analysis is also desirable.
D. Recommendations
A decision tree for the expansion decision is given in Exhibit TN.1, and the
associated NPV, IRR, and payback periods are provided in Exhibit TN.2.
Exhibits TN.3 through TN.8 give the detailed financial analysis for each branch in
the decision tree. These exhibits are from a student analysis and are generally well
* This case was prepared with important inputs from Maureen Campanella of Be Fit.

Capacity Planning ⚫ CHAPTER 4 ⚫
4-25
done. The decision on used versus new equipment is not shown on the decision tree,
based on the argument that used equipment should be ruled out because it might
undermine quality as a competitive priority. Fitness Plus must maintain a
professional appearance, particularly at its downtown facility. The quality of
services offered requires new equipment that has the latest product technologies. If
used equipment is not disqualified, it would look more attractive based on the
financial analysis. The overall downtown market should be closely reviewed. It may
not be economically feasible to proceed with the new club based on future
competition and trends that may influence the necessity of expanding into the
downtown market. For instance, the recent growth in exclusively outdoor activities,
such as cross-country running, Rollerblading and biking, will impact the growth in
future memberships. Other types of equipment and activities should be examined
and new programs introduced as a way to capture this diverging market. Finally, the
effect of the expansion into the downtown area could act to erode the number of
members who currently use the suburban location.
One reasonable, albeit conservative, solution is to expand to the downtown by
starting out with a small facility until forecasted demand is more certain. This
recommendation is supported by the decision tree analysis. It also makes sense
because a drop in the predicted customer membership can dramatically influence
NPV, payback, and IRR calculations. Exhibit TN.7 shows how an adjustment down
in membership numbers, such as 25 percent, can significantly affect the outcome. A
large facility would yield a $72,000 NPV, but a 25 percent drop in memberships
shows NPV at a negative $26,000.
In addition to the quantitative analysis, other factors need to be considered.
Comparisons of these numbers alone will not necessarily determine the best
alternative, and these other factors have to be weighed.
This solution must be coordinated with what is planned for the existing facility, as
discussed for the Fitness Plus (A) case. It may be possible to realign the capacity to
better serve the aerobics, cardiovascular and Nautilus areas. If this is not possible
due to the expansion in the downtown locations, several less-costly solutions are
possible, such as:
❑ Redesign the floor plan to give less room to some of the areas that are operating
well within the range of the desired capacity cushion. Economies of scale in
purchasing new equipment for downtown location. Get some more
cardiovascular equipment for the industrial park location.
❑ Promote time limits on the most popular cardiovascular equipment.
❑ Cross-train members in other fitness areas.
❑ Give price breaks if people only work out during nonpeak hours.
❑ Encourage “lunch–time” workouts for people within the industrial park.
❑ Work on the positioning of the club. With increased competition in the area,
there appears to be a marketable niche for a “family club.”
Capacity Planning ⚫ CHAPTER 4 ⚫
E. Teaching Suggestions
Address the issues in Fitness Plus (A) first, and then move into Fitness Plus (B).
Develop a decision tree on the board with class inputs, and then ask for the NPV
results for the different branches. For at least one of them, investigate the
spreadsheets that were developed. Finally, bring in the insights from sensitivity
analysis and the fit with the firm’s overall strategy.
EXHIBIT TN.1
Decision Tree
$612,375
$396,257
$396,257
Small
facility
$46,858
Large
facility
2
High
demand
[0.6]
$612,375
$409,790
$72,081
$372,090
($440,989)
Expand
Don’t expand
Low demand [0.40]
High demand [0.60]
Low demand [0.40]
EXHIBIT TN.2
Small Facility/High Demand/Expand
Year 1
Year 2
Year 3
Year 4
Year 5
Year 6
Year 7
Year 8
Year 9
Revenue
$347,280
$449,344
$583,408
$717,472
$851,536
$985,600
$985,600
$985,600
Expenses fixed
$ 64,000
$124,000
$124,000
$124,000
$124,000
$124,000
$124,000
$124,000
Expenses variable
$167,400
$267,200
$267,200
$267,200
$267,200
$267,200
$267,200
Depreciation
(7 yr MACRS)
$ 24,896
$ 64,437
$ 67,781
$ 48,406
$ 34,586
$ 29,163
$ 29,163
$ 21,357
$ 6,779
$326,568
Pretax income
$ 90,984
$ 93,507
$124,427
$277,866
$425,750
$565,237
$565,237
$573,043
$(6,779)
Taxes (40%)
$ 36,393
$ 37,403
$ 49,771
$111,147
$170,300
$226,095
$226,095
$229,217
$(2,712)
Net operating
Income
$ 54,590
$ 56,104
$ 74,656
$166,720
$255,450
$339,142
$339,142
$343,826
$(4,068)
Total cash flow
$ 79,487
$120,541
$142,437
$215,125
$290,036
$368,305
$368,305
$365,183
$2,712
Annual demand
300
440
580
720
860
1000
1000
1000
Investment
$174,222
$152,346
$326,568
Interest (disc.)
15%
0.8696
0.7561
0.6575
0.5718
0.4972
0.4323
0.3759
0.3269
0.2843
Rate
NPV
$ 69,121
$ 91,141
$ 93,652
$123,009
$144,206
$159,218
$138,446
$119,378
$771
$612,375,2
71
30%
0.7692
0.5917
0.4520
0.3501
0.2693
0.2072
0.1594
0.1226
0.0943
36%
0.7353
0.5407
0.3975
0.2923
0.2149
0.1580
0.1162
0.0854
0.0628
30%
$ 61,141
$ 71,324
$ 64,382
$ 75,315
$ 78,107
$ 76,313
$ 58,708
$ 44,771
$ 256
$356,095
36%
$ 58,446
$ 65,177
$ 56,619
$ 62,881
$ 62,329
$ 58,192
$ 42,797
$ 31,187
$ 170
$172,435
IRR
> 36%
$200,028
$126,540
$0.34
Payback
2.34 years
Capacity Planning ⚫ CHAPTER 4 ⚫
4-27
EXHIBIT TN.3
Small Facility/High Demand/Don’t Expand
Year 1
Year 2
Year 3
Year 4
Year 5
Year 6
Year 7
Year 8
Year 9
Revenue
$347,280
$449,344
$490,800
$478,800
$478,800
$478,800
$478,800
Expenses fixed
$ 64,000
$ 64,000
$ 64,000
$ 64,000
$ 64,000
$ 64,000
$ 64,000
Expenses variable
$167,400
$167,400
$167,400
$167,400
$167,400
$167,400
$167,400
Depreciation
(7 yr MACRS)
$ 24,896
$ 42,667
$ 30,471
$ 21,760
$ 15,558
$ 15,558
$ 15,558
$ 7,753
$174,222
Pretax income
$ 90,984
$175,277
$228,929
$225,640
$231,842
$231,842
$231,842
$(7,753)
Taxes (40%)
$ 36,393
$ 70,111
$ 91,571
$ 90,256
$ 92,737
$ 92,737
$ 92,737
$(3,101)
Net operating
Income
$ 54,590
$105,166
$137,357
$135,384
$139,105
$139,105
$139,105
$(4,652)
Total cash flow
$ 79,487
$147,833
$167,829
$157,144
$154,663
$154,663
$154,663
$ 3,101
Annual demand
300
400
500
500
500
500
500
500
Investment
$174,222
$174,220
Interest (disc.) rate
15%
0.8696
0.7561
0.6575
0.5718
0.4972
0.4323
0.3759
0.3269
NPV
$ 69,121
$111,777
$110,347
$ 89,855
$ 76,899
$ 66,861
$ 58,138
$ 1,014
$409,790
36%
0.7353
0.5407
0.3975
0.2923
0.2149
0.1580
0.1162
0.0854
36%
$ 58,446
$ 79,933
$ 66,712
$ 45,933
$ 33,237
$ 24,437
$ 17,972
$ 265
$152,714
IRR
> 36%
Payback
$ 79,487
$ 94,735
$ 0.61
1.61 years
EXHIBIT TN.4
Small Facility/Low Demand
Year 1
Year 2
Year 3
Year 4
Year 5
Year 6
Year 7
Year 8
Revenue (A)
$173,640
$224,672
$291,704
$358,736
$425,768
$492,800
$420,000
Expenses fixed (B)
$ 64,000
$ 64,000
$ 64,000
$ 64,000
$ 64,000
$ 64,000
$ 64,000
Expenses variable (C)
$167,400
$167,400
$167,400
$167,400
$167,400
$167,400
$167,400
Depreciation
(7 yr MACRS) (D)
$ 24,896
$ 42,667
$ 30,471
$ 21,760
$ 15,558
$ 15,558
$ 15,558
$ 7,753
$174,222
Pretax income (E)
(A-B-C-D)
$ (82,656)
$(49,395)
$ 29,833
$105,576
$178,810
$245,842
$173,042
$ (7,753)
Taxes (40%) (F)
(E x 40%)
$ (33,063)
$(19,758)
$ 11,933
$ 42,230
$ 71,524
$ 98,337
$ 69,217
$ (3,101)
Net operating
Income (G)
(E–F)
$ (49,594)
$(29,637)
$ 17,900
$ 63,345
$107,286
$147,505
$103,825
$ (4,652)
Total cash flow (H)
(D+G)
$ (24,697)
$ 13,030
$ 48,371
$ 85,106
$122,844
$163,063
$119,383
$ 3,101
Annual demand
150
220
290
360
430
500
500
500
Investment (I)
$174,222
$174,222
Interest (disc.) rate (J)
15%
0.8696
0.7561
0.6575
0.5718
0.4972
0.4323
0.3759
0.3269
NPV (K)
$ (21,477)
$ 9,852
$ 31,804
$ 48,663
$ 61,078
$ 70,492
$ 44,876
$ 1,014
$ 72,081 (N)
22%
0.8197
0.6719
0.5507
0.4514
0.3700
0.3033
0.2486
0.2038
$ (20,245)
$ 8,755
$ 26,638
$ 38,417
$ 45,452
$ 49,457
$ 29,679
$632
$4,563
IRR (L)
> 22%
$121,809.22
$52,412.78
$0.32
Payback (M)
4.32 years
(A)
(150 Members 12 months $70 monthly fee) + (150 members $200 membership fee) + Juice bar sales (1150 members 12 months 70)
(14%)
(B)
$8/sq foot 8,000 sq. feet
(C)
Salaries & wages of $120,000 + insurance & liability of $25,000 + maintenance of $2,400 + electricity of $20,000
(D)
Investment of $174,222 1st year’s depreciation percentage of 14.29%
(I)
New equipment $160,000 + carpet $14,222 ($1.77 per sq. foot 8,000 sq. feet)
(J)
Expected ROI & present value table amounts
(K)
(J) (H)
(L)
Used 22% because it was the closest % on the table that brings the investment near its IRR
(M)
Using Row H (-24,697+13,030+48,371+85,106 = 121,809.22, or 4 years) + the investment of 174,222/121,809.22 .32
(N)
Sum of row (K) less the initial investment.
Capacity Planning ⚫ CHAPTER 4 ⚫
EXHIBIT TN.5
Large Facility/High Demand
Year 1
Year 2
Year 3
Year 4
Year 5
Year 6
Year 7
Year 8
Revenue
$347,280
$449,344
$583,408
$717,472
$851,536
$985,600
$985,600
Expenses fixed
$124,000
$124,000
$124,000
$124,000
$124,000
$124,000
$124,000
Expenses variable
$267,200
$267,200
$267,200
$267,200
$267,200
$267,200
$267,200
Depreciation
(7 yr MACRS)
$ 46,672
$ 79,987
$ 57,124
$ 40,793
$ 29,166
$ 29,166
$ 29,166
$ 14,534
$326,609
Pretax income
$(90,592)
$(21,843)
$135,084
$285,479
$431,170
$565,234
$565,234
$(14,534)
Taxes (40%)
$(36,237)
$ (8,737)
$ 54,034
$114,191
$172,468
$226,094
$226,094
$ (5,814)
Net operating
Income
$(54,355)
$(13,106)
$ 81,050
$171,287
$258,702
$339,140
$339,140
$ (8,720)
Total cash flow
$ (7,683)
$ 66,881
$138,174
$212,081
$287,868
$368,306
$368,306
$ 5,814
Annual demand
300
440
580
720
860
1000
1000
$326,609
Investment
$326,609
Interest (disc.) rate
15%
0.8696
0.7561
0.6575
0.5718
0.4972
0.4323
0.3759
0.3269
NPV
$ (6,681)
$ 50,569
$ 90,850
$121,268
$143,128
$159,219
$138,446
$1,900
$372,090
32%
0.7576
0.5739
0.4348
0.3294
0.2495
0.189
0.1432
0.1085
36%
0.7353
0.5407
0.3975
0.2923
0.2149
0.158
0.1162
0.0854
32%
$ (5,821)
$ 38,383
$ 60,078
$ 69,859
$ 71,823
$ 69,610
$ 52,721
$ 631
$ 30,696
36%
$ (5,649)
$ 36,163
$ 54,924
$ 61,991
$ 61,863
$ 58,192
$ 42,797
$ 496
$(15,831)
IRR
35%
$ 59,198
$267,411
$ 0.73
Payback
2.73 years
EXHIBIT TN.6
Large Facility/Low Demand
Year 1
Year 2
Year 3
Year 4
Year 5
Year 6
Year 7
Year 8
Revenue
$173,640
$224,672
$291,704
$358,736
$425,768
$492,800
$420,000
Expenses fixed
$124,000
$124,000
$124,000
$124,000
$124,000
$124,000
$124,000
Expenses variable
$267,200
$267,200
$267,200
$267,200
$267,200
$267,200
$267,200
Depreciation
(7 yr MACRS)
$ 46,672
$ 79,987
$ 57,124
$ 40,793
$ 29,166
$ 29,166
$ 29,166
$ 14,534
$ 326,609
Pretax income
$(264,232)
$(246,515)
$(156,620)
$ (73,527)
$ 5,402
$ 72,434
$(366)
$(14,534)
Taxes (40%)
$(105,693)
$ (98,606)
$ (62,648)
$ (29,303)
$ 2,161
$ 28,974
$(146)
$ (5,814)
Net operating
Income
$(158,539)
$(147,909)
$ (93,972)
$ (43,954)
$ 3,241
$ 43,460
$(220)
$ (8,720)
Total cash flow
$(111,867)
$ (67,922)
$ (36,848)
$ (3,161)
$ 32,407
$ 72,626
$ 28,946
$ 5,814
Annual demand
300
440
580
720
860
1000
1000
Investment
$326,609
$ 326,609
Interest (disc.) rate
15%
0.8696
0.7561
0.6575
0.5718
0.4972
0.4323
0.3759
0.3269
NPV
$ (97,280)
$ (51,356)
$ (24,228)
$ (1,807)
$ 16,113
$ 31,396
$ 10,881
$ 1,900
$ (440,989)
6%
0.9434
0.8900
0.8396
0.7921
0.7473
0.7050
0.6651
0.6274
1%
0.9901
0.9803
0.9706
0.9610
0.9515
0.9420
0.9327
0.9235
6%
$(105,535)
$ (60,451)
$(30,938)
$ (2,504)
$ 24,218
$ 51,202
$ 19,252
$ 3,647
$ (427,717)
1%
$(110,760)
$ (66,584)
$(35,765)
$ (3,038)
$ 30,836
$ 68,414
$ 26,998
$ 5,369
$ (411,138)
IRR
< 0%
$ (80,004)
$ 406,613
$5.60
Payback
> 8 years
Capacity Planning ⚫ CHAPTER 4 ⚫
4-29
EXHIBIT TN.7
Large Facility/25% Demand Decrease
Year 1
Year 2
Year 3
Year 4
Year 5
Year 6
Year 7
Year 8
Revenue
$260,460
$337,008
$ 437,556
$538,104
$638,652
$739,200
$739,200
Expenses fixed
$124,000
$124,000
$124,000
$124,000
$124,000
$124,000
Expenses variable
$267,200
$267,200
$ 267,200
$267,200
$267,200
$267,200
$267,200
Depreciation
(7 yr MACRS)
$ 46,672
$ 79,987
$ 57,124
$ 40,793
$ 29,166
$ 29,166
$ 29,166
$ 14,534
$ 326,609
Pretax income
$(177,412)
$(134,179)
$ (10,768)
$106,111
$218,286
$318,834
$318,834
$(14,534)
Taxes (40%)
$ (70,965)
$ (53,671)
$(4,307)
$ 42,444
$ 87,314
$127,534
$127,534
$ (5,814)
Net operating
Income
$(106,447)
$ (80,507)
$(6,461)
$ 63,666
$130,971
$191,300
$191,300
$ (8,720)
Total cash flow
$ (59,775)
$(521)
$50,663
$104,460
$160,138
$220,466
$220,466
$ 5,814
Annual demand
225
330
435
540
645
750
750
750
Investment
$326,609
$ 326,609
Interest (disc.) rate
15%
0.8696
0.7561
0.6575
0.5718
0.4972
0.4323
0.3759
0.3269
NPV
$ (51,980)
$(394)
$ 33,311
$ 59,730
$ 79,620
$ 95,308
$ 82,873
$ 1,900
$ (28,240)
14%
0.8772
0.7695
0.675
0.5921
0.5194
0.4556
0.3996
0.3506
12%
0.8929
0.7972
0.7118
0.6355
0.5674
0.5066
0.4523
0.4039
14%
$ (52,435)
$ (401)
$ 34,198
$ 61,851
$ 83,176
$100,445
$ 88,098
$ 2,038
$ (9,639)
12%
$ (53,373)
$ (415)
$ 36,062
$ 66,384
$ 90,862
$111,688
$ 99,717
$ 2,348
$ 26,665
IRR
13%
$254,965
$ 71,644
$ 0.32
Payback
5.32 years
Fitness Plus is thoroughly investigating the option of opening a new facility
downtown. Doing so would be an aggressive capacity expansion strategy, opening
up new markets when competition is increasing at the original facility. This strategy
would enable Fitness Plus to expand its market area, but may not help the
overcrowding at the current facility. There are several uncertainties as to future
costs, customer demands, and strategies of competitors. It also will take some time
to bring the new capacity on line. However, the resurgence in activity downtown
makes this option worth more careful analysis.
Fitness Plus can lease a facility at $8 per square feet at a new downtown location. It

Capacity Planning ⚫ CHAPTER 4 ⚫
The facility should attract customers from a 6-mile radius. Membership fees would
be $70 per month, with an additional $200 initiation fee in the first year. A juice bar
and tanning beds can be added to bring in additional revenues. The juice bar can
generate an added 14% of sales, and tanning beds can add another 1% of sales. A
tanning bed costs around $5000 with a payback of just one year.
Demand for the new facility can be low or high. If low, there would be 150
members in the first year of operation, and grow until reaching a 500-member
plateau in the 6th year. This level is the largest the leased facility can currently
handle. If demand for the new facility is high, the membership would be 300 in the
first year and could increase to 1000 in the 6th year (assuming sufficient capacity).
If demand turns out to be this high, Fitness Plus has the option of having the leased
facility expanded to 14,000 square feet. This expansion would accommodate a
1000-person membership. If expansion occurs before the facility is opened, the