
Chapter
4 Capacity Planning
TEACHING TIP
Introduce with Tesla Corporation.
• What was the problem?
• How did they solve the problem?
1. Capacity is the maximum rate of output of a process or a system.
2. Accounting needs to provide cost information needed to evaluate expansion decisions.
3. Finance performs the financial analysis of the proposed capacity expansion decision
investments and raises funds to support them.
4. Marketing provides demand forecasts needed to indentify capacity gaps.
5. Management information systems designs the electronic infrastructure that is needed to make
data such as cost information, financial performance measures, demand forecasts, and work
standards available to those needing it to analyze capacity options.
1. Planning Long-Time Capacity
1. Long-term capacity planning
a. Deals with investment in new facilities and equipment
b. Plans cover a minimum of two years into the future
c. When choosing a capacity strategy, managers must consider questions such as the
following
• How much of a cushion is needed to handle variable or uncertain demand?
• Should we expand capacity ahead of demand, or wait until demand is more certain?
2. Measures of capacity and utilization
a. Output measures of capacity
• are best utilized when applied to individual processes within the firm
• when the firm provides a relatively small number of standardized services and
products
b. Input measures of capacity
• Generally used in low-volume, flexible processes
c. Utilization
• The degree to which equipment, space, or workforce is currently being used.
• Expressed as a percentage:
Utilization = Average output rate
Maximum capacity ´100%
• The average output rate and the capacity must be measured in the same
terms.
3. Economies of scale
a. Occur when the average unit cost of a service or good can be reduced by
increasing its output rate.
b. Four principle reasons
• Spreading fixed costs
• Reducing construction costs
• Cutting costs of purchased materials
• Finding process advantages
4. Diseconomies of scale
2. Capacity Timing and Sizing Strategies
Three dimensions to capacity strategy: sizing capacity cushion, timing and sizing
expansions, and linking process capability and other operating decisions.
1. Sizing capacity cushions
a. Average utilization rates for any resource should not get close to 100 percent
over the long term
b. When average utilization rates approach 100% it is usually a signal
• Need to increase capacity
• Decrease order acceptance to avoid poor customer service or declining productivity
c. Appropriate size varies by industry
Copyright © 2019 Pearson Education, Inc.
TEACHING TIP
Simulation and waiting-line analysis can help managers better anticipate the relationship
between capacity cushion and customer service. See Supplement E, “Simulation,” and
Supplement B, “Waiting Lines.”
• Factors Leading to Large Capacity Cushions
When demand is variable, uncertain, or product mix changes
2. Timing and sizing expansion
a. Expansionist strategy
• Economies of scale may reduce fixed cost per unit
• Might increase the firm’s market share or act as a form of preemptive marketing
b. Wait-and-see strategy
3. Linking process capacity and other decisions
a. Competitive priorities
b. Quality
c. Process design
3. A Systematic Approach to Long-Term Capacity Decisions
1. Step 1: Estimate capacity requirements
a. Begin with a forecast of demand, productivity, competition, and technological change for
several periods in a time horizon.
b. Long-range forecast errors will be large.
Copyright © 2019 Pearson Education, Inc.
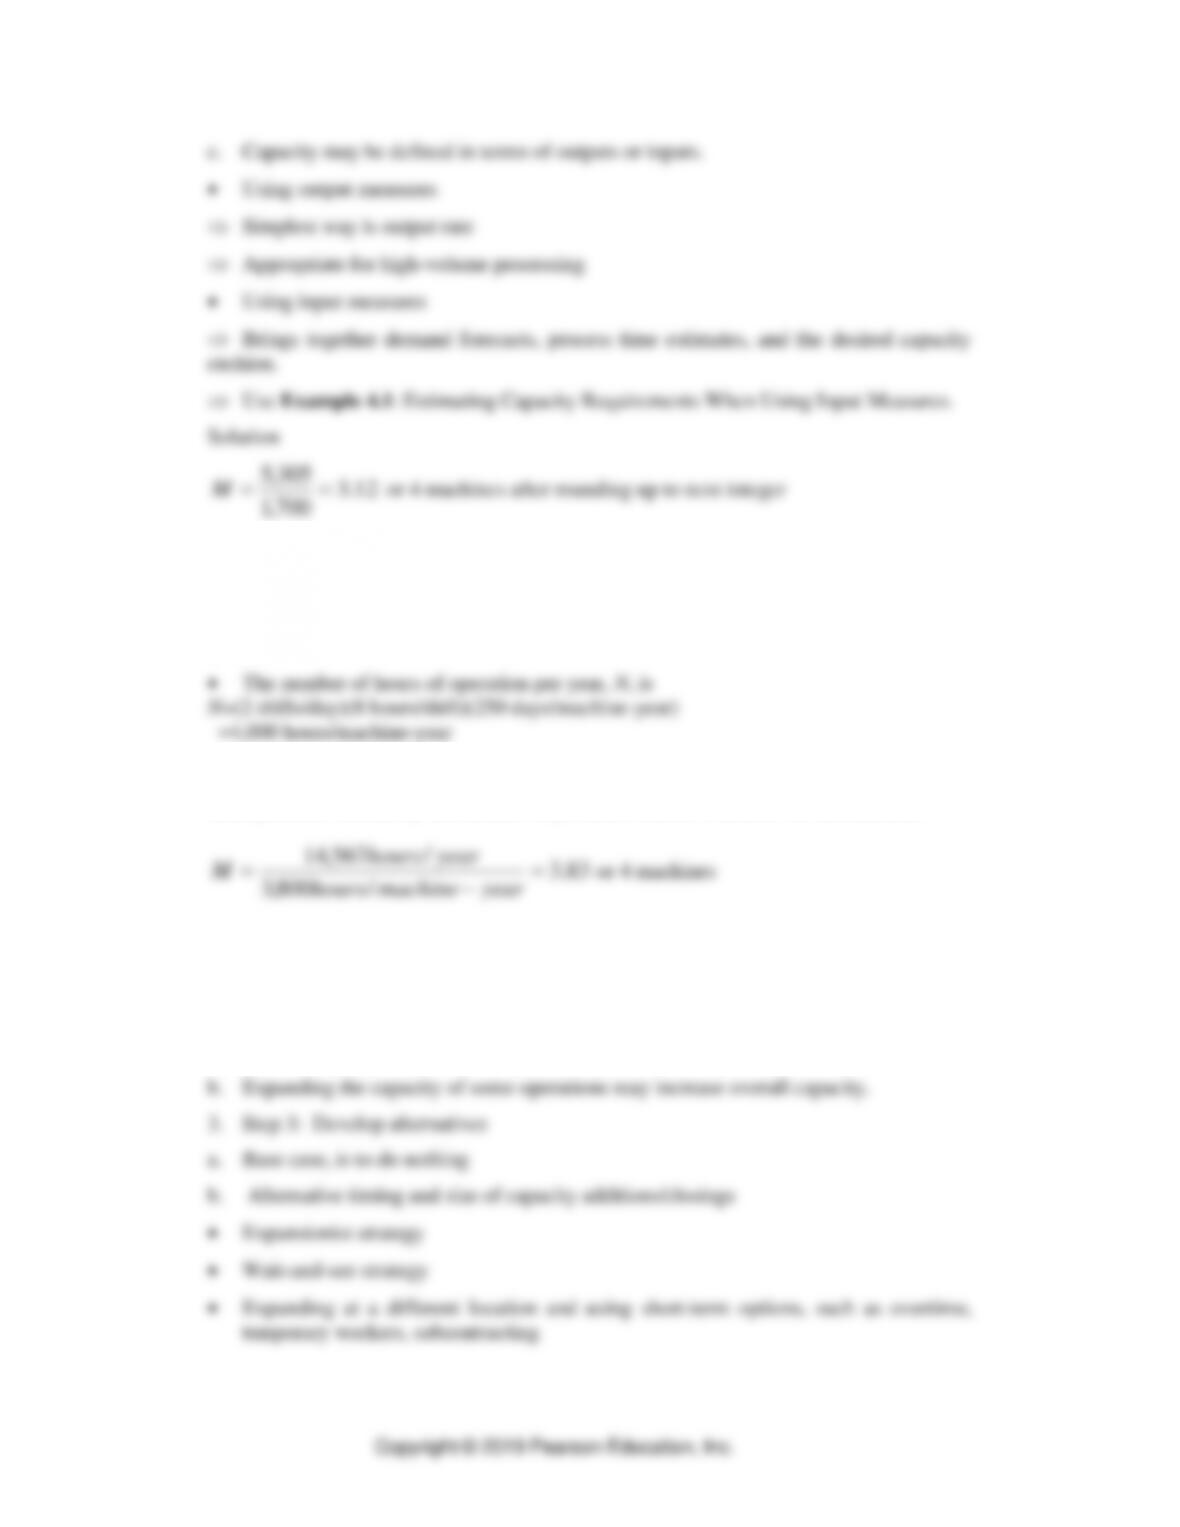
c. Capacity may be defined in terms of outputs or inputs.
• Using output measures
Simplest way is output rate
Appropriate for high-volume processing
• Using input measures
Brings together demand forecasts, process time estimates, and the desired capacity
cushion.
Use Example 4.1: Estimating Capacity Requirements When Using Input Measures.
Solution
12.3
700,1
305,5 ==M
or 4 machines after rounding up to next integer
Tutor 4.1 in MyLab Operations Management provides a new example to practice
calculating capacity requirements when using input measures.
d. Use Application 4.1: Surefoot Sandal Company (this is solved problem 1).
Solution
The number of machines required, M, is the sum of machine-hour requirements for all
three products divided by the number of productive hours available for one machine.
/800,3
−
• The capacity gap is 1.83 machines (3.83-2). Two more machines should be
purchased, unless management decides to use short-term options to fill gaps.
2. Step 2: Identify gaps
a. This is the difference (positive or negative) between projected capacity requirement
and current capacity.
• Reducing capacity include the closing of plants or warehouses, laying off employees,
or reducing the days or hours of operation
c. Use Example 4.2: Grandmother’s Chicken Restaurant
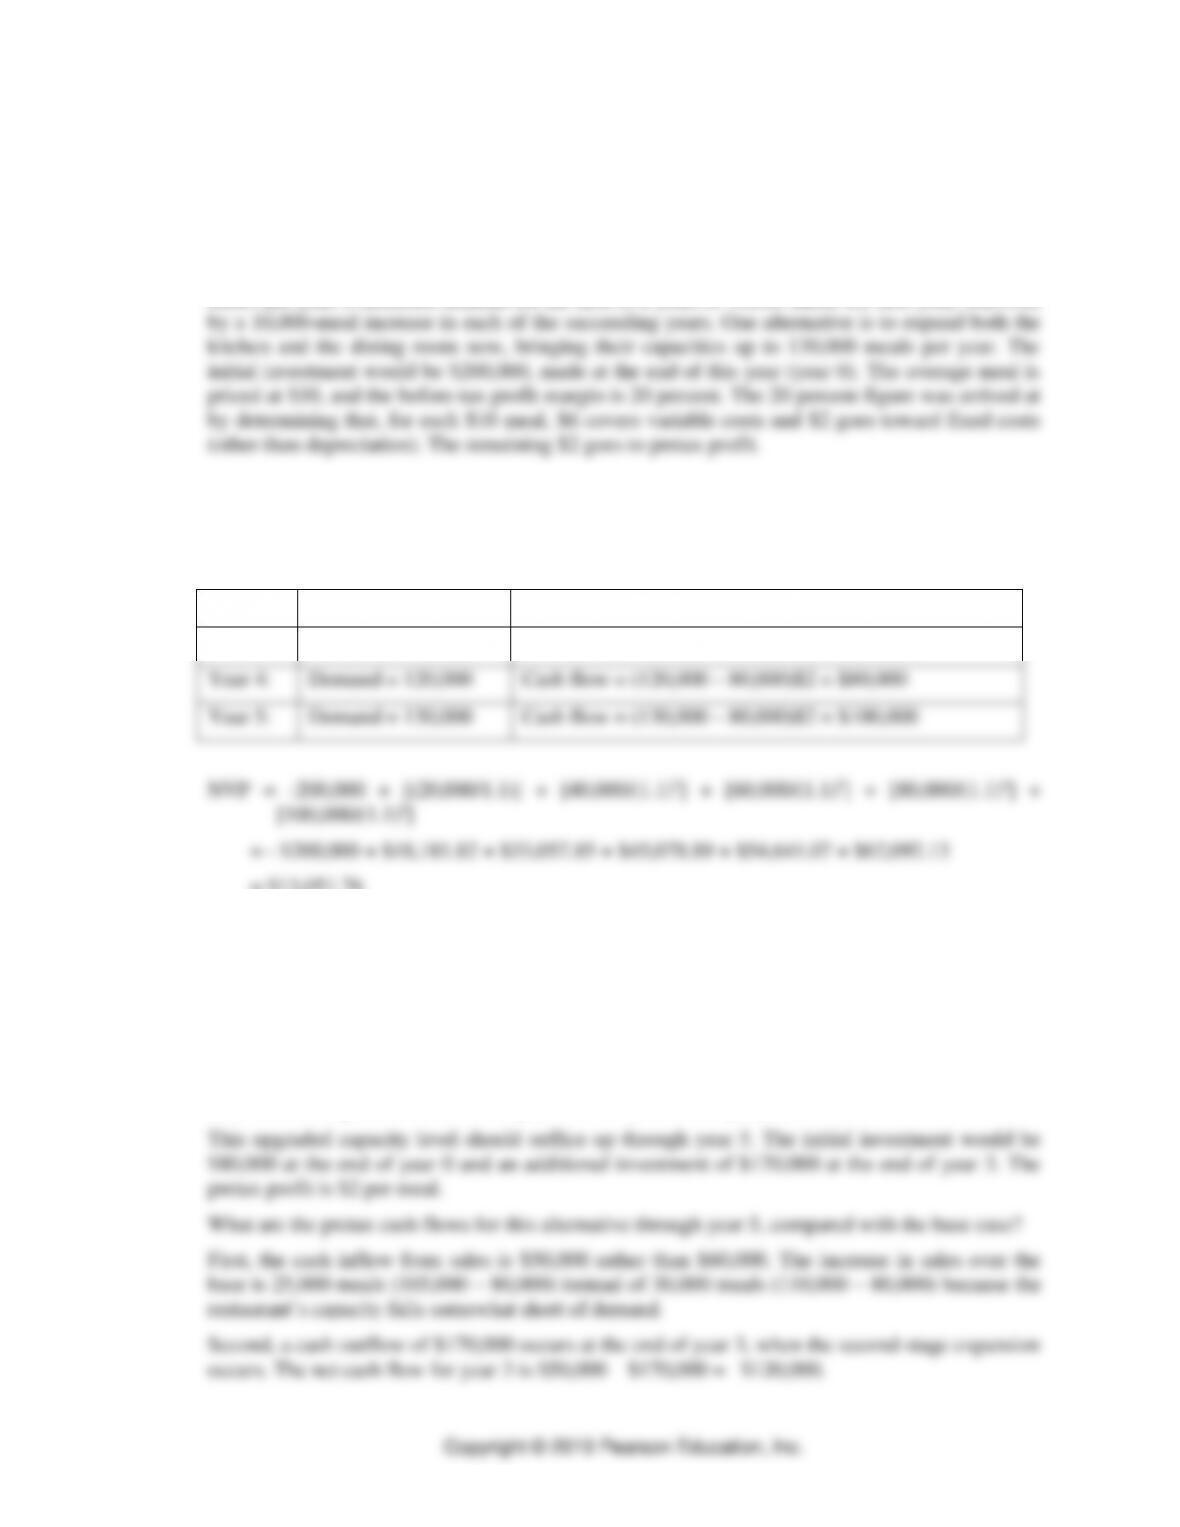
Grandmother’s Chicken Restaurant expects to serve a total of 80,000 meals this year. Although
the kitchen is operating at 100 percent capacity, the dining room can handle a total of 105,000
diners per year. Forecasted demand for the next five years is 90,000 meals for next year, followed
What are the pretax cash flows from this project for the next five years compared to those of the
base case of doing nothing?
Solution
Year 2:
Demand = 100,000
Cash flow = (100,000 – 80,000)$2 = $40,000
Year 3:
Demand = 110,000
Cash flow = (110,000 – 80,000)$2 = $60,000
Year 4:
Demand = 120,000
Cash flow = (120,000 – 80,000)$2 = $80,000
Year 5:
Demand = 130,000
Cash flow = (130,000 – 80,000)$2 = $100,000
= $13,051.76
d. Use Application 4.2: Grandmother’s Chicken Restaurant 2-Stage Expansion (note:
this is solved problem 2)
This alternative expands the kitchen at the end of year 0, raising its capacity from 80,000 meals
per year to that of the dining area (105,000 meals per year).
If sales in year 1 and 2 live up to expectations, the capacities of both the kitchen and the dining
room will be expanded at the end of year 3 to 130,000 meals per year.
For comparison purposes, the NPV of this project at a discount rate of 10% is calculated
as shown below, and equals negative $ 2,184.90.
On a purely monetary basis, a single stage expansion seems to be a better alternative than
this two-stage expansion. However, other qualitative factors as mentioned earlier must
be considered as well.
4. Step 4: Evaluate the Alternatives
a. Qualitative concerns
• Cash flows
• Tutor 4.2 in MyLab Operations Management provides a new example to practice
projecting cash flows for capacity decisions.
4. Tools for Capacity Planning
1. Waiting-line models
Variable processing or service times
TEACHING TIP
Relate to Supplement B, “Waiting Lines, for problems.
2. Simulation
a. Useful for more complex waiting-line problems
b. Can identify process bottlenecks and appropriate capacity cushions
TEACHING TIP
Relate to Supplement E, “Simulation,” for problems.
3. Decision trees
a. Can be applied to a wide range of decisions
b. Valuable for capacity decisions when demand is uncertain and when sequential
decisions are involved.

TEACHING TIP
Relate to Supplement A, “Decision Making,” for problems. Also, use Managerial Practice
4.1 which illustrates the use of capacity planning at PacifiCorp.