
Chapter
3 Quality and Performance
Why should process performance and quality be everyone’s concern?
1. Costs of Quality
1. Define a defect.
2. Four major categories of costs are associated with process performance gaps
a.
b.
c.
d.
3. What are ethical considerations?
4. Three elements of a deceptive practice
a.
b.
c.
2. Total Quality Management and Six Sigma
Define total quality management (TQM)

1. Describe the three principles for achieving high levels of process quality and performance.
a.
b.
c.
2. Customer satisfaction (internal or external): when customers’ expectations have been met or
exceeded. Define the following categories
a. Conformance to specifications:
b. Value:
c. Fitness for use:
d. Support:
e. Psychological impressions:
3. Continuous Improvement
a. Define kaizen
b. Steps to getting started include
•
•
•
•
•
c. Problem-solving process: The Deming Wheel
• Describe the problem-solving process known as The Deming Wheel
4. Six Sigma
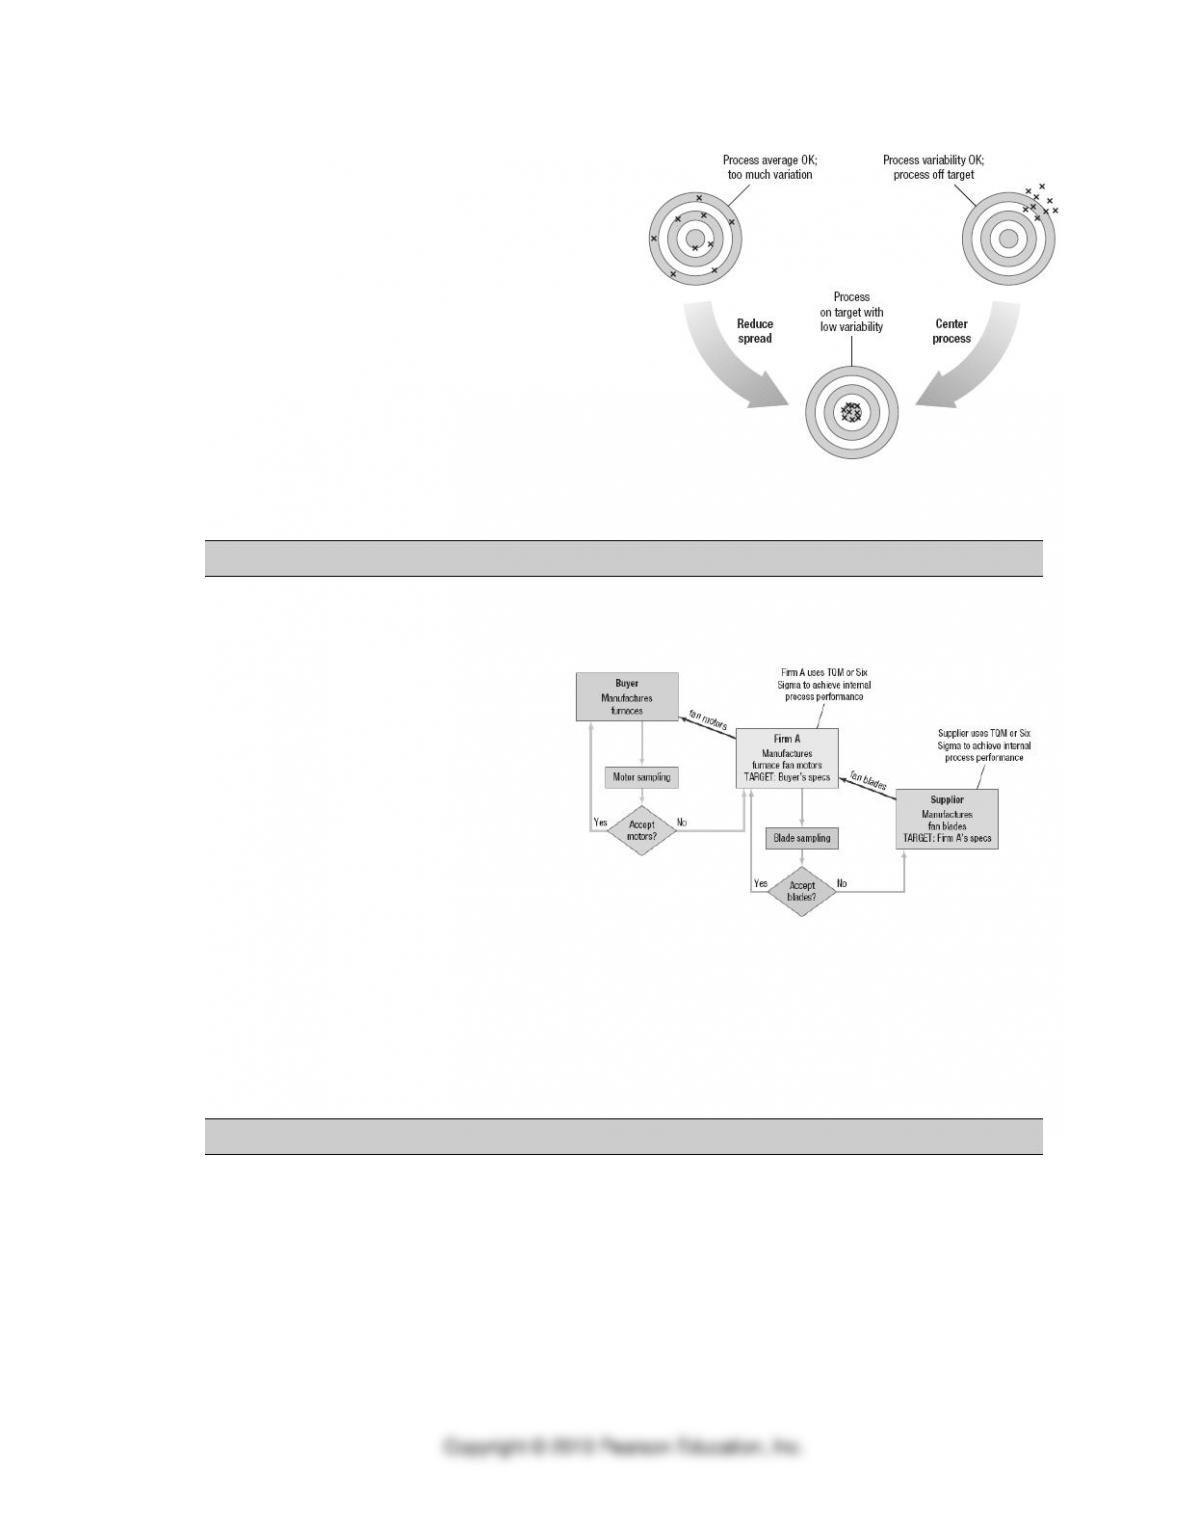
a. Define Six Sigma
3. Acceptance Sampling
Define acceptance sampling and how is it used in a supply chain
What is AQL?
4. Statistical Process Control
Define SPC and how is it used
1. Variation of outputs
a. Performance measurements
• Variables
• Attributes
b. Sampling
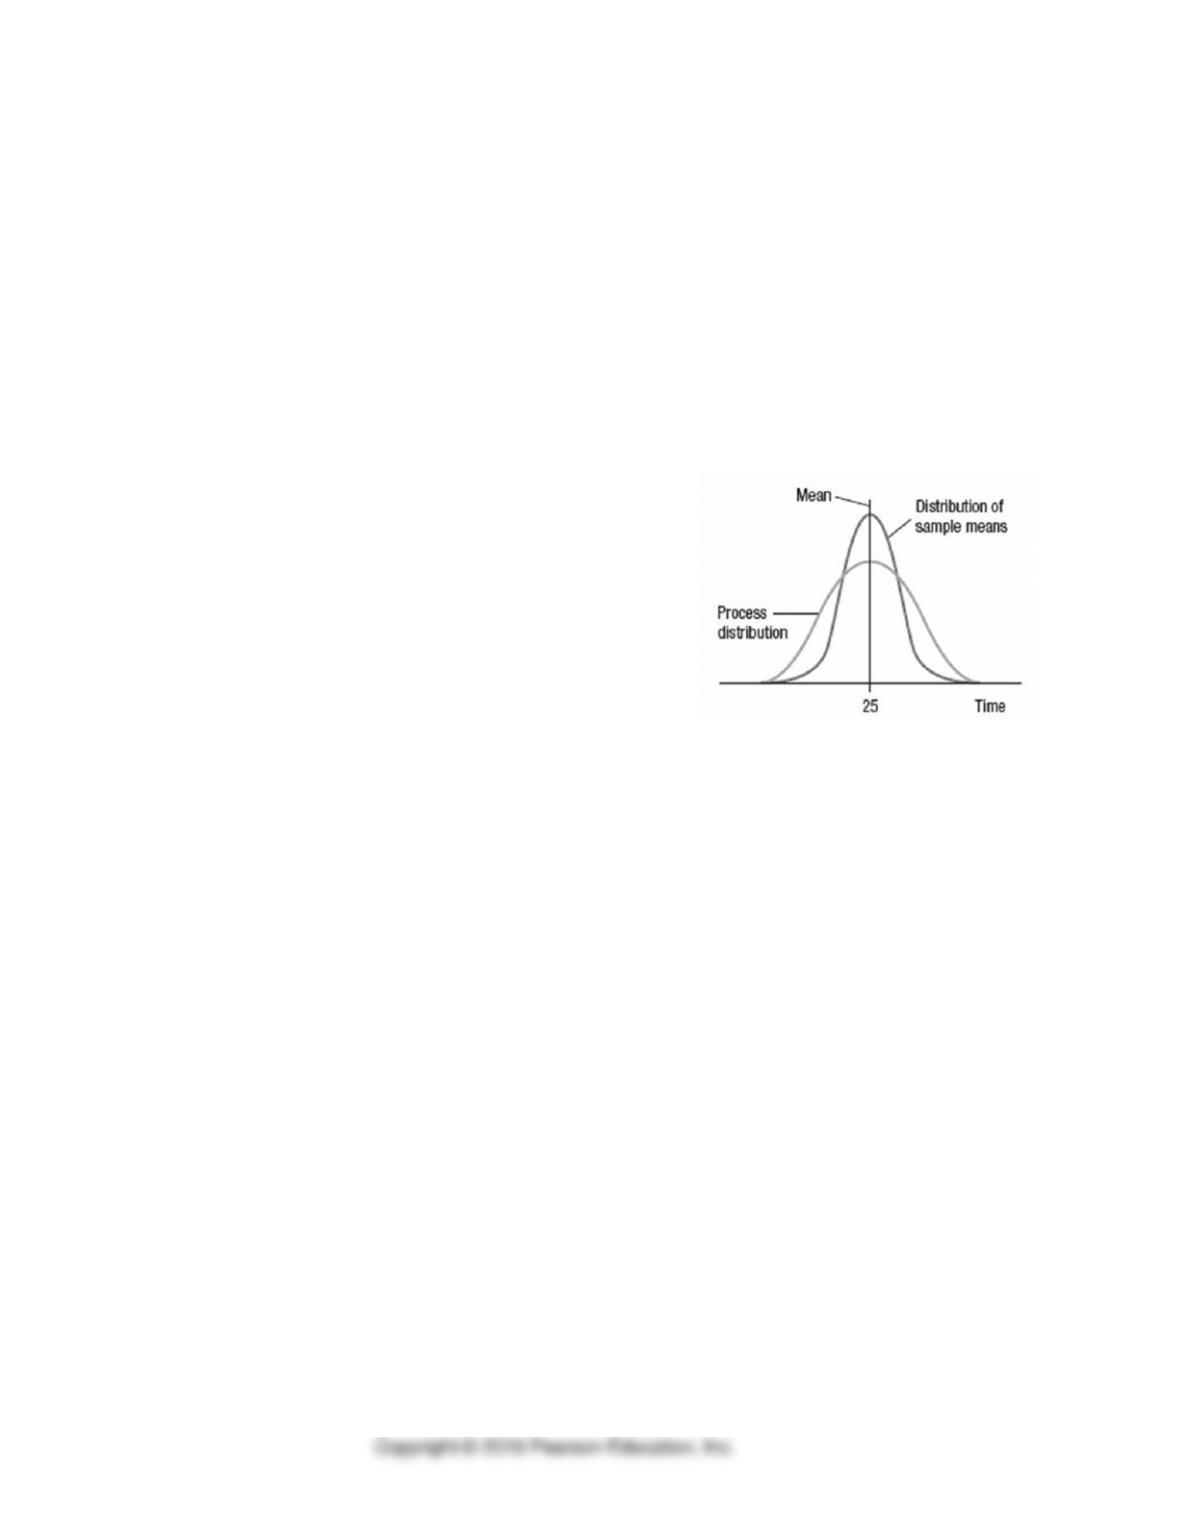
c. Sampling distributions
d. Common causes
e. Assignable causes
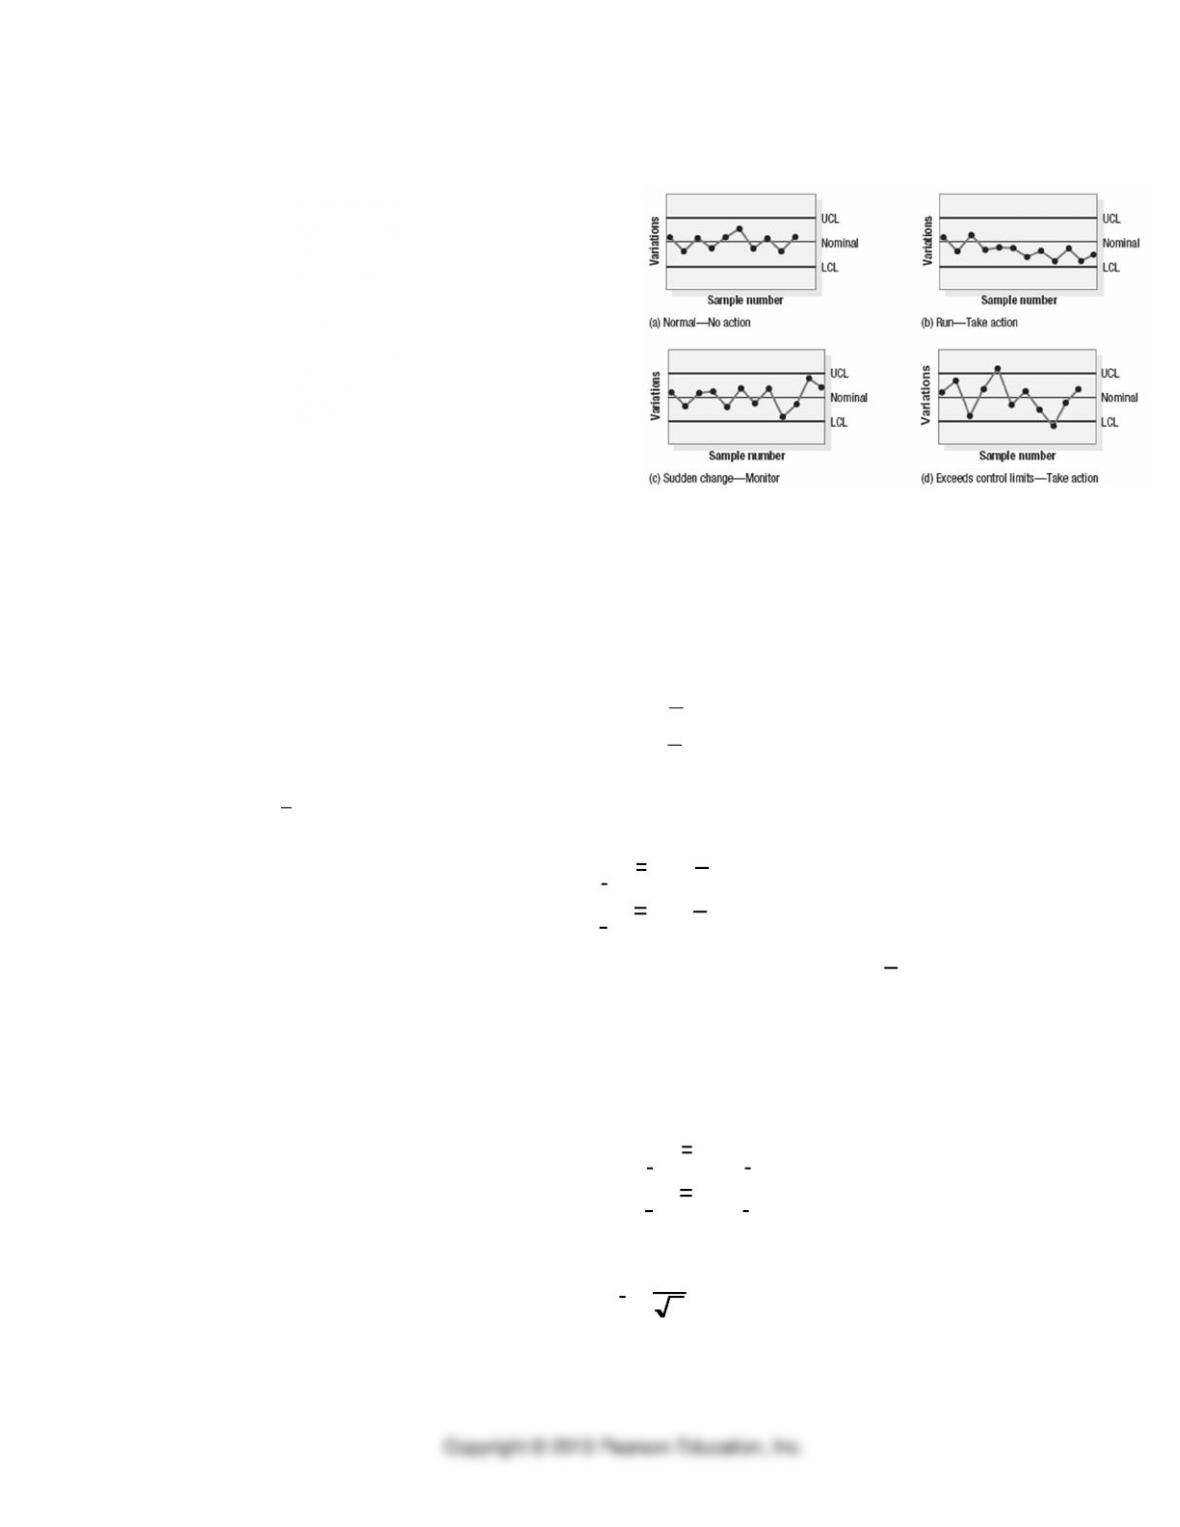
2. Control charts
a. What is a control chart?
b. Describe UCL, LCL, and nominal value.
c. Steps for using a control chart:
1.
2.
3.
4.
d. How do control limits relate to the sampling distribution?
e. Indicators of out of control conditions
f. Two types of errors
3. Control charts for variables used to monitor the mean and the variability of the process
distribution
a. R-charts (also known as range charts)
RDLCL
RDUCL
R
R
3
4
=
=
b.
x
-charts
UCLx =x+A2R
LCLx =x–A2R
Use Table 3.1 to find A2, which when multiplied by the previously determined
R
, places UCL
and LCL three standard deviations above and below the mean respectively.
c. Using the process standard deviation
UCLx =x+z
s
x
LCLx =x–z
s
x
where
s
x =
s
n
• Application 3.1: Control Charts for Variables

Webster Chemical Company is concerned whether the filling process for tubes of caulking is
in statistical control. The process should be centered on 8 ounces per tube. Several samples of
eight tubes are taken and each tube is weighed in ounces.
Assuming that taking only 6 samples is sufficient, is the process in statistical control?
Conclusion on process variability:
== RDUCLR4
== RDLCLR3
Consider dropping sample 6 because of an inoperative scale, causing inaccurate measures.
What is the conclusion on process variability and process average?
==== RDLCLRDUCL RR 34
=−==+= RAxLCLRAxUCL xx 22
Tube Number
Sample
1
2
3
4
5
6
7
8
Avg
Range
1
7.98
8.34
8.02
7.94
8.44
7.68
7.81
8.11
2
8.23
8.12
7.98
8.41
8.31
8.18
7.99
8.06
3
7.89
7.77
7.91
8.04
8.00
7.89
7.93
8.09
4
8.24
8.18
7.83
8.05
7.90
8.16
7.97
8.07
5
7.87
8.13
7.92
7.99
8.10
7.81
8.14
7.88
6
8.13
8.14
8.11
8.13
8.14
8.12
8.13
8.14
Avgs
Tube Number
Sample
1
2
3
4
5
6
7
8
Avg
Range
1
7.98
8.34
8.02
7.94
8.44
7.68
7.81
8.11
2
8.23
8.12
7.98
8.41
8.31
8.18
7.99
8.06
3
7.89
7.77
7.91
8.04
8.00
7.89
7.93
8.09
4
8.24
8.18
7.83
8.05
7.90
8.16
7.97
8.07
5
7.87
8.13
7.92
7.99
8.10
7.81
8.14
7.88
Avgs

4. Control charts for attributes
a. p-chart — population proportion defective
UCLp=p +z
s
p
LCLp=p –z
s
p
where
s
p=p 1–p
( )
n
• Steps for using p-Charts:
1.
2.
3.
4.
• Application 3.2: p-Chart for Attributes
A sticky scale brings Webster’s attention to whether caulking tubes are being properly
capped. If a significant proportion of the tubes aren’t being sealed, Webster is placing their
customers in a messy situation. Tubes are packaged in large boxes of 144. Several boxes are
inspected and the following numbers of leaking tubes are found:
Sample
Tubes
Sample
Tubes
Sample
Tubes
1
3
8
6
15
5
2
5
9
4
16
0
3
3
10
9
17
2
4
4
11
2
18
6
5
2
12
6
19
2
6
4
13
5
20
1
7
2
14
1
Total =
72
Calculate the p-chart three-sigma control limits to assess whether the capping process is in
statistical control.
== tubesofnumberTotal
tubesleakyofnumberTotal
p

( )
=
−
=n
pp
p
1
=+= pp zpUCL
=−= pp zpLCL
Conclusion
b. c-chart — more than one defect per unit
UCLc=c +z
s
c
LCLc=c –z
s
c
where
s
c=c
• Application 3.3: c-Chart for Attributes
At Webster Chemical, lumps in the caulking compound could cause difficulties in dispensing
a smooth bead from the tube. Even when the process is in control, there will still be an
average of 4 lumps per tube of caulk. Testing for the presence of lumps destroys the product,
so Webster takes random samples. The following are results of the study:
Tube #
Lumps
Tube #
Lumps
Tube #
Lumps
1
6
5
6
9
5
2
5
6
4
10
0
3
0
7
1
11
9
4
4
8
6
12
2
Determine the c–chart two-sigma upper and lower control limits for this process.
=c
=
c
=+= cc zcUCL
=−= cc zcLCL
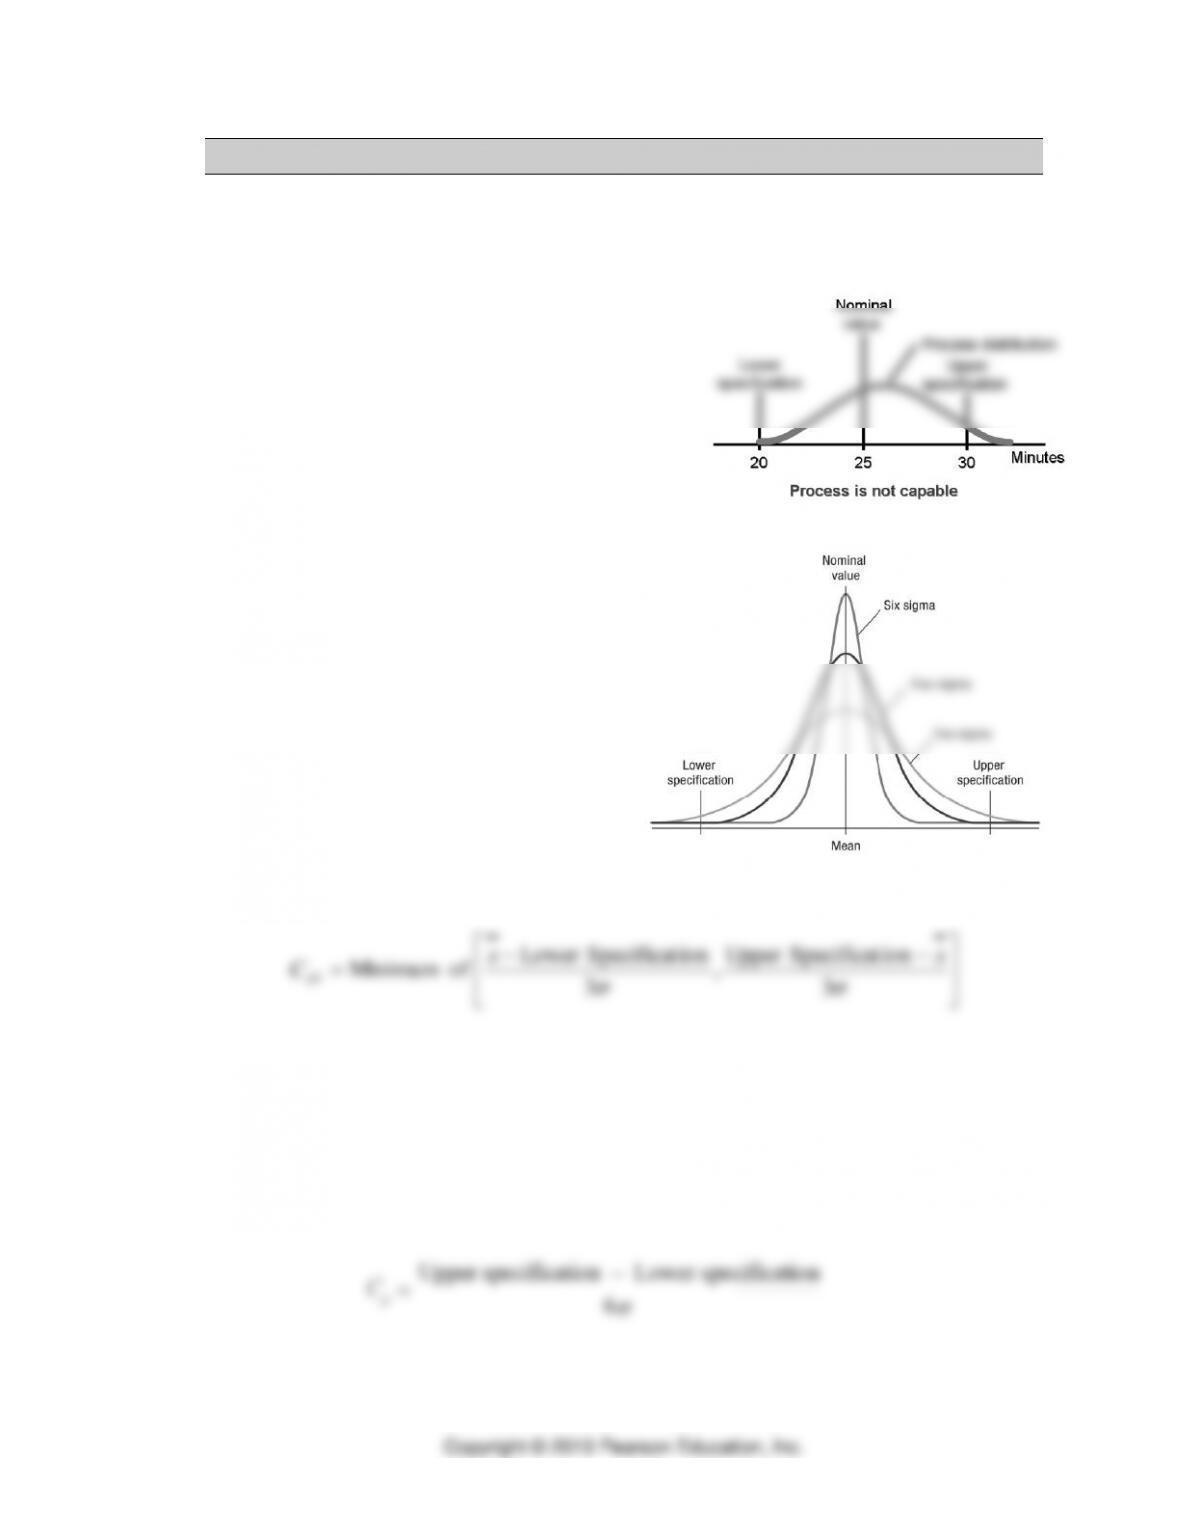
5. Process Capability
1. Defining process capability
Relationship between a process distribution and specifications
Effects of reducing variability on process capability
a. Process capability index
−−
=
3
ionSpecificatUpper
,
3
ionSpecificatLower
ofMinimum xx
Cpk
b. Process capability ratio
C
p
=
Upper specification
–
Lower specification
6

2. Using continuous improvement to determine the capability of a process (4 steps)
a. Step 1
b. Step 2
c. Step 3
d. Step 4
3. Application 3.4: Process Capability Analysis
Webster Chemical’s nominal weight for filling tubes of caulk is 8.00 ounces ± 0.60 ounces.
The target process capability ratio is 1.33 for four-sigma performance. . The current
distribution of the filling process is centered on 8.054 ounces with a standard deviation of
0.192 ounces. Compute the process capability index and process capability ratio (if
necessary) to assess whether the filling process is capable and set properly.
a. Process capability index:
=
−−
=
3
,
3
min xionspecificatupperionspecificatlowerx
Cpk
• What can be concluded?
• Why?
b. Process capability ratio:
=
−
=
6
ionspecificatlowerionspecificatupper
Cp
• What can be concluded?
• Why?
6. International Quality Documentation Standards and Awards
1. ISO 9001:2008 documentation standards
2. Benefits of ISO Certification
3. Malcolm Baldrige Performance Excellence Program
a. Seven criteria
• Leadership
• Strategic Planning
7. Systems Approach to Total Quality Management
1. Systems Approach to TQM
a. Four Pillars
• Continuous Improvement
b. Managing Intersections of Pillars is Key

Copyright © 2016 Pearson Education, Inc.
• Planning (continuous improvement and management commitment & leadership)
• Empowerment (continuous improvement and employee involvement)
• Management by Fact (management commitment & leadership and analytical process
thinking)
• Training (employee involvement and analytical process thinking)