Chapter
3
Quality and Performance
DISCUSSION QUESTIONS
1. The use of automation in a highly craft-oriented process is certainly something to
ponder over. For example, Steinway grand pianos are objects of beauty, each with
its own personality because the fine woods for the exterior finishes and the sound
2. It is important for the new corporation to have a high-quality product right at the
start because it has no market presence in the automobile market. Making sure that
the process is capable is very important for a secure start and long-term presence.
shares.
3. Unethical business practices degrade the quality of a service or product because
quality, from a consumer’s perspective, is often defined by the experience involved
with the consumption of the service or product. This experience involves the
interactions with the business or organization providing the service or product. If the
Quality and Performance ⚫ CHAPTER 3 ⚫ 3-2
Copyright © 2019 Pearson Education, Inc.
organizations to follow. It is generally accepted that ethical behavior is the best
avenue for the long-term growth of organizations.
PROBLEMS
Statistical Process Control
1. Quickie Car Wash
x
= 390 sec, n = 9,
R
= 10 sec
From Table 3.1,
2
A
= 0.337,
3
D
= 0.184,
4
D
= 1.816
R
UCL
=
4
DR
= 1.816(10 sec) = 18.16 sec
R
LCL
=
3
DR
= 0.184(10 sec) = 1.84 sec
x
UCL
=
2
x A R+
= 390 sec + 0.337(10 sec) = 393.37 sec
2
x
LCL x A R=−
= 390 sec – 0.337(10 sec) = 386.63 sec
2. Isogen Pharmaceuticals
150x=
milliliters, n = 4,
3R=
ml
From Table 3.1,
20.729A=
,
30.0D=
,
42.282D=
( )
42.282 3 ml 6.846
R
UCL D R= = =
ml
( )
30.0 3 ml 0.0
R
LCL D R= = =
ml
( )
2150 ml 0.729 3 ml 152.187
x
UCL x A R= + = + =
milliliters
( )
2150 ml 0.729 3 ml 147.813
x
LCL x A R= − = − =
milliliters
3. Canine Gourmet Company
x
= 45 grams, n = 10,
R
= 6 grams
a. From Table 3.1,
2
A
= 0.308,
3
D
= 0.223,
4
D
= 1.777
4R
UCL D R=
= 1.777(6 grams) = 10.662 grams
3
R
LCL D R=
= 0.223(6 grams) = 1.338 grams
2
x
UCL x A R=+
= 45 grams + 0.308(6 grams) = 46.848 grams
2
x
LCL x A R=−
= 45 grams – 0.308(6 grams) = 43.152 grams
b. The range is in statistical control; however, the averages of samples 2, 4, and 5
are out of statistical control, therefore, the process is out of control.
4. Aspen Plastics
Quality and Performance ⚫ CHAPTER 3 ⚫ 3-3
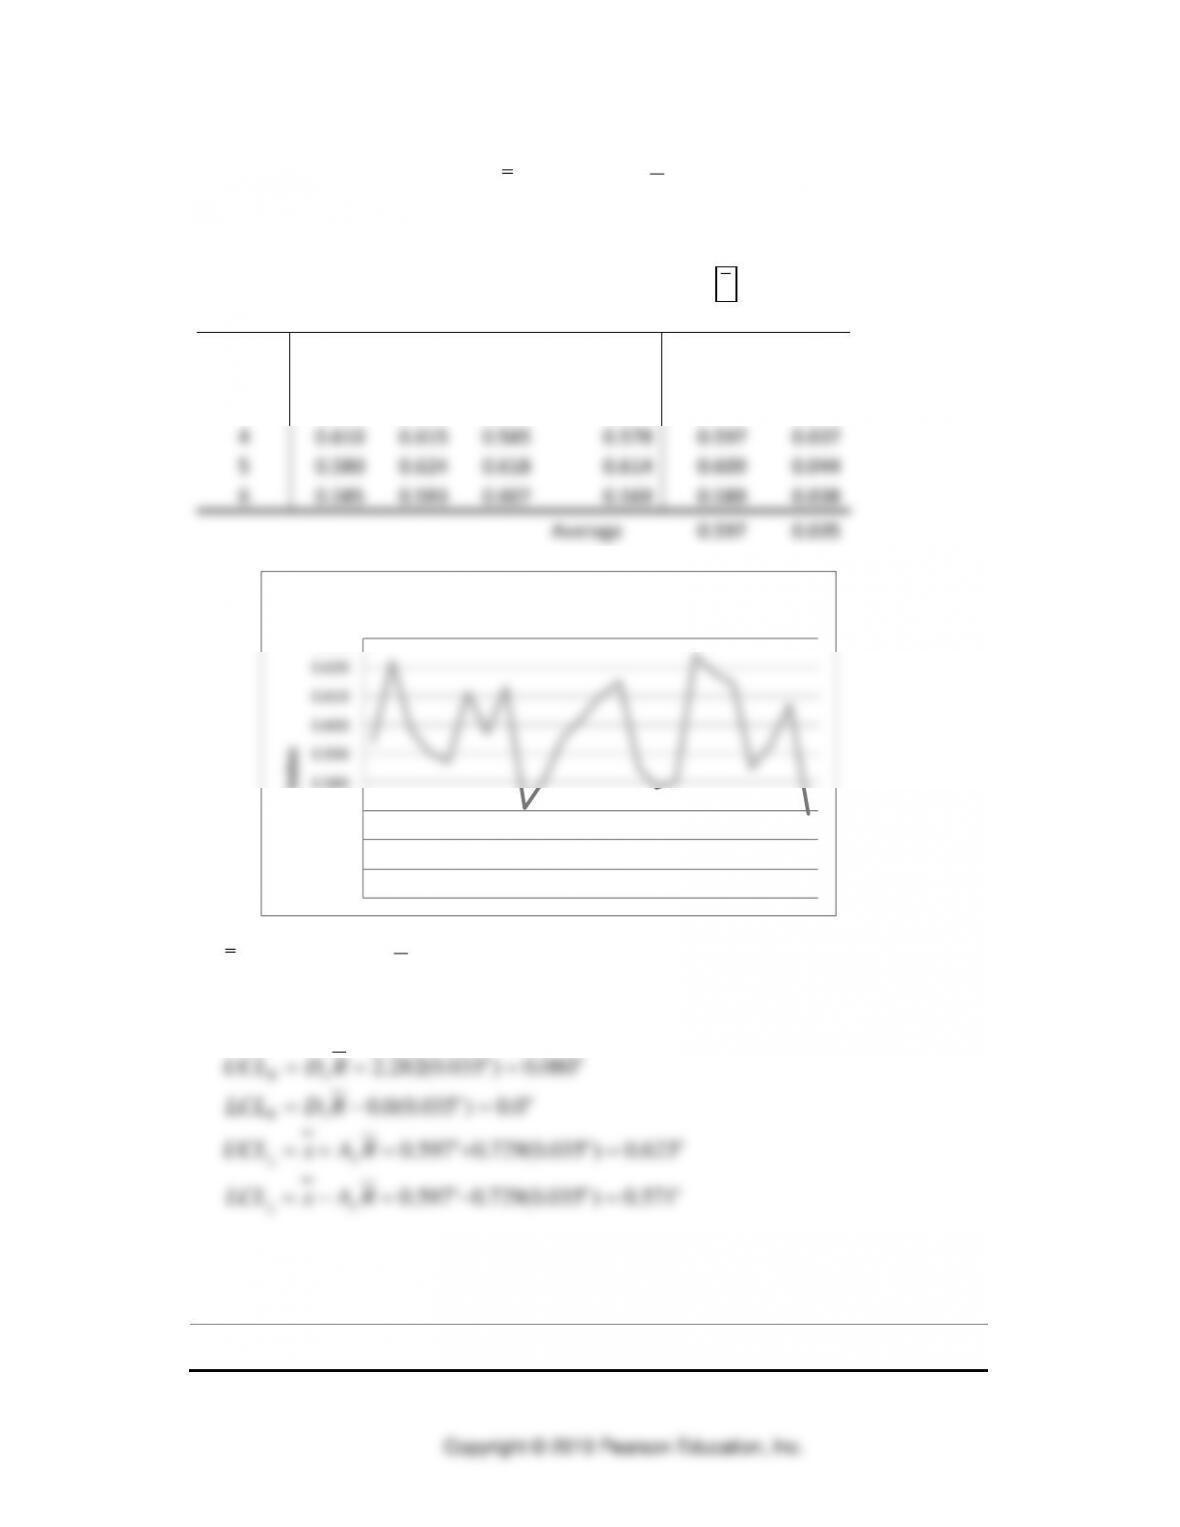
For a quick overview of the data, we can use an Excel Spreadsheet which shows
among other things that
0.597“x=
and
035.0=R
. The graph tracks the outside
diameters over the 6 samples, with four in each sample.
Bottle
R
Sample
1
2
3
4
1
0.594
0.622
0.598
0.590
0.601
0.032
2
0.587
0.611
0.597
0.613
0.602
0.026
3
0.571
0.580
0.595
0.602
0.587
0.031
4
0.610
0.615
0.585
0.578
0.597
0.037
5
0.580
0.624
0.618
0.614
0.609
0.044
6
0.585
0.593
0.607
0.569
0.589
0.038
Average
0.597
0.035
0.540
0.550
0.560
0.570
0.580
0.590
0.600
0.610
0.620
0.630
Inches
Outside diameter of bottle neck
“035.0,4,“597.0 === Rnx
From Table 3.1
“571.0)“035.0(729.0“597.0
“623.0)“035.0(729.0“597.0
“0.0)“035.0(0.0
“080.0)“035.0(282.2
282.2,0.0,729.0
2
2
3
4
432
=−=−=
=+=+=
=−=
===
===
RAxLCL
RAxUCL
RDLCL
RDUCL
DDA
x
x
R
R
5. Mega-Byte Academy
We initially assume the historical grand average is adequate for the central line of the chart:
Student
Year
1
2
3
4
5
6
7
8
9
10
Average
x
Quality and Performance ⚫ CHAPTER 3 ⚫ 3-4
Copyright © 2019 Pearson Education, Inc.
1
63
57
92
87
70
61
75
58
63
71
69.7
2
90
77
59
88
48
83
63
94
72
70
74.4
3
67
81
93
55
71
71
86
98
60
90
77.2
4
62
67
78
61
89
93
71
59
93
84
75.7
5
85
88
77
69
58
90
97
72
64
60
76.0
6
60
57
79
83
64
94
86
64
92
74
75.3
7
94
85
56
77
89
72
71
61
92
97
79.4
8
97
86
83
88
65
87
76
84
81
71
81.8
9
94
90
76
88
65
93
86
87
94
63
83.6
10
88
91
71
89
97
79
93
87
69
85
84.9
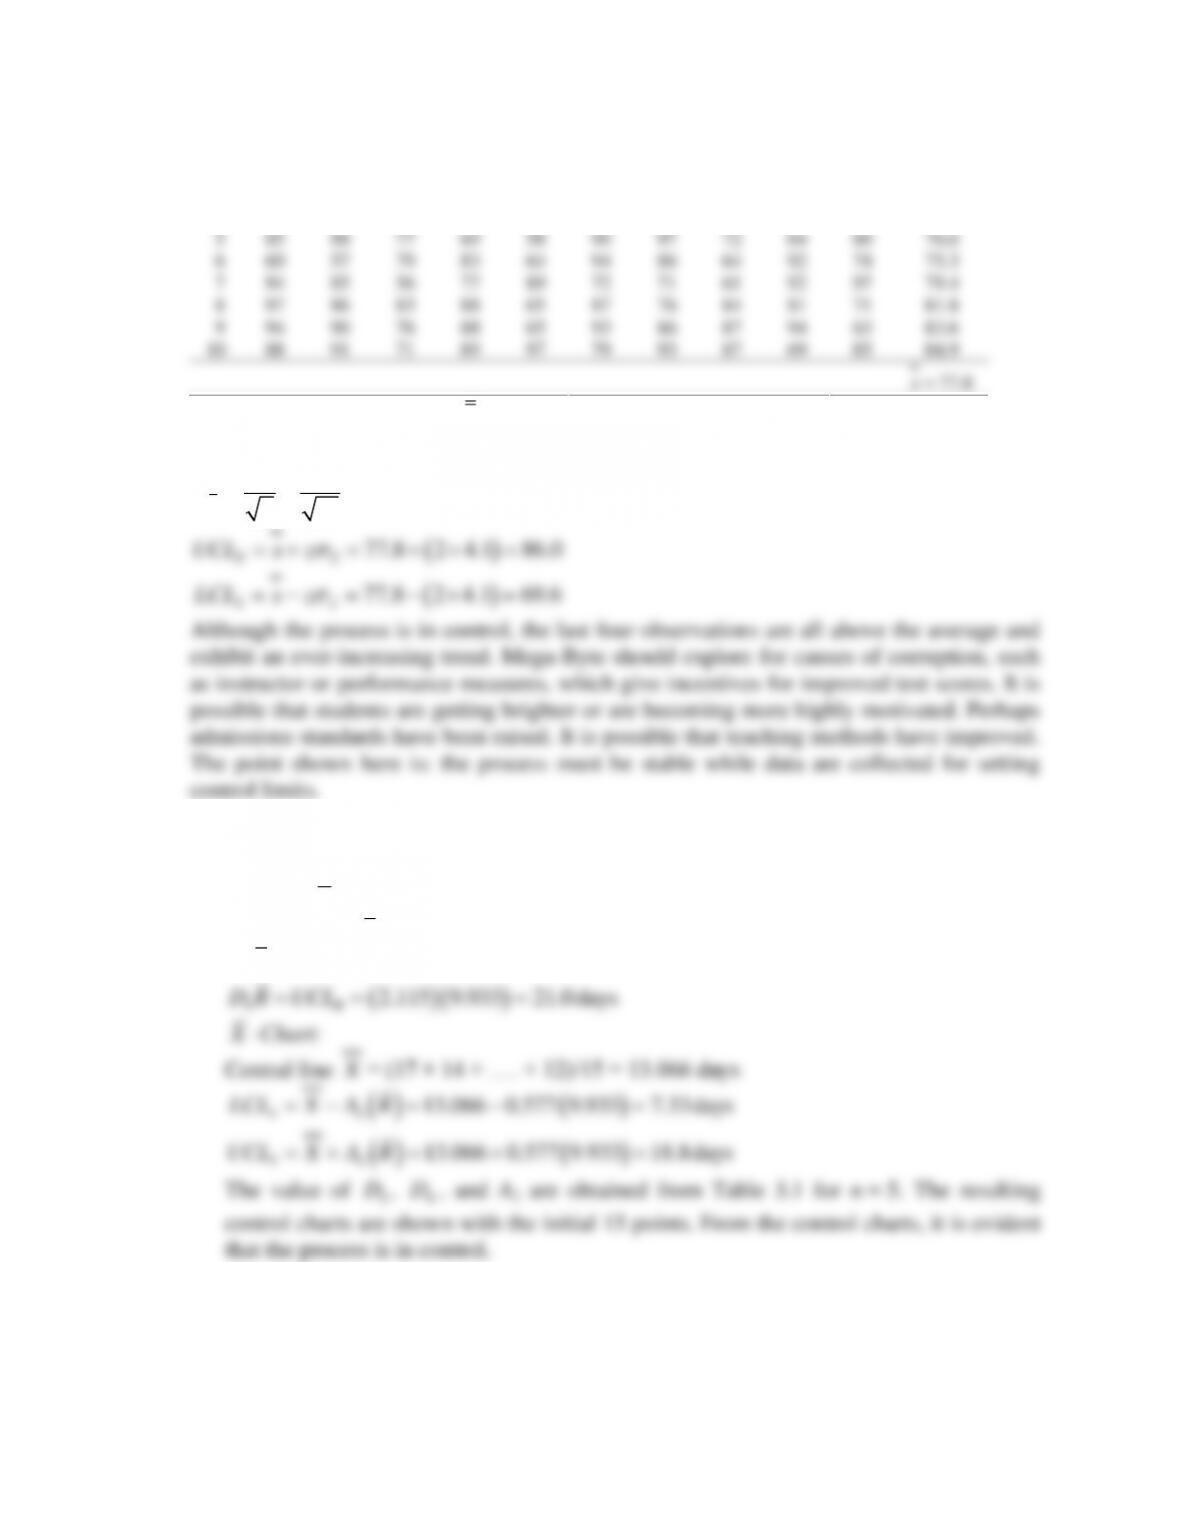
77.8x=
The average for the process,
77.8,x=
and the standard deviation of the 100 historical data
points in Table 3.2 is 13.
13 4.1
10
xn
= = =
( )
77.8 2 4.1 86.0
xx
UCL x z
= + = + =
( )
77.8 2 4.1 69.6
xx
LCL x z
= − = − =
Although the process is in control, the last four observations are all above the average and
exhibit an ever-increasing trend. Mega-Byte should explore for causes of corruption, such
as instructor or performance measures, which give incentives for improved test scores. It is
possible that students are getting brighter or are becoming more highly motivated. Perhaps
admissions standards have been raised. It is possible that teaching methods have improved.
The point shown here is: the process must be stable while data are collected for setting
control limits.
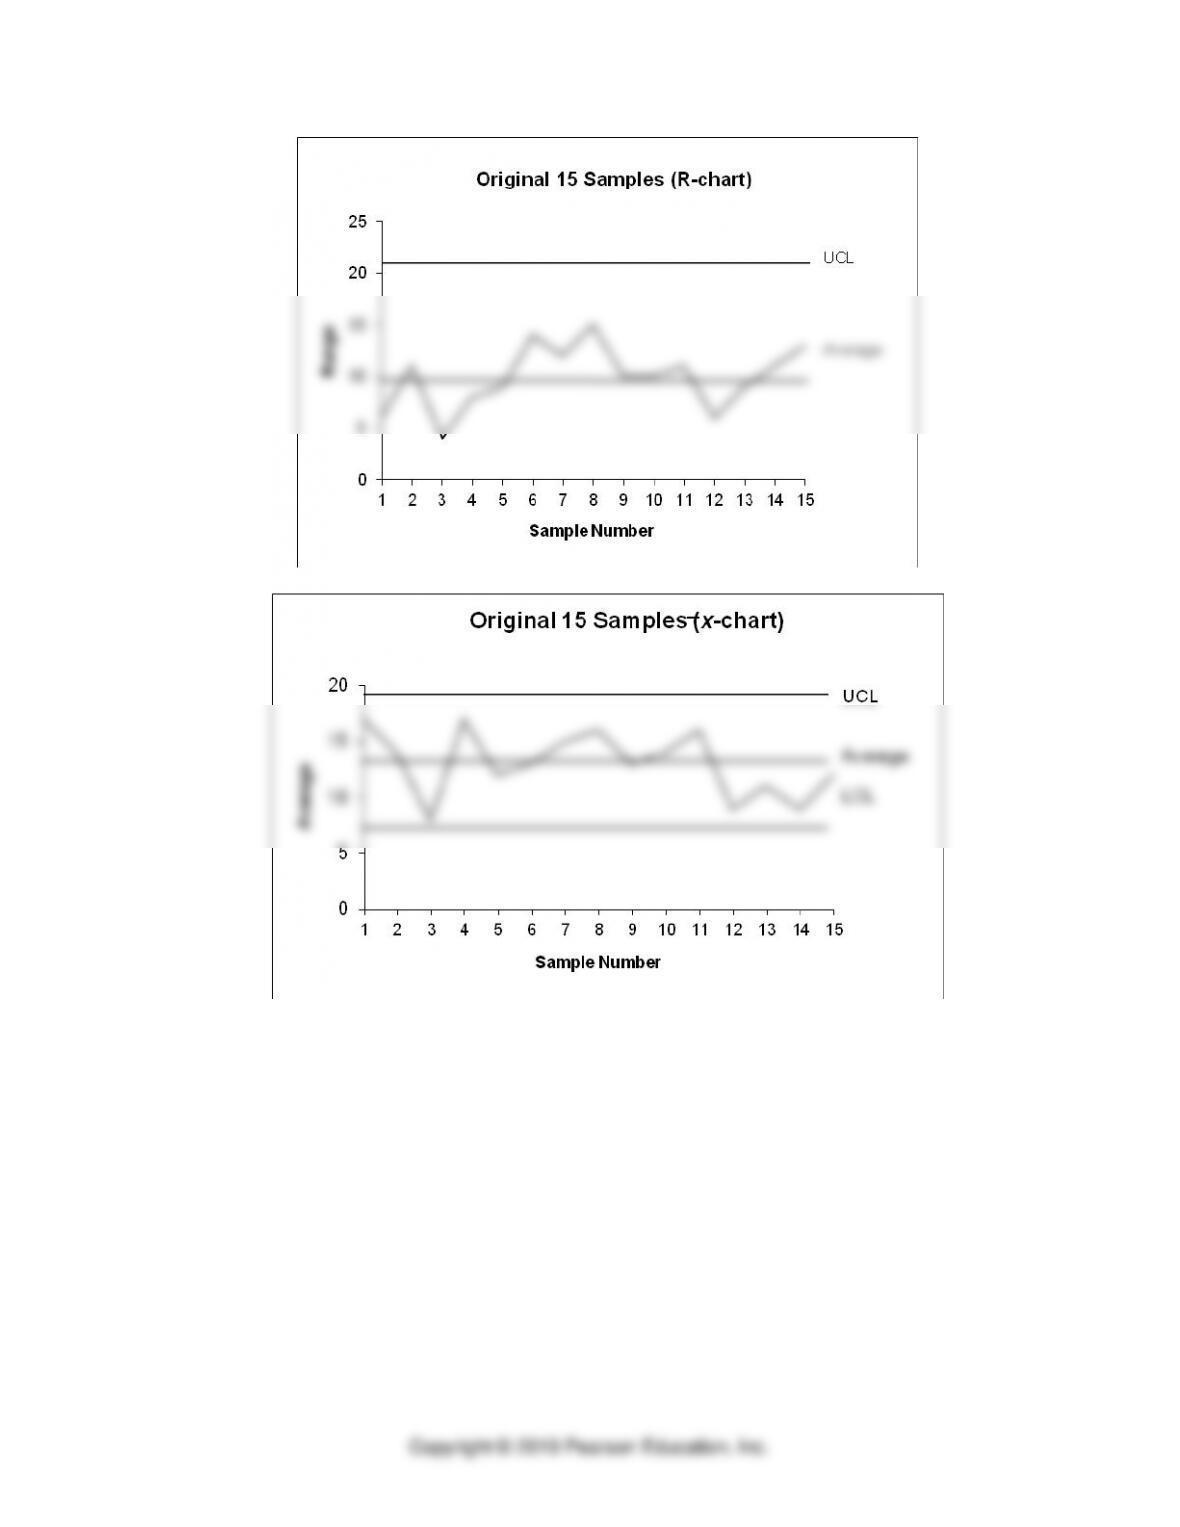
6. The Money Pit
a. The control chart values based on the initial 15 observations are:
R-Chart:
R
= (6 + 11 + …. 13)/15 = 9.933 days
Central line
9.933R
==
( )( )
3
4
0
2.115 9.933 21.0days
R
R
D R LCL
D R UCL
==
= = =
X
-Chart:
Central line
X
= (17 + 14 + …. + 12)/15 = 13.066 days
( )
( )
( )
( )
2
2
13.066 0.577 9.933 7.33days
13.066 0.577 9.933 18.8days
x
x
LCL X A R
UCL X A R
= − = − =
= + = + =
The value of
3
D
,
4
D
, and A2 are obtained from Table 3.1 for n = 5. The resulting
control charts are shown with the initial 15 points. From the control charts, it is evident
that the process is in control.
Quality and Performance ⚫ CHAPTER 3 ⚫ 3-5
b. Plot of the 25 samples including the 10 additional samples, starting at sample 16. The
process is still in control
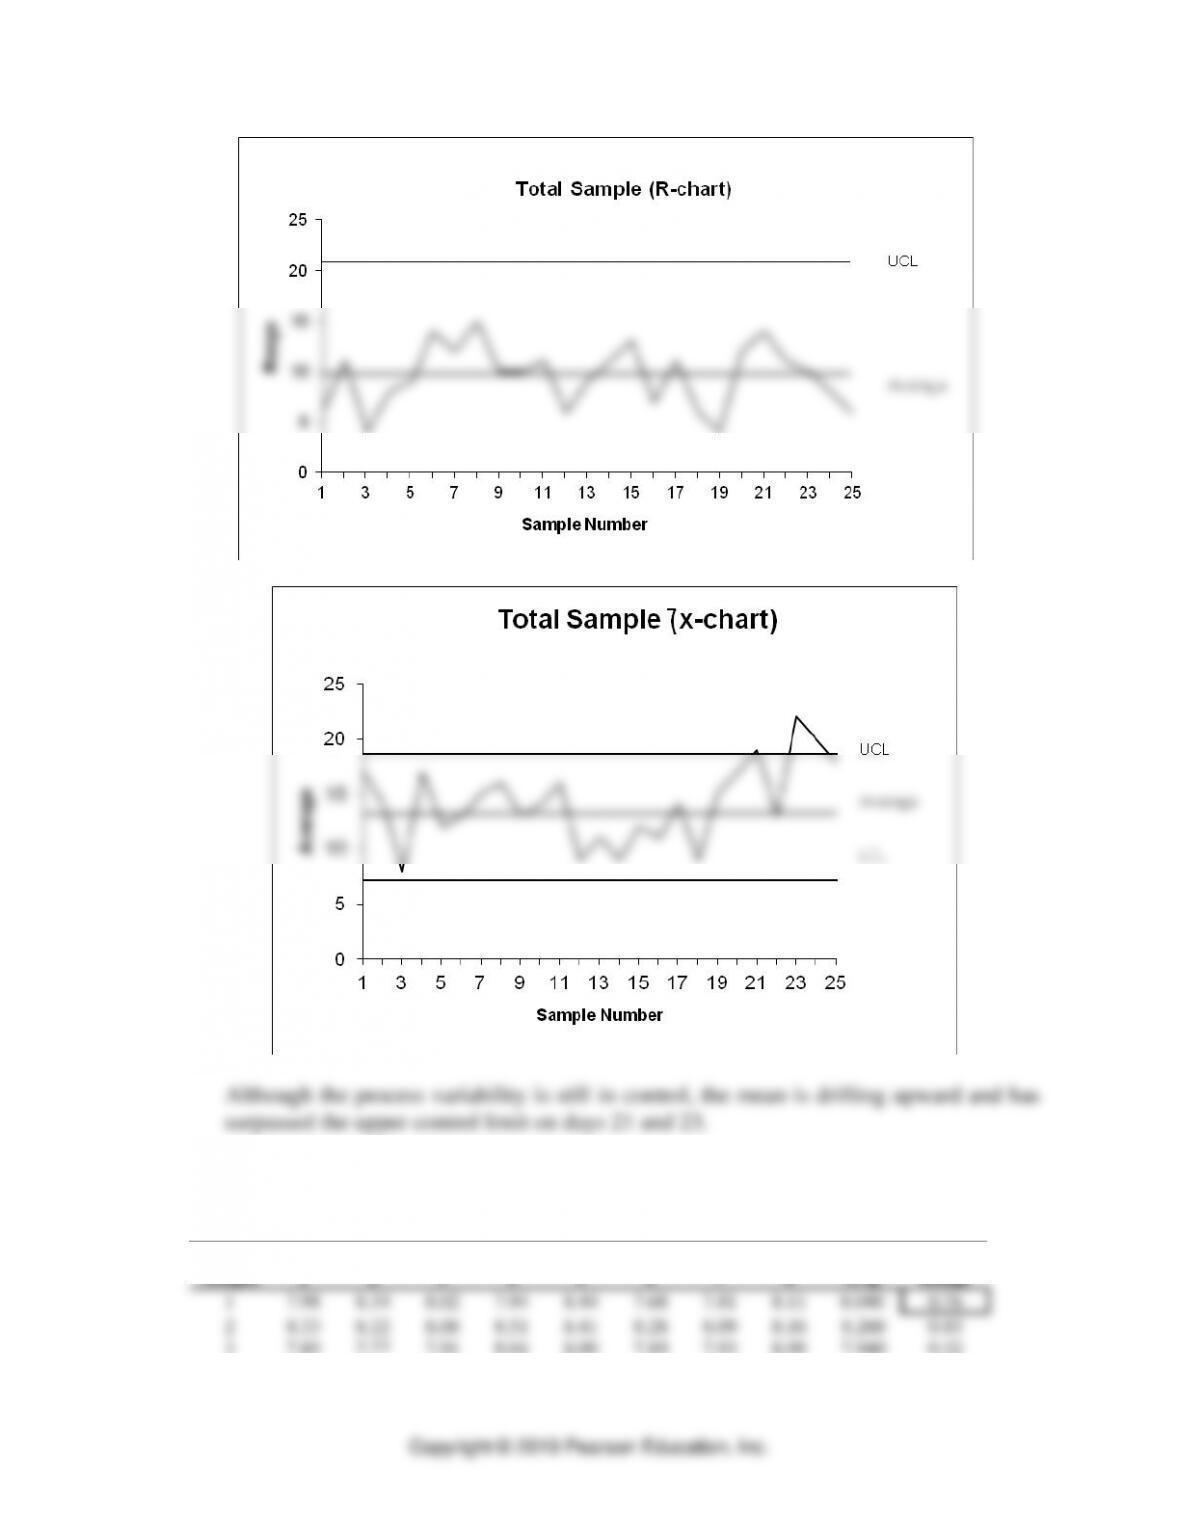
Quality and Performance ⚫ CHAPTER 3 ⚫ 3-6
c. The process average is out of control. The drift in the mean must be corrected.
7. Webster Chemical Company
Tube Number
Sample
1
2
3
4
5
6
7
8
Avg.
Range
1
7.98
8.34
8.02
7.94
8.44
7.68
7.81
8.11
8.040
0.76
2
8.33
8.22
8.08
8.51
8.41
8.28
8.09
8.16
8.260
0.43
3
7.89
7.77
7.91
8.04
8.00
7.89
7.93
8.09
7.940
0.32
4
8.24
8.18
7.83
8.05
7.90
8.16
7.97
8.07
8.050
0.41
Quality and Performance ⚫ CHAPTER 3 ⚫ 3-7
5
7.87
8.13
7.92
7.99
8.10
7.81
8.14
7.88
7.980
0.33
6
8.13
8.14
8.11
8.13
8.14
8.12
8.13
8.14
8.130
0.03
8.067
0.38
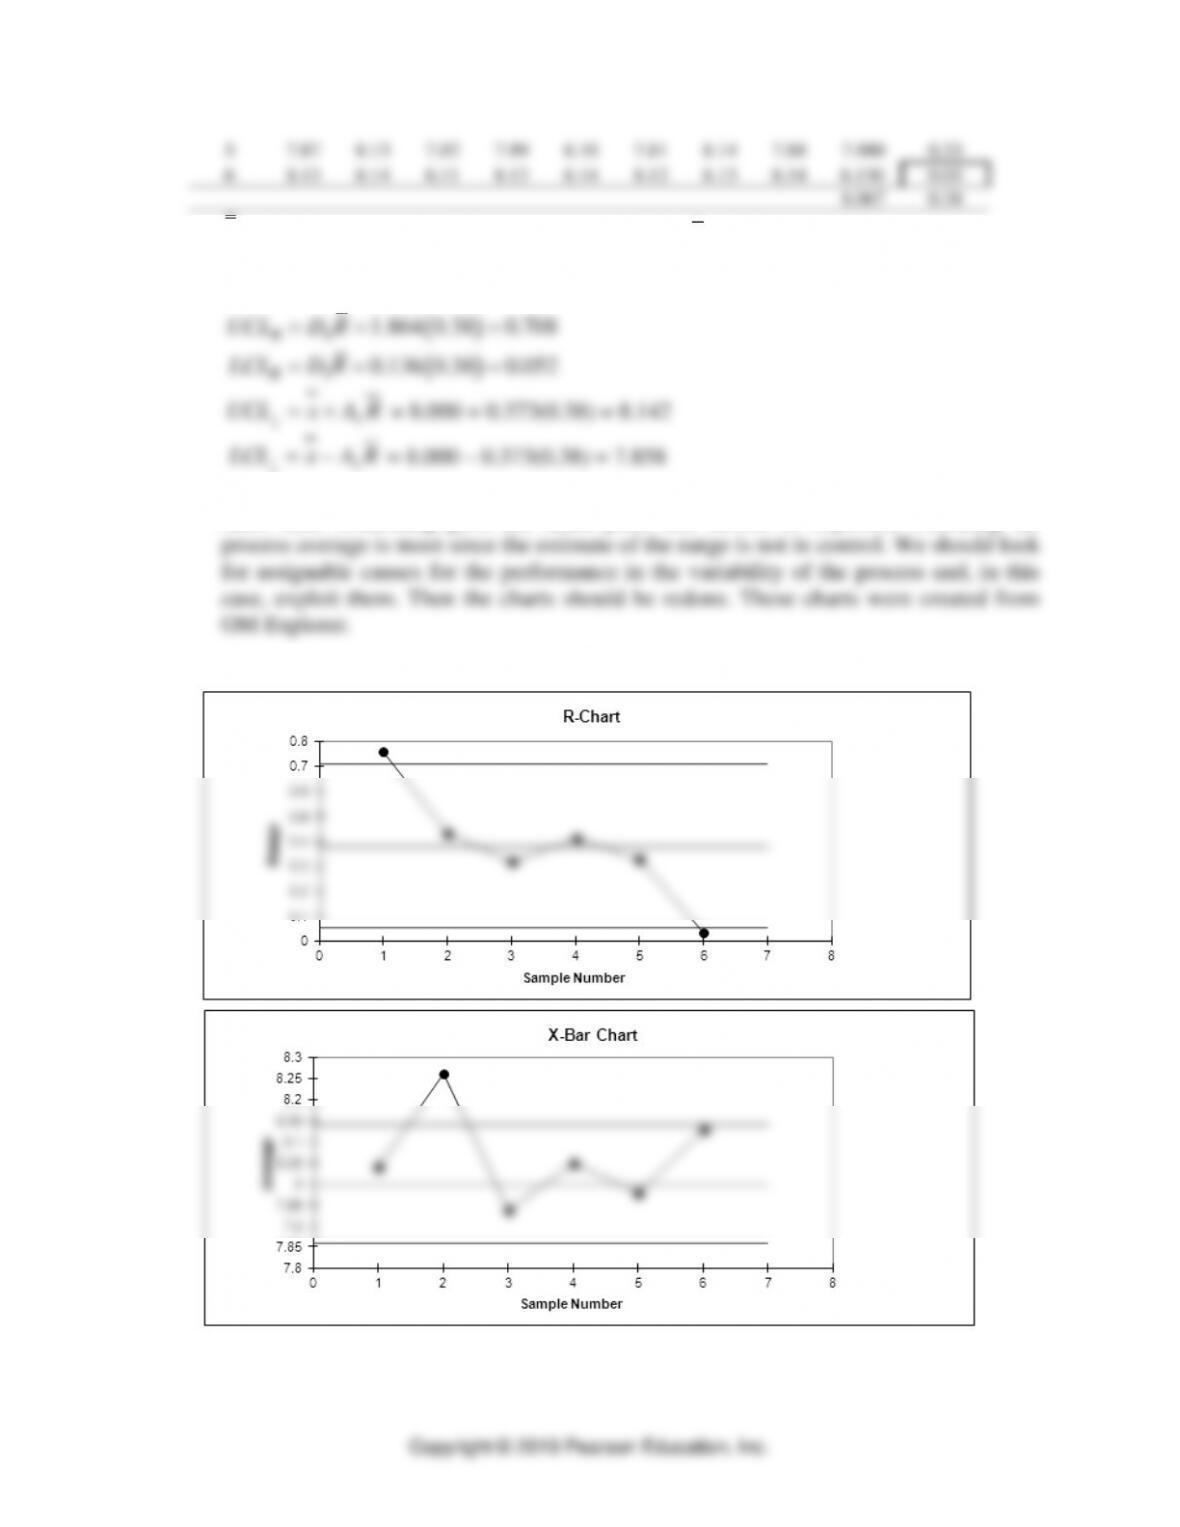
a.
x
= 8.067 (process should be centered on 8.000),
0.38R=
, n = 8
From Table 3.1,
20.373A=
,
30.136D=
,
41.864D=
( )
41.864 0.38 0.708
R
UCL D R= = =
( )
30.136 0.38 0.052
R
LCL D R= = =
RAxUCLx2
+=
= 8.000 + 0.373(0.38) = 8.142
RAxLCLx2
−=
= 8.000 – 0.373(0.38) = 7.858
b. The range went out of control on the first sample. However, it has steadily gone down
since then. Something good has taken place and should be exploited. Checking the
Quality and Performance ⚫ CHAPTER 3 ⚫ 3-8
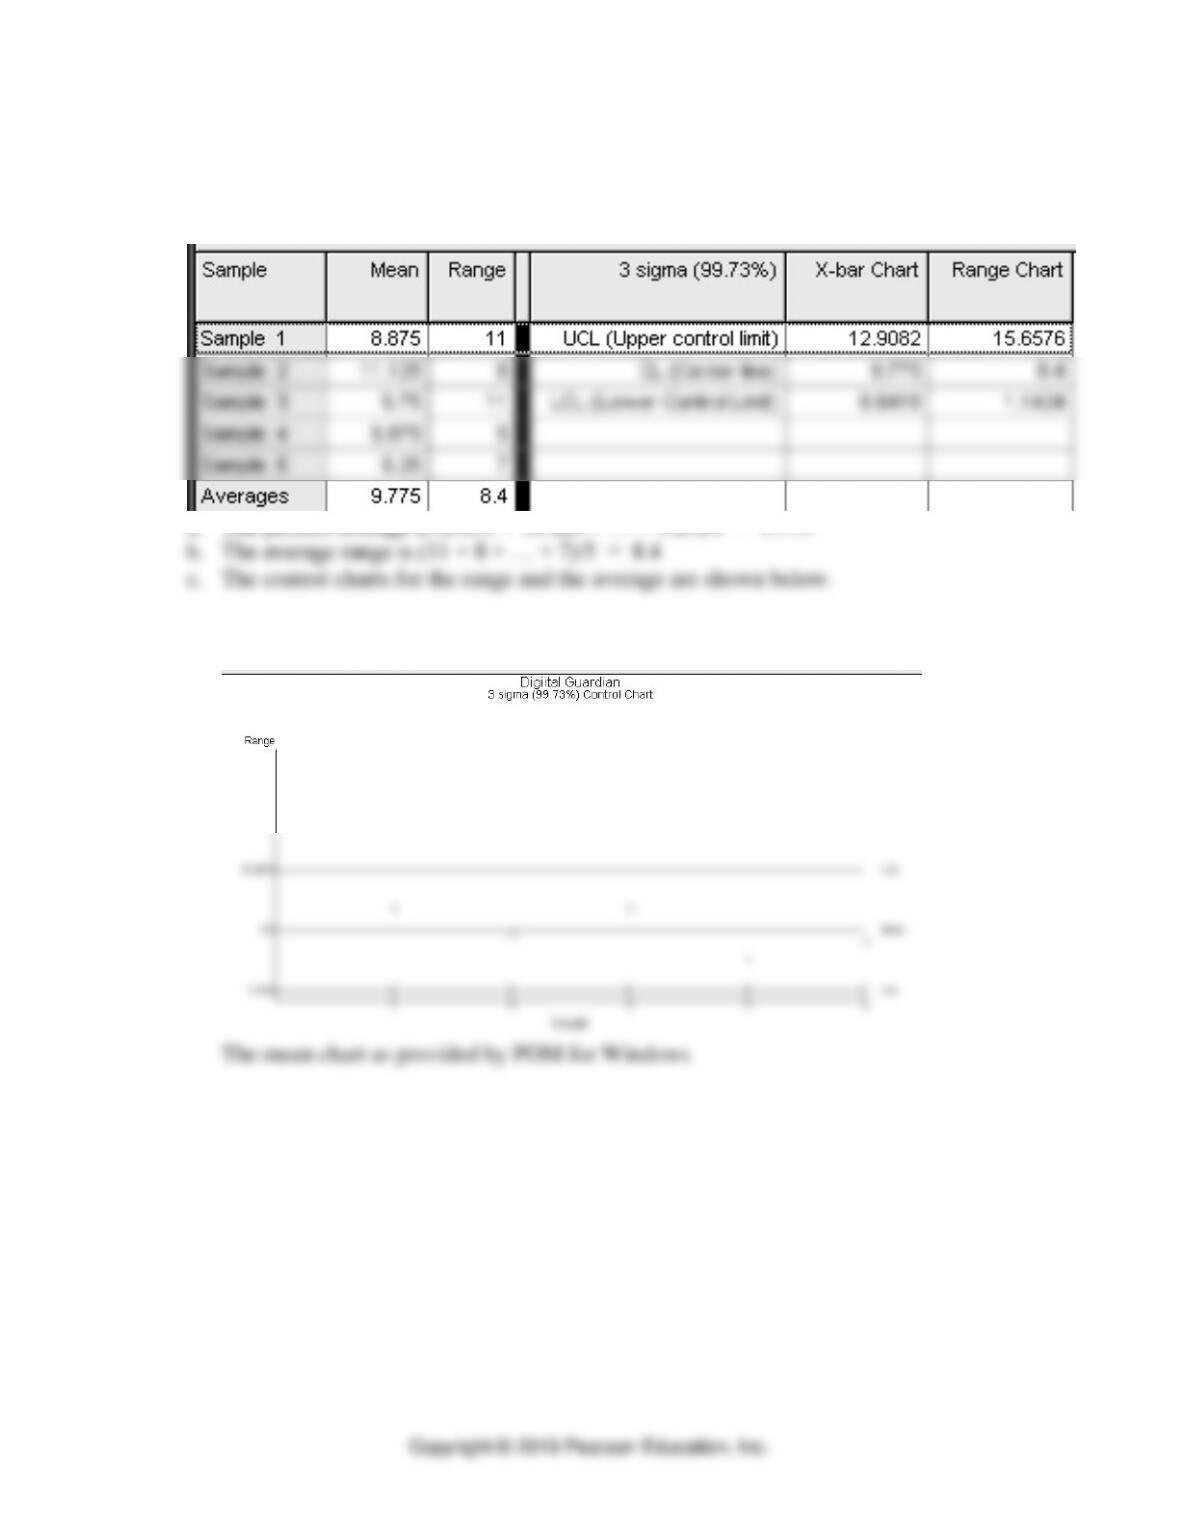
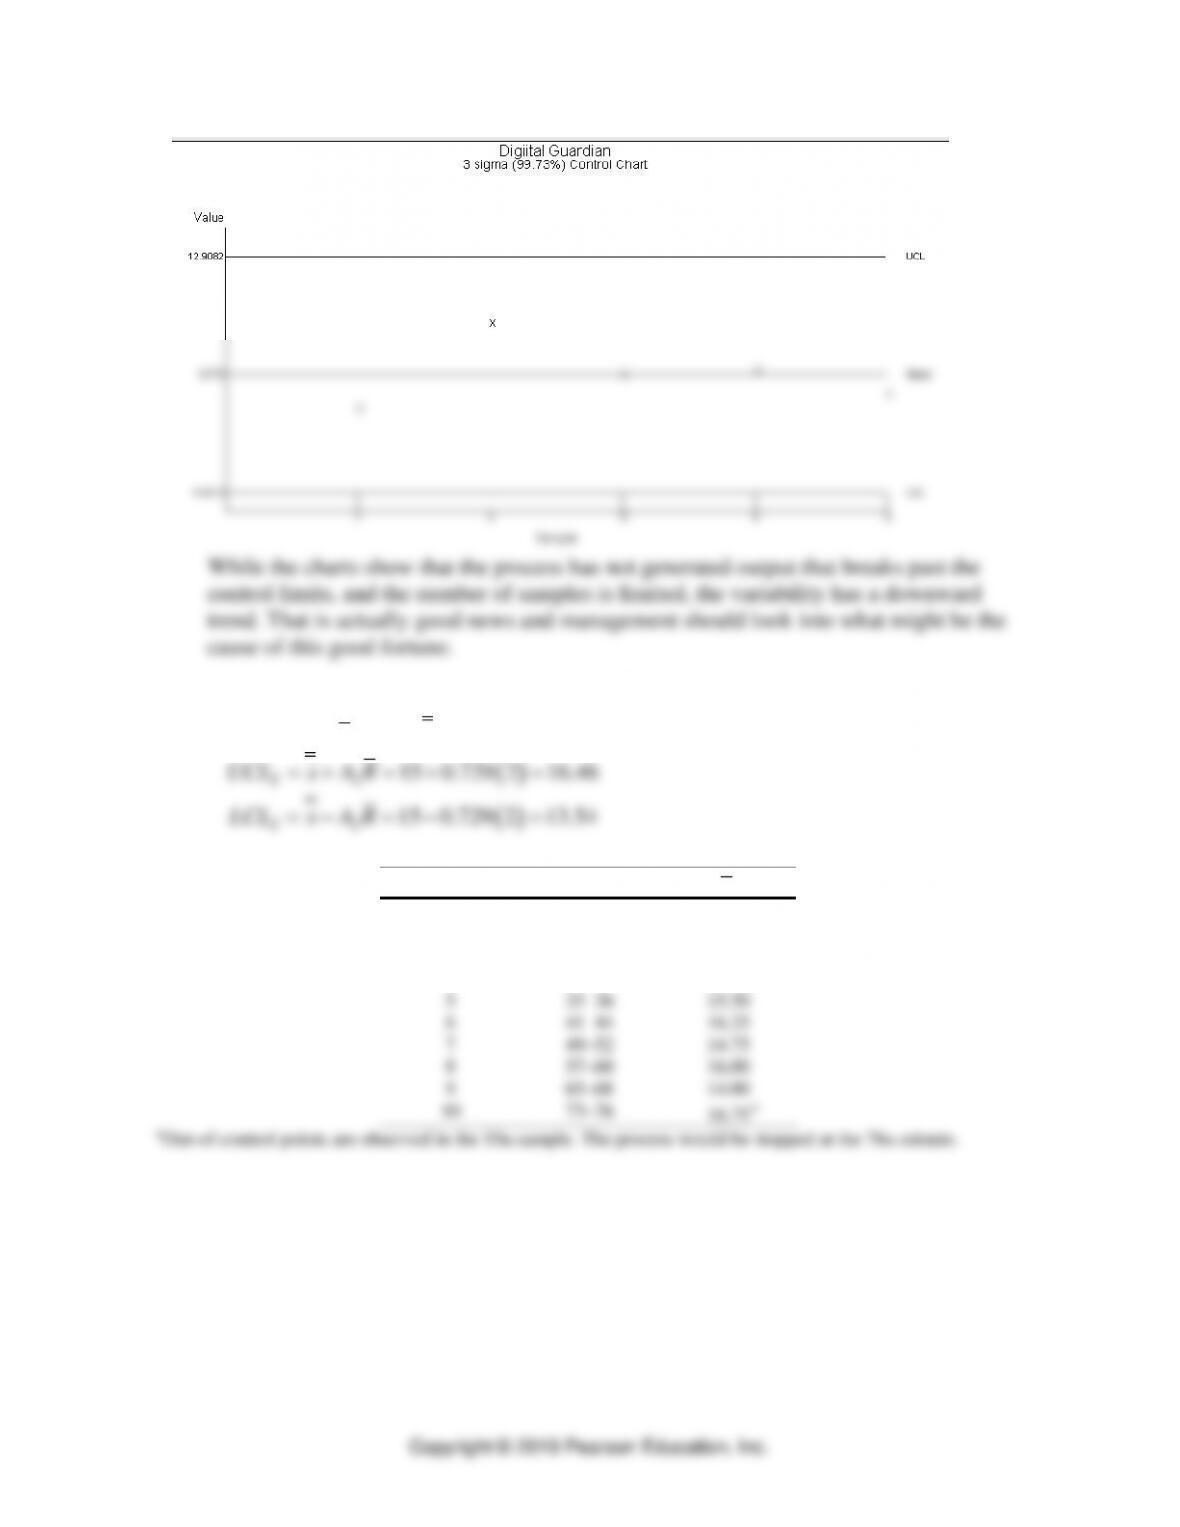
8. Digital Guardian Company
Using POM for Windows we get the following mean and range chart results
a. The process average is (8.875 + 11.125 + … + 9.25)/5 = 9.775
The range chart as provided by POM for Windows
Quality and Performance ⚫ CHAPTER 3 ⚫ 3-9
Copyright © 2019 Pearson Education, Inc.
While the charts show that the process has not generated output that breaks past the
control limits, and the number of samples is limited, the variability has a downward
trend. That is actually good news and management should look into what might be the
cause of this good fortune.
9. Precision Machining Company (measurements in thousandths of inches)
b. With n = 4,
2.0R=
,
15x=
the parameters of the x-bar-chart are:
( )
215 0.729 2 16.46
x
UCL x A R= + = + =
( )
215 0.729 2 13.54
x
LCL x A R= − = − =
Sample
Minutes
x
1
1–4
15.75
2
9–12
15.00
3
17–20
13.75
4
25–28
14.75
5
33–36
15.50
6
41–44
16.25
7
49–52
14.75
8
57–60
16.00
9
65–68
14.00
10
73–76
16.75*
*Out-of-control points are observed in the 10th sample. The process would be stopped at the 76th minute.
Quality and Performance ⚫ CHAPTER 3 ⚫ 3–10
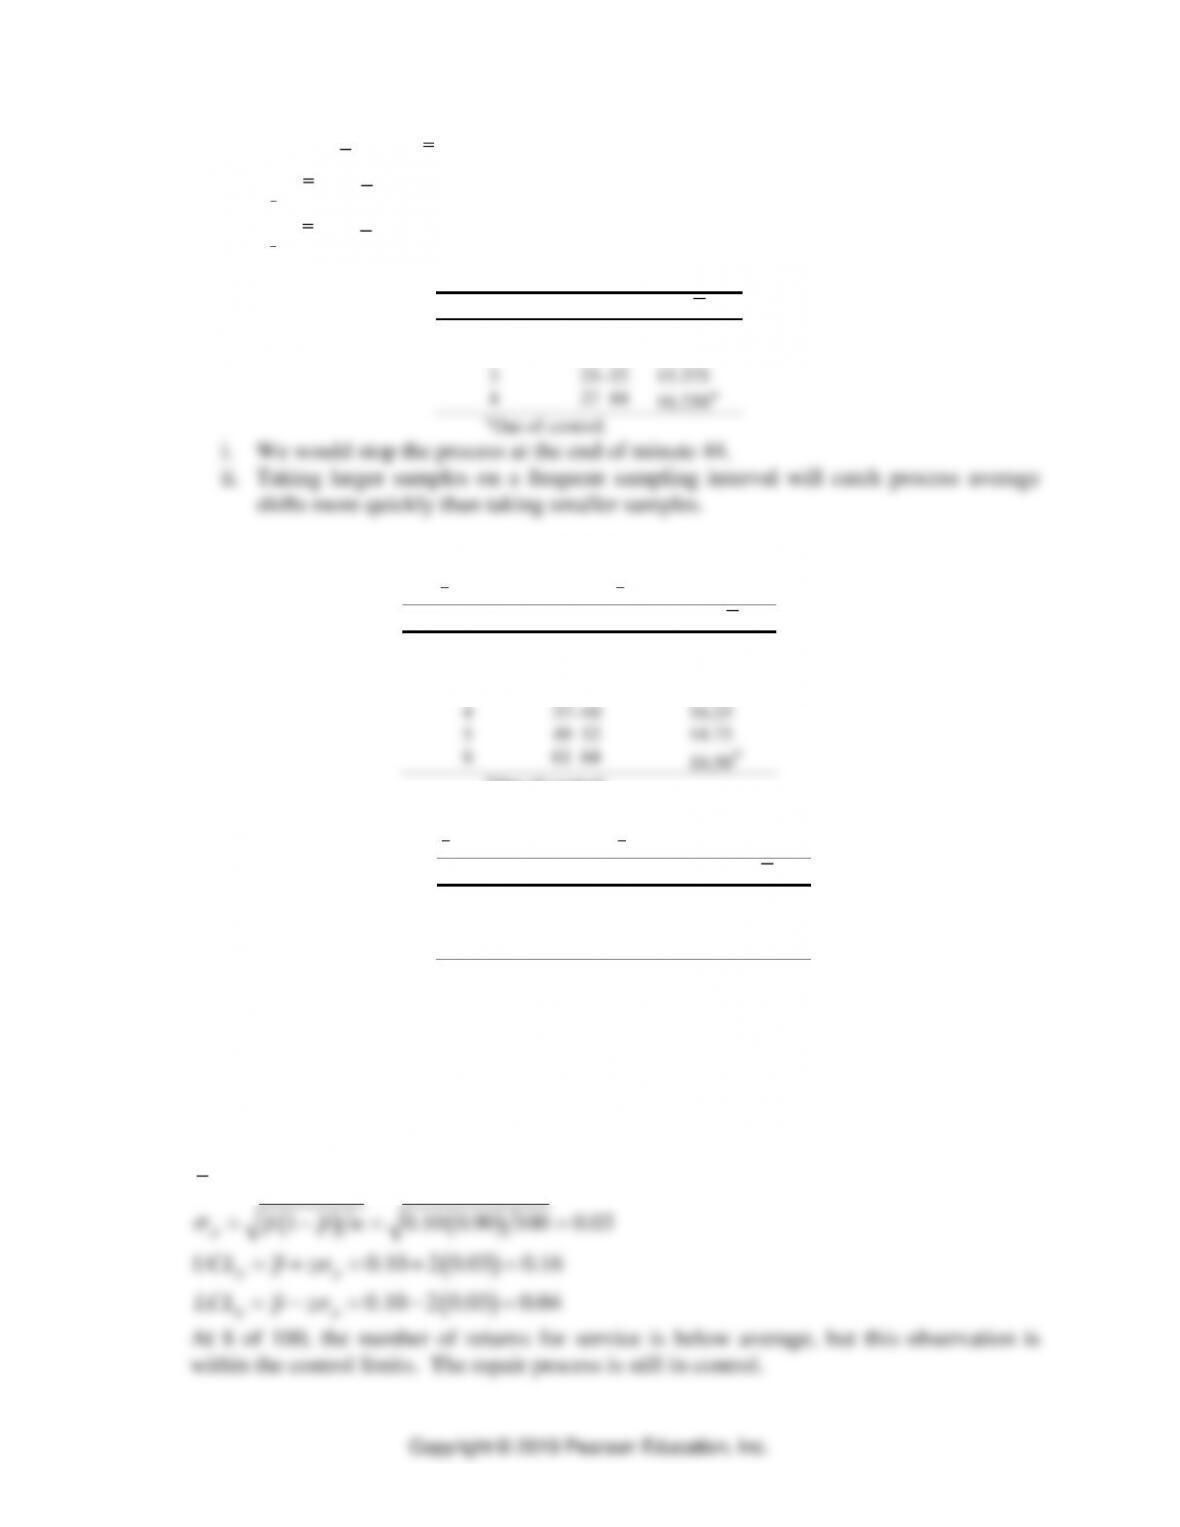
b. With n = 8,
2.0R=
,
15x=
the parameters of the x-bar-chart are:
( )
215 0.373 2 15.746
x
UCL x A R= + = + =
, or 15.75
( )
215 0.373 2 14.254
x
LCL x A R= − = − =
, or 14.25
Sample
Minutes
x
1
1–8
15.625
2
13–20
14.875
3
25–32
15.375
4
37–44
16.250*
*Out of control.
i. We would stop the process at the end of minute 44.
ii. Taking larger samples on a frequent sampling interval will catch process average
shifts more quickly than taking smaller samples.
10. Precision Machining, continued
a. From Problem 9a,
16.46
x
UCL =
and
13.54
x
LCL =
.
Sample
Minutes
x
1
1–4
15.75
2
13–16
16.00
3
25–28
14.75
4
37–40
16.25
5
49–52
14.75
6
61–64
16.50*
*Out of control.
We would stop the process at the end of minute 64.
b. From Problem 9b,
15.75
x
UCL =
and
14.25
x
LCL =
Sample
Minutes
x
1
1–8
15.625
2
17–24
14.75
3
33–40
15.875*
*Out of control.
We would stop the process at the end of minute 40.
c. Larger sample sizes resulted in faster detection of changes in the process average;
however, the cost of inspection may be greater than for taking smaller sample sizes. The
real trade-off is the cost of inspection versus the cost of not detecting the shift in the
process average.
11. Garcia’s Garage
0.10p=
, n = 100, z = 2
( ) ( )
1 0.10 0.90 100 0.03
pp p n
= − = =
( )
0.10 2 0.03 0.16
pp
UCL p z
= + = + =
( )
0.10 2 0.03 0.04
pp
LCL p z
= − = − =
At 8 of 100, the number of returns for service is below average, but this observation is
within the control limits. The repair process is still in control.
Quality and Performance ⚫ CHAPTER 3 ⚫ 3-11
12. Hospital administrator
a.
p
= Total absent/Total observations
= 49/15(64) = 0.051
( ) ( )
1 0.051 1 0.051 64
pp p n
= − = −
= 0.0275
pp
UCL p z
=+
= 0.051 + 2.58(0.0275) = 0.1219
pp
LCL p z
=−
= 0.051 – 2.58(0.0275) = – 0.01995, adjusted to zero.
b. The data from the last three weeks fall within the control limits. Therefore we accept
the estimate of 5.1% absenteeism. You must now assess whether this amount of
absenteeism is typical for nurse’s aides.
13. IRS
The following table provides the POM for Windows output for this problem. Note that the
“number of defects” column corresponds to (25 – the number of correctly answered
questions).
a.
0.0)08660(.325.
5098.0)08660(.325.
08660.25/)75(.25./)1(
25.,25
=−=−=
=+=+=
==−=
==
pp
pp
p
zpLCL
zpUCL
npp
pn
Quality and Performance ⚫ CHAPTER 3 ⚫ 3–12
Copyright © 2019 Pearson Education, Inc.
The average proportion of incorrect responses for the sample of 20 observations is
0.25.
b. The following Control Charts was developed using POM for Windows.
One observation falls outside of the control limits. Sample 10 with 60% incorrect
answers should alert the IRS to look into the background and training of this
individual to learn what went wrong. Perhaps this individual needs more training.
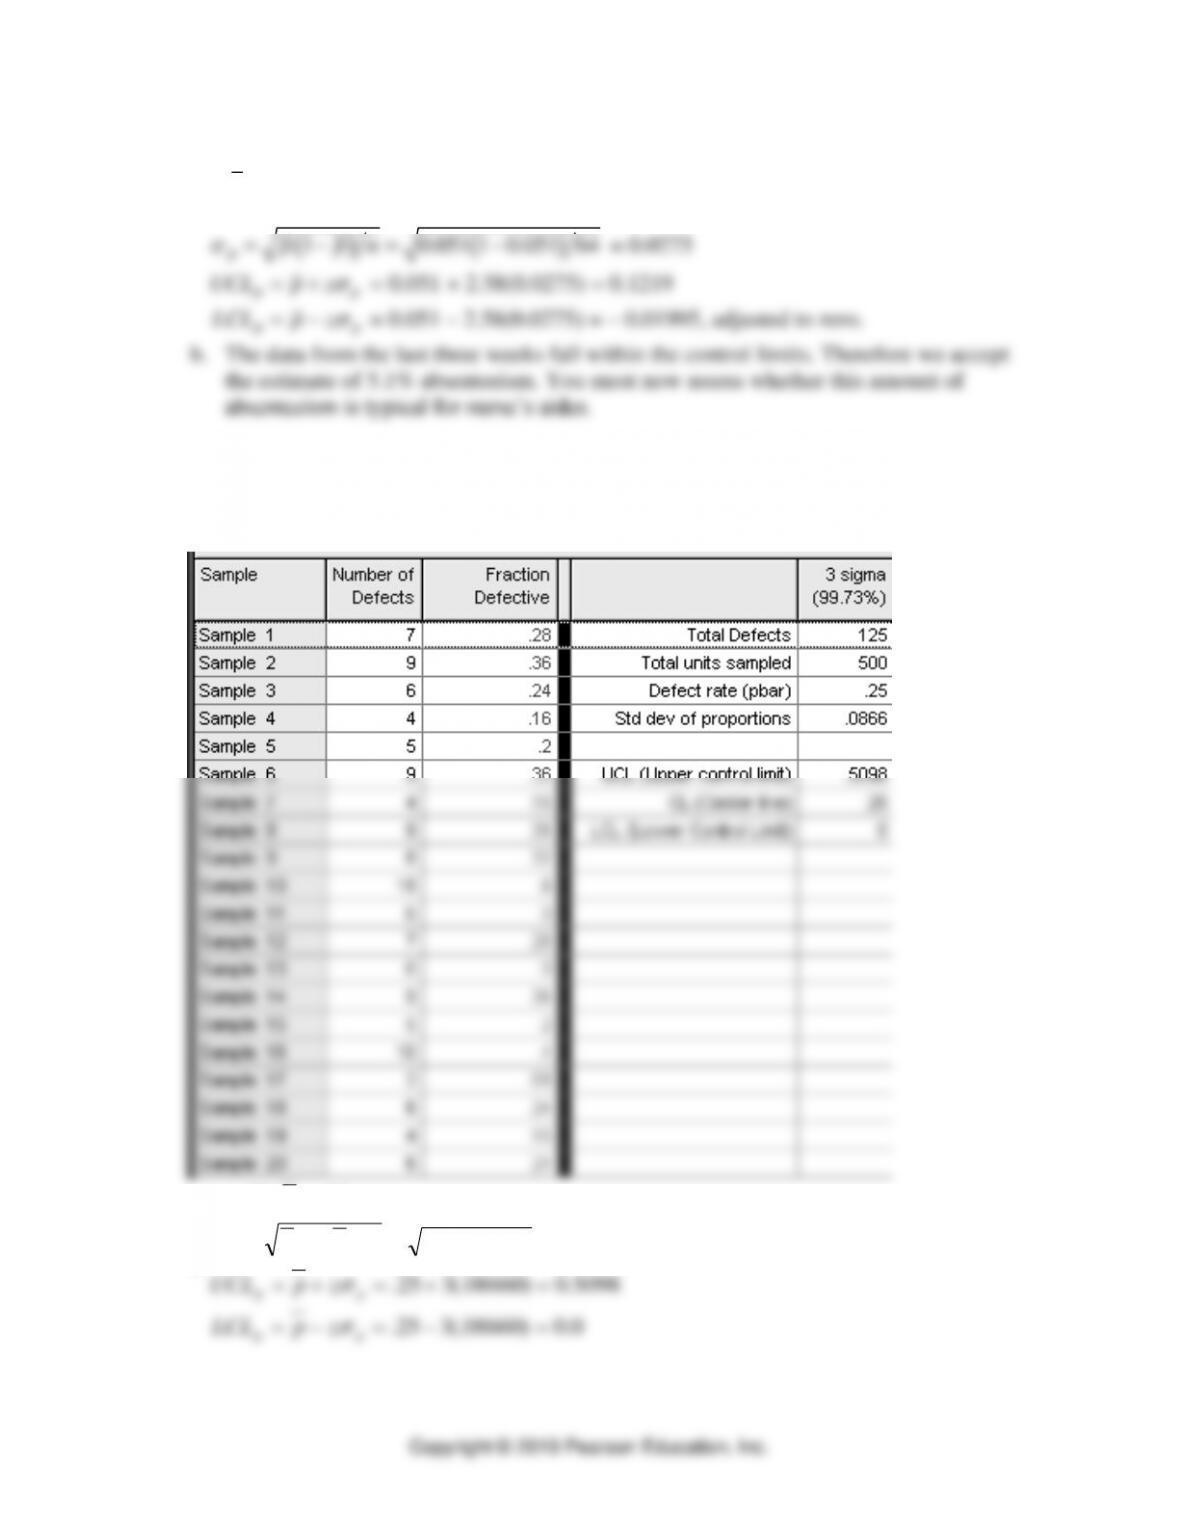
14. Webster, p-chart
n = 144,
( )
72 0.025
20 144
p==
( ) ( )
1 0.025 0.975 144 0.013
pp p n
= − = =
( )
0.025 3 0.013 0.064
pp
UCL p z
= + = + =
( )
0.025 3 0.013 0.014
pp
LCL p z
= − = − = −
, adjusted to zero
The highest proportion of defectives occurs in sample #10, but is still within the control
limits. p= 9/144 = 0.0625. The process is in control.
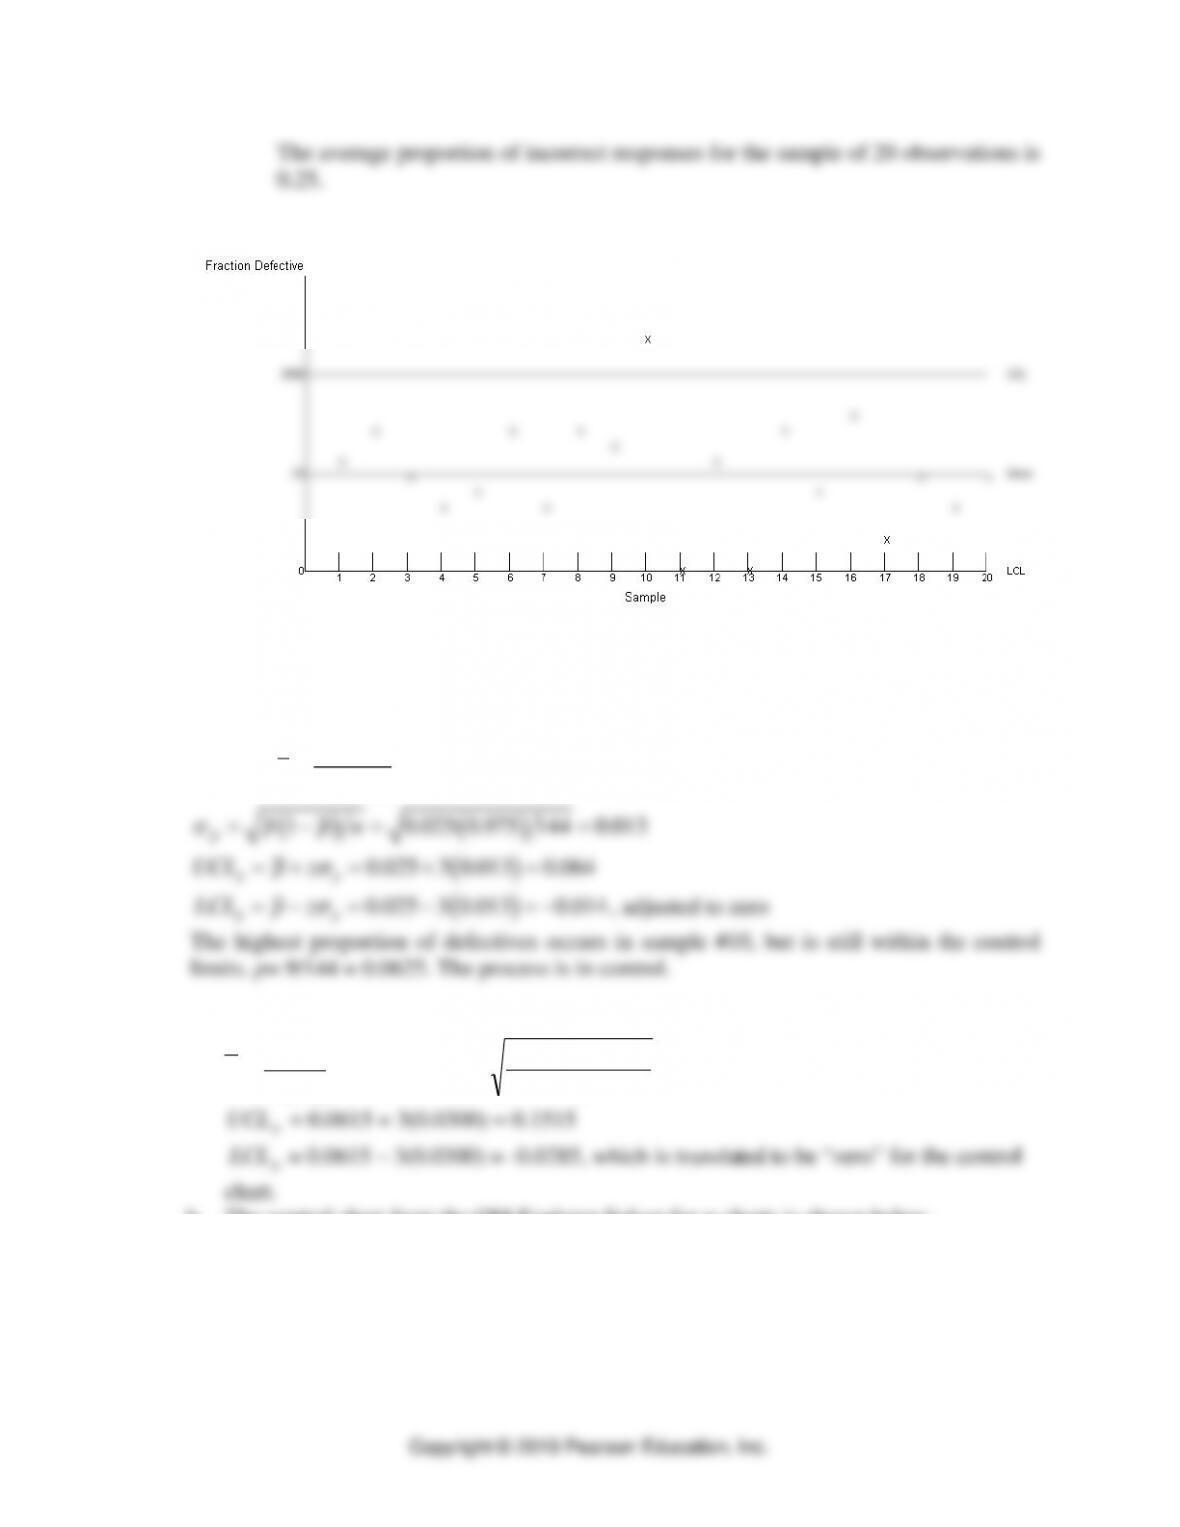
15. Pine Crest Medical Clinic
a.
0615.0
)64(15
59 ==p
0300.0
64
)9385.0(0615.0 ==
p
p
UCL
= 0.0615 + 3(0.0300) = 0.1515
p
LCL
= 0.0615 – 3(0.0300) = -0.0285, which is translated to be “zero” for the control
chart.
b. The control chart from the OM Explorer Solver for p-charts is shown below.
Quality and Performance ⚫ CHAPTER 3 ⚫ 3-13
Since none of the proportions fall outside of the control limits, we can conclude that the
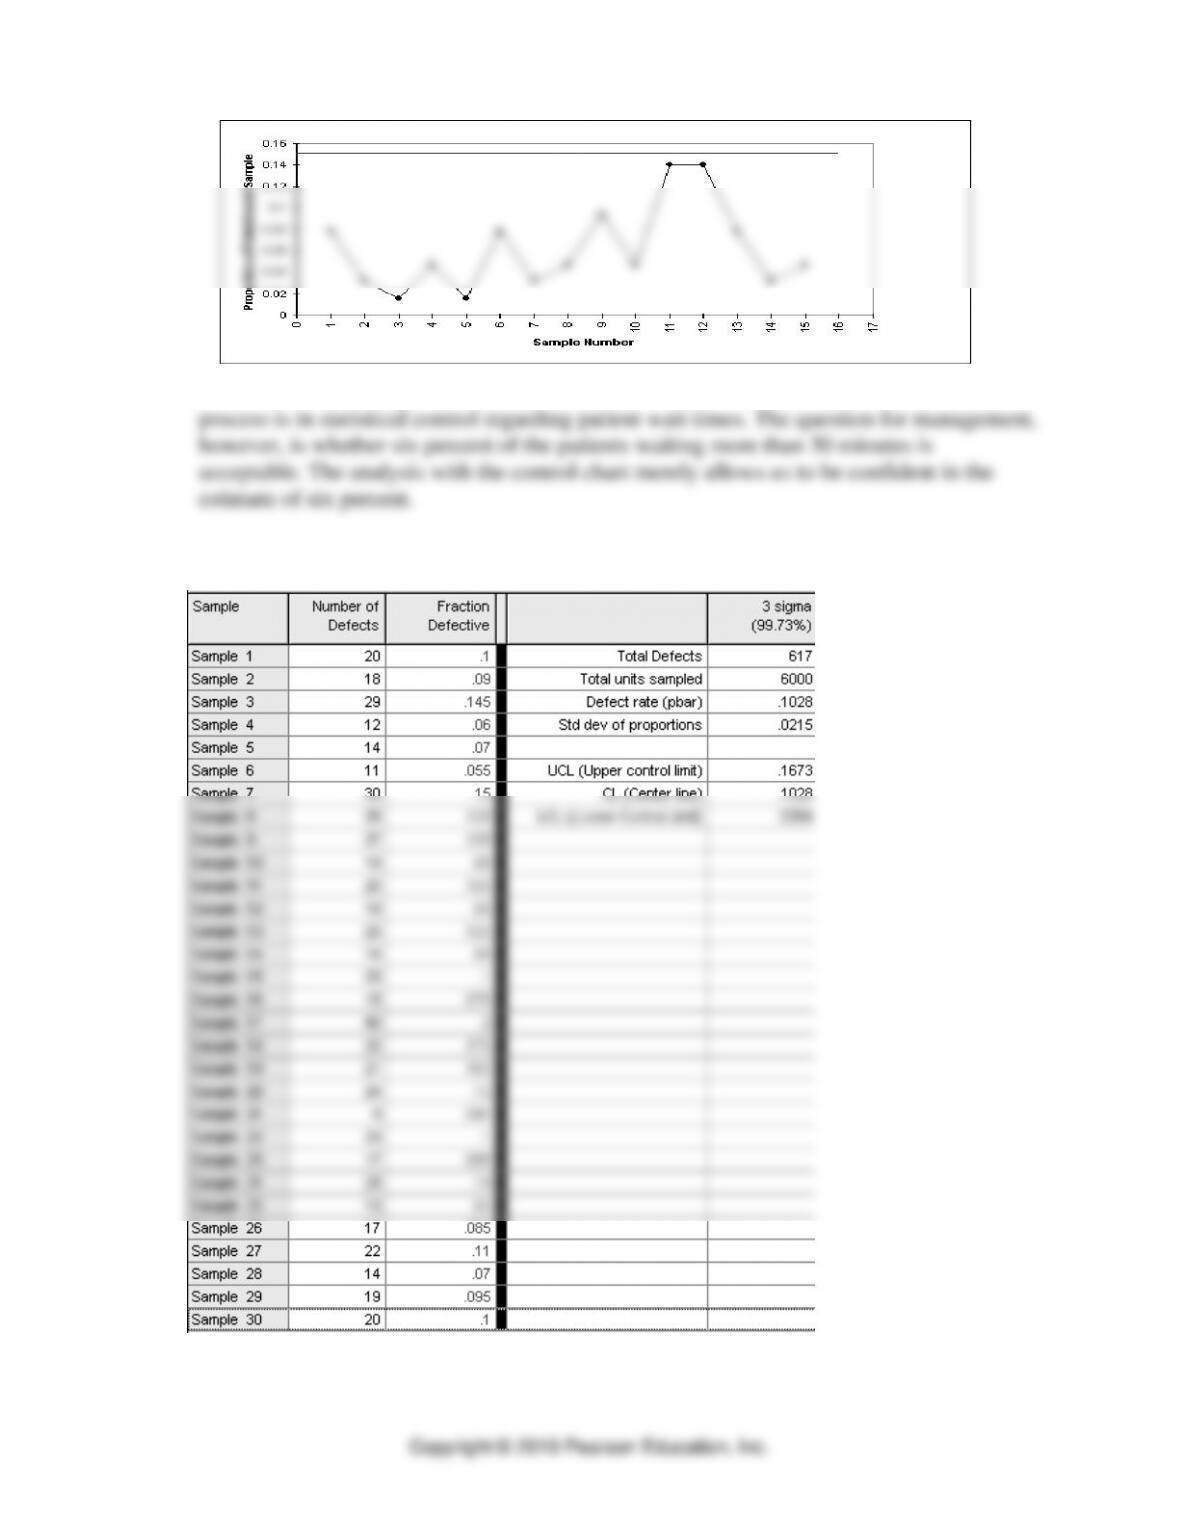
16. Patriot Insurance
Using POM for Windows we get the following p-chart results
a. From the Table above we get the following statistics:
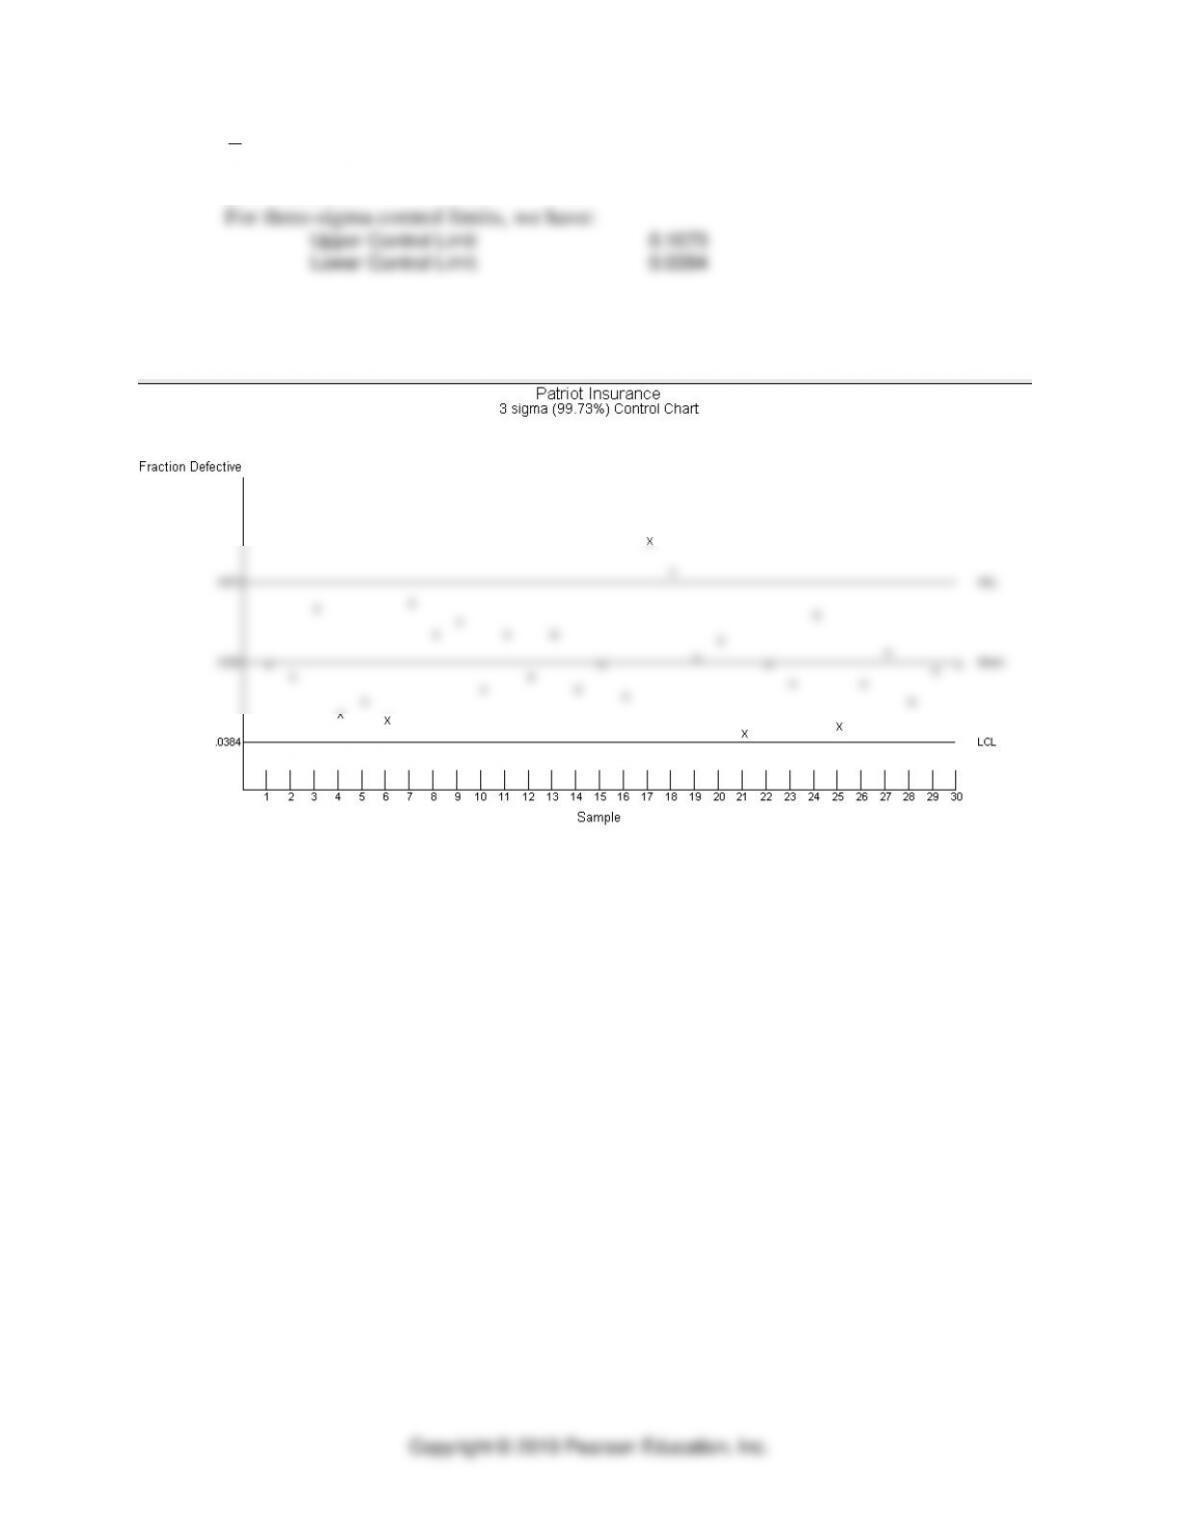
Quality and Performance ⚫ CHAPTER 3 ⚫ 3–14
p
= 0.1028
= 0.0215
Quality and Performance ⚫ CHAPTER 3 ⚫ 3-15
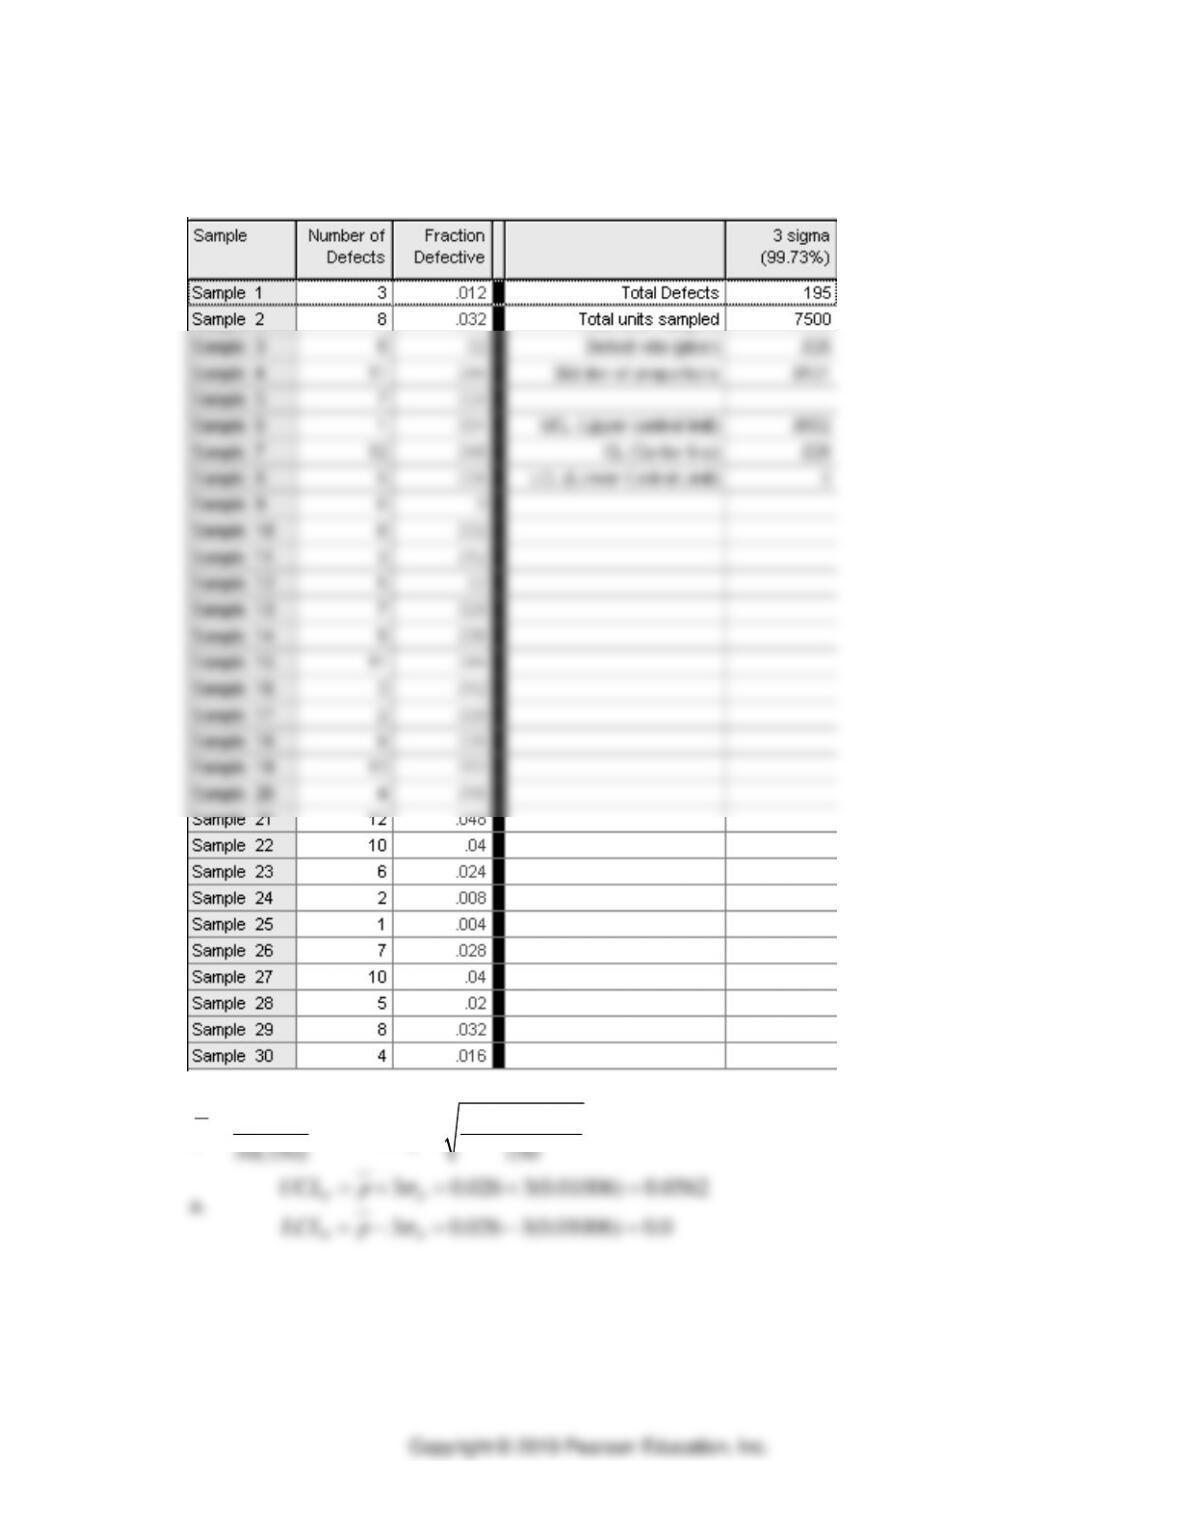
17. Data Tech Credit Card Service Company
Using POM for Windows we get the following p-chart results
From data in Table 3.5, assuming 3-sigma control limits
195 0.026(0.974)
0.026, 0.01006
30(250) 250
p
p
= = = =
3 0.026 3(0.01006) 0.0562
3 0.026 3(0.01006) 0.0
PP
PP
UCL p
LCL p
= + = + =
= − = − =