Chapter
3 Quality and Performance
Process performance and quality should be everyone’s concern.
TEACHING TIP
Introduce with QVC as one example of a company that met the challenge by designing and managing
processes that provide customers with total satisfaction. QVC’s relentless focus on quality and
exceeding customer expectations by placing them at the center of its business processes has paid off
handsomely.
TEACHING TIP
This chapter first addresses the costs of quality and then focuses on Total Quality Management and Six
Sigma, two philosophies and tools that many companies embrace to evaluate and improve quality and
performance. If possible, show the video case “Process Performance and Quality at Starwood Hotel &
Resorts”.
1. Costs of Quality
Any instance when a process fails to satisfy a customer is considered a defect.
Most experts estimate that the cost of quality range from 20 to 30 percent of gross sales.
These costs can be broken down into four major categories.
1. Prevention costs
a. Preventing defects before they happen
• Redesign the processes to remove causes of poor performance
• Redesign the service or product to make it simpler, easier to produce
• Training employees in methods of continuous improvement
• Working with suppliers to increase quality of purchased items or contracted services
b. Product or service requirements
2. Appraisal costs:
a. Costs incurred to identify and assess performance problems
• As prevention measures improve performance, appraisal costs decrease
b. Verification
c. Quality audits
d. Supplier ratings
3. Internal failure costs
a. Rework/Rectification—incurred if some aspect of a service or product must be performed
again.
b. Scrap—incurred if a defective item is unfit for further processing
c. Waste—incurred if unnecessary work is performed, errors occur, or communication and
organization is poor
TEACHING TIP
Mention an analysis of the viability of acquiring a company that is missing the company’s history of
environmental compliance, or poor paint finish on a car, as examples.
4. External failure costs
a. Costs when a defect is discovered after the customer receives the service or product.
5. Ethical Failure Costs
a. The societal and monetary costs associated with deceptively passing defective services or
products to internal or external customers such that it jeopardizes the well being of
stockholders, customers, employees, partners, and creditors
b. Deceptive business practice involves three elements:
c. Firms that engage in deception, however, undermine the ability and competence of their
employees and demean their relationship with external customers.
d. Ethical behavior falls on the shoulders of all employees of an organization
2. Total Quality Management and Six Sigma
1. Total quality management (TQM) is a philosophy the stresses three principles for
achieving high levels of process quality and performance.
(1) Customer satisfaction
(2) Employee involvement
(3) Continuous improvement in performance.
TEACHING TIP
TQM also involves a number of important elements covered in this text:
tools and process analysis techniques useful for solving, redesign, and improvement in Chapter 2
“Process Strategy and Analysis ”,Toyota Production System in Chapter 6 “Lean Systems” and
Problem–solving tools in Supplement A “Decision Making”
a. Customer satisfaction (internal or external): when customers’ expectations have been met
or exceeded.
• Conformance to specifications
It is the processes that produced the service or product that are really being
judged.
• Psychological impressions: atmosphere, image, or aesthetics
TEACHING TIP
Mention Managerial Practice 3.1 “Improving Quality Through Employee Involvement At Santa
Cruz Guitar Company”.Santa Cruz Guitar Company has invested heavily in its employees and
technology. All the way from selecting wood for its guitars to reducing variability and hiring the
best craftsmen it can find, Santa Cruz Guitar Company is focused on producing the highest
quality guitars in the world.
b. Employee involvement
• Cultural change
Challenge is to define customer for each employee
• Teams
Employee involvement is a key tactic for improving processes and quality
Small groups of people
c. Continuous Improvement
• Based on the Japanese concept, kaizen
• The philosophy of continually seeking ways to improve processes.
• Not unique to quality. Applies to process improvement as well.
Getting started
SPC training
Make SPC a normal aspect of daily operations.
2. Six Sigma
a. Relies heavily on the principles of TQM and is a comprehensive and flexible system for
achieving, sustaining, and maximizing business success by minimizing defects and variability in
processes.
b. It is driven by a close understanding of customer needs; the disciplined use of facts, data, and
statistical analysis; and diligent attention to managing, improving, and reinventing business processes.
TEACHING TIP
Discuss the roles of Motorola and GE.
c. Six Sigma: A comprehensive and flexible system for achieving, sustaining, and
maximizing business success by minimizing defects and variability in processes.
3. Acceptance Sampling
1. The application of statistical techniques to determine if a quality of material should be accepted or
rejected based on the inspection or test of a sample.
2. Acceptable quality level (AQL) is a statement of the proportion of defective items that will be
accepted.
3. In a supply chain, any company can be both a producer of goods purchased by another company
and a consumer of goods or raw materials supplied by another company.
a. The buyer’s specifications for various dimensions of quality become the targets the supplier
shoots for in a supply contract.
b. The supplier’s internal processes must be up to the task; TQM or Six Sigma can help achieve
the desired performance.
c. The buyer’s sampling plan will provide a high probability of accepting AQL (or better).
4. Supplement G, “Acceptance Sampling Plans,” in MyLab Operations Management shows how to
design an acceptance sampling plan that meets the level of risk desired.
4. Statistical Process Control
TEACHING TIP
Relate to tools discussed in Chapter 2: checklists, histograms and bar charts, Pareto charts,
scatter diagrams, cause-and-effect diagrams, and graphs.
Statistical process control (SPC): The application of statistical techniques to determine whether a
process is delivering what a customer wants. Control charts are primarily used to detect defects.
1. Examples of process change that can be detected by SPC
a. A decrease in the average number of complaints per day at a hotel
2. Variation of outputs
a. Performance measurements
• Variables — service or product characteristics measured on a continuous scale
Advantage: if defective, we know by how much — the direction and magnitude
of corrections are indicated.
Disadvantage: measurements typically involve special equipment, employee
skills, exacting procedures, and time and effort.
• Attributes — a characteristic counted in discrete units, (yes-no, integer number) that
could be quickly counted.
Used to determine conformance to complex specifications, or when measuring
variables is too costly.
b. Sampling
• Complete inspection
Used when
Costs of failure are high relative to costs of inspection.
Inspection is automated
• Sampling plans
(reference the central limit theorem described in statistics texts).
TEACHING TIP
It is important to distinguish the relationship between the distribution of sample means and the
process distribution itself
• sample range
• standard deviation
d. Common causes
• Random, or unavoidable sources of variation within a process.
TEACHING TIP
Mention, as an example, the time to process specimens at an intensive-care unit lab in a hospital.
• Characteristics of distributions
Location—measured by the mean of the distribution
Spread—measured by the range or standard deviation
Shape—whether the observations are symmetrical or skewed
e. Assignable causes
• Any cause of variation that can be identified and eliminated.
• Change in the mean, spread, or shape of a process distribution is a symptom that an
assignable cause of variation has developed.
• After a process is in statistical control, SPC is used to detect significant change,
indicating the need for corrective action.
3. Control charts
a. A control chart has a nominal value, or center line, which can be the process’s historic average
or a target that managers would like the process to achieve.
b. A sample characteristic measured above the upper control limit (UCL) or below the lower
control limit (LCL) indicates that an assignable cause probably exists.
c. Indicators of out of control conditions
• A trend in the observations (the process is drifting).
• A sudden or step change in the observations.
d. Two types of error are possible with the use of control charts
• Type I
• Type II
TEACHING TIP
If possible use Experiential Learning “Statistical Process Control with a Coin Catapult.” Exercise A:
Control Charts for Variables. Exercise B: Control Charts for Attributes
4. Control charts for variables used to monitor the mean and the variability of the process
distribution.
a. R-Charts (also known as range charts)
• Monitor process variability
RDLCL
R
3
=
b.
x
-Charts
• Used to see whether the process is generating an output, on average, consistent with a
target value set by management or with past performance.
• The process average is plotted on the – chart after the process variability is in
control.
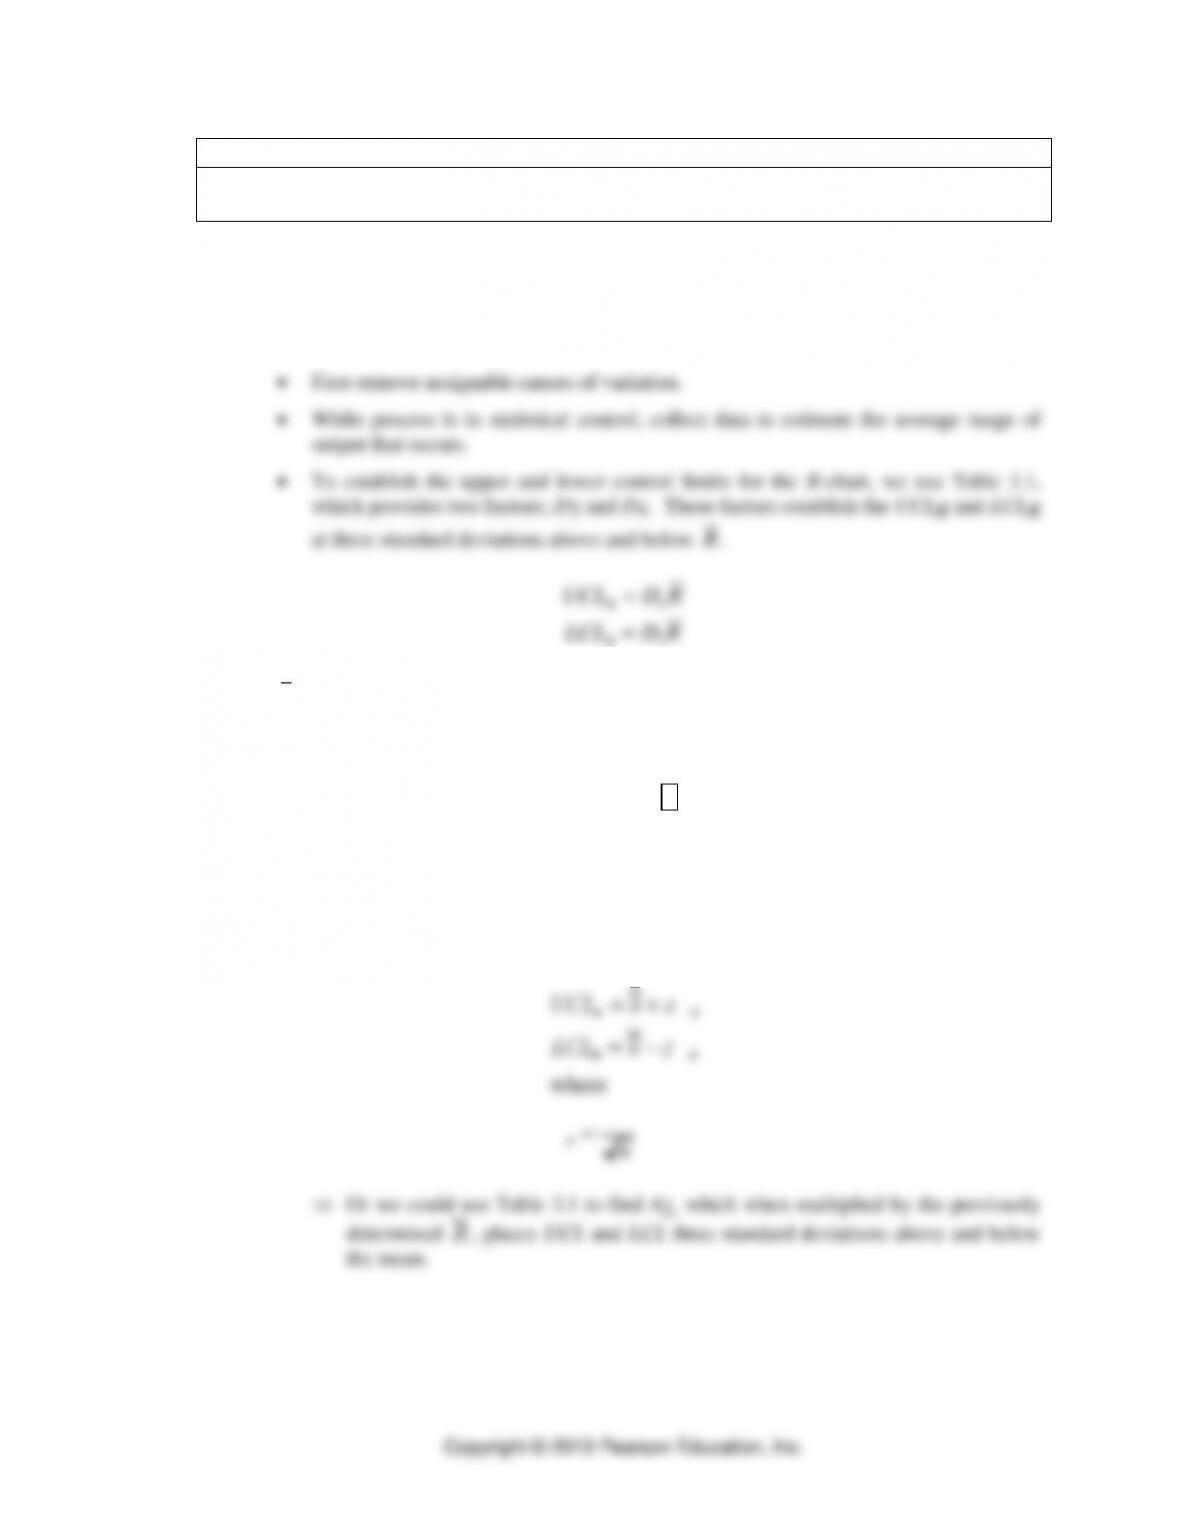
• The upper and lower control limits can be established in two ways.
• If the standard deviation of the process distribution is known, we could place UCL
and LCL at “z” standard deviations away from the mean, depending on the desired
confidence level.
UCLx =x+z
s
x
LCLx =x–z
s
x
where
s
x =
s
n
Or we could use Table 3.1 to find A2, which when multiplied by the previously
determined
R
, places UCL and LCL three standard deviations above and below
the mean.
• Using
x
– and R-charts to monitor a process
Construct the R-chart.
Compute the range for each sample.
Plot the ranges on the R-chart. If process is not in statistical control, find the
assignable causes and repeat the construction of the R-chart.
Construct
x
-chart.
Compute the mean for each sample.
Plot the sample means on the
x
-chart. If all sample means are within the control
limits, the process is in statistical control in terms of the process average. If the
process is not in statistical control, find the assignable cause and repeat the
construction of the
x
-chart.
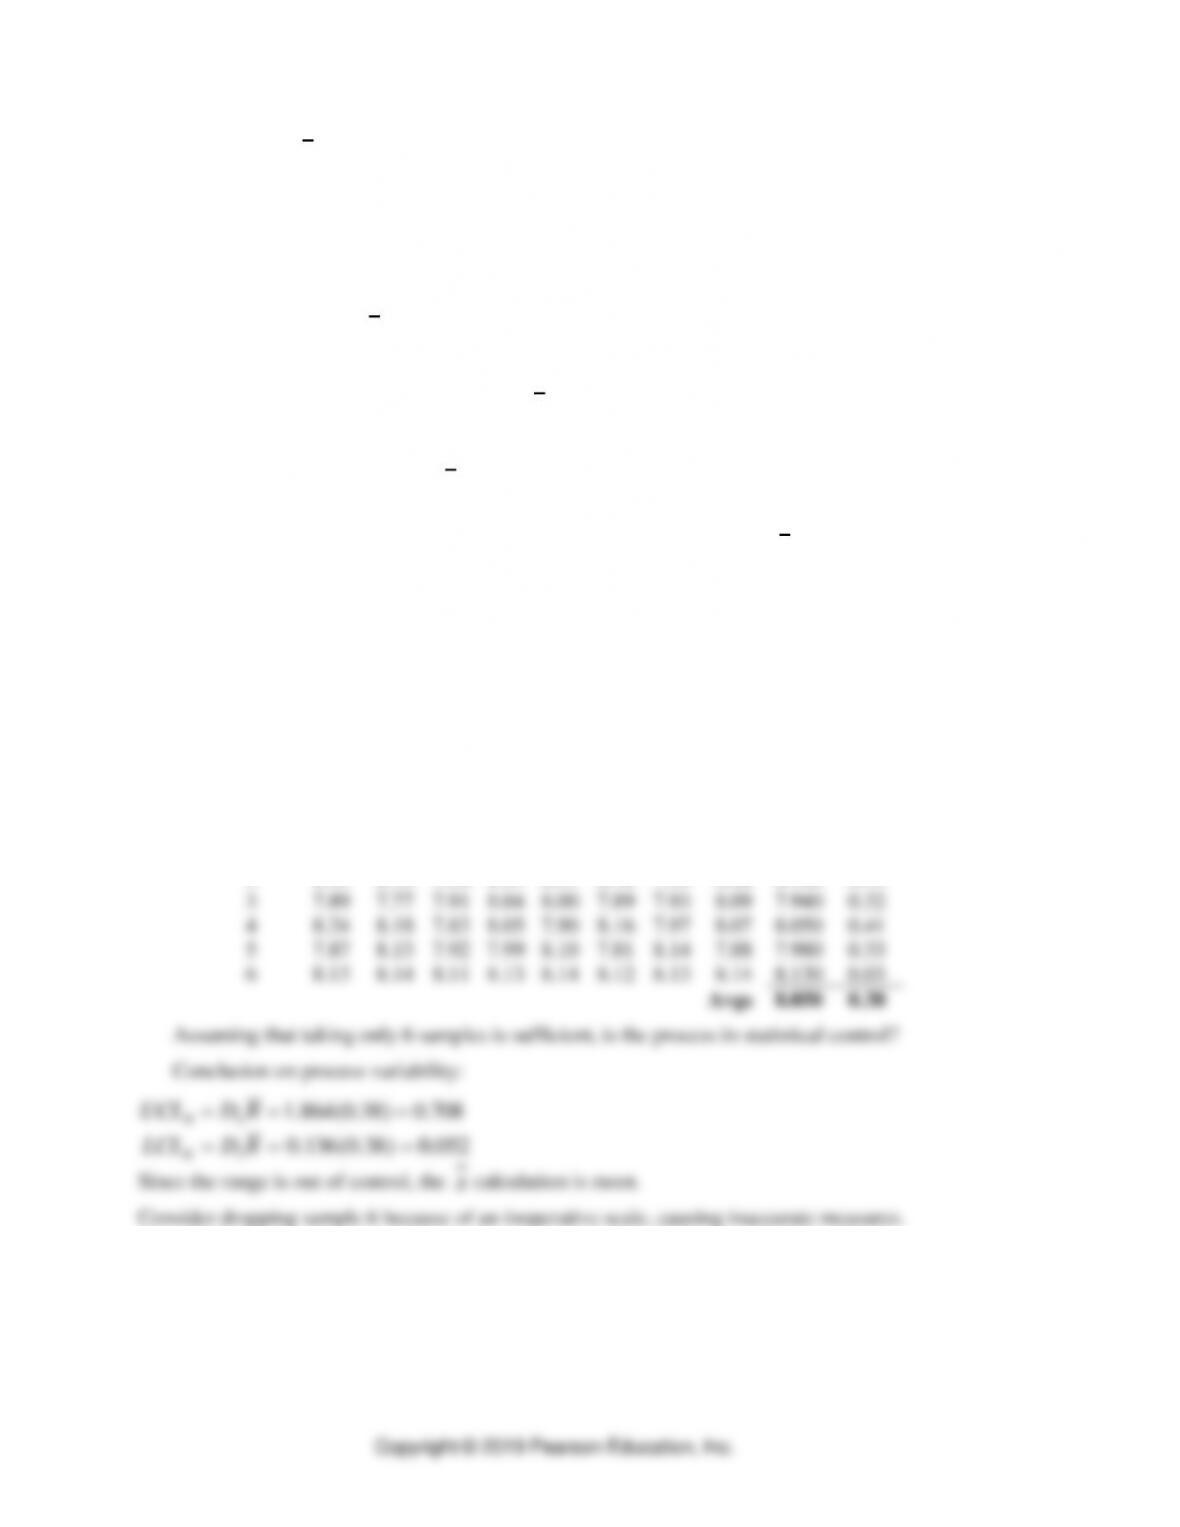
• Use Application 3.1: Control Charts for Variables to demonstrate the construction
of R– and x-bar charts. Since the range is out of control, the
x
calculation is moot.
Consider dropping sample 6 because of an inoperative scale that is causing inaccurate
measures. The resulting control charts indicate that the process is actually in
statistical control.
Webster Chemical Company produces mastics and caulking for the construction industry.
The product is blended in large mixers and then pumped into tubes and capped.
Webster is concerned whether the filling process for tubes of caulking is in statistical control.
The process should be centered on 8 ounces per tube. Several samples of eight tubes are taken
and each tube is weighed in ounces.
Tube Number
Sample
1
2
3
4
5
6
7
8
Avg
Range
1
7.98
8.34
8.02
7.94
8.44
7.68
7.81
8.11
8.040
0.76
2
8.23
8.12
7.98
8.41
8.31
8.18
7.99
8.06
8.160
0.43
3
7.89
7.77
7.91
8.04
8.00
7.89
7.93
8.09
7.940
0.32
4
8.24
8.18
7.83
8.05
7.90
8.16
7.97
8.07
8.050
0.41
5
7.87
8.13
7.92
7.99
8.10
7.81
8.14
7.88
7.980
0.33
6
8.13
8.14
8.11
8.13
8.14
8.12
8.13
8.14
8.130
0.03
Avgs
8.050
0.38
Tube Number
Sample
1
2
3
4
5
6
7
8
Avg
Range
1
7.98
8.34
8.02
7.94
8.44
7.68
7.81
8.11
8.040
0.76
2
8.23
8.12
7.98
8.41
8.31
8.18
7.99
8.06
8.160
0.43
3
7.89
7.77
7.91
8.04
8.00
7.89
7.93
8.09
7.940
0.32
4
8.24
8.18
7.83
8.05
7.90
8.16
7.97
8.07
8.050
0.41
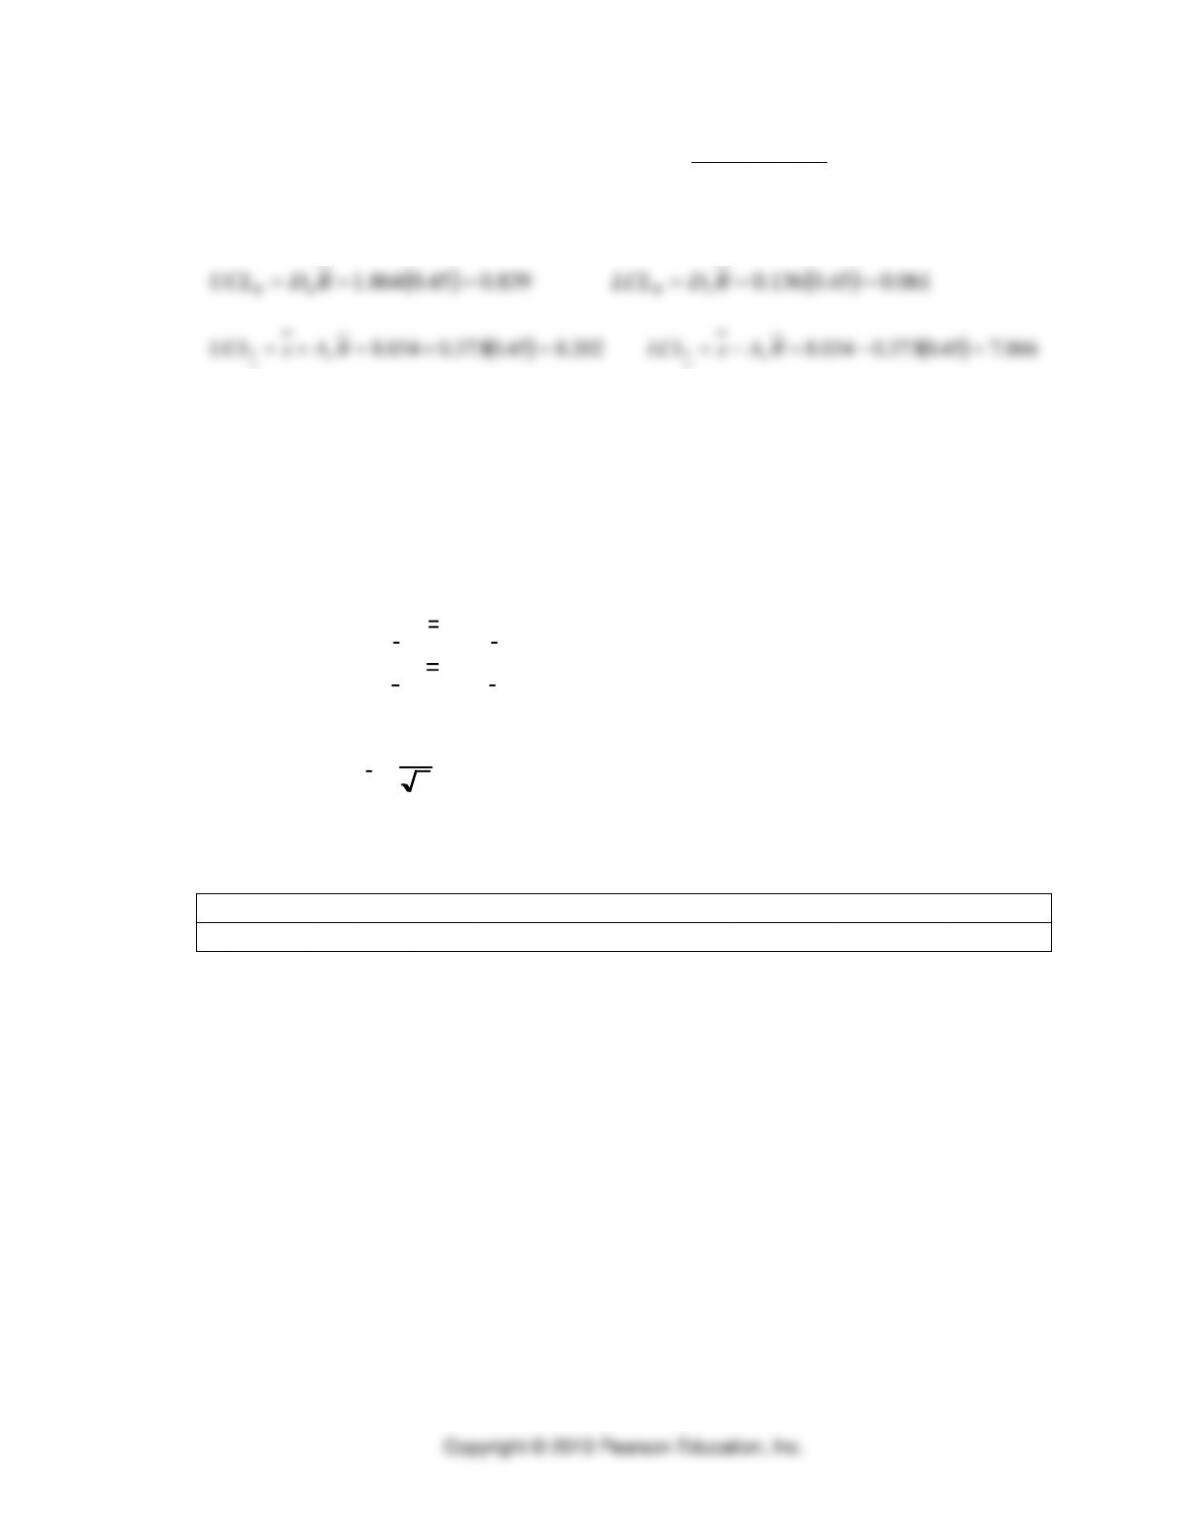
What is the conclusion on process variability and process average?
( ) ( )
061.045.0136.0839.045.0864.1 34 ====== RDLCLRDUCL RR
( ) ( )
866.745.0373.0034.8202.845.0373.0034.8 22 =−=−==+=+= RAxLCLRAxUCL xx
The resulting control charts indicate that the process is actually in control.
• Active Model 3.1 in MyLab Operations Management provides additional insight on
the x-bar and R-charts and their uses for the metal screw problem
• Tutor 3.1 in MyLab Operations Management provides a new example to practice the
use of x-bar and R-charts.
• If the standard deviation of the process distribution is known, the following form of
the x-bar chart may be used.
UCLx =x+z
s
x
LCLx =x–z
s
x
where
s
x =
s
n
5. Control charts for attributes
TEACHING TIP
Mention examples from banking and manufacturing. Emphasize that defects can be counted.
a. p-chart — used for controlling the proportion defective generated by the process
• Sampling for a p-chart involves a yes or no decision, based on the binomial
distribution
• Take a random sample of n units.
• Count the number of defectives.
• Proportion defective = number of defectives ÷ sample size
• Plot sample proportion defective on a chart. If it is outside the range between the
upper and lower control limits, search for an assignable cause. If a cause is found, do
not use these data to determine the control limits.
5
7.87
8.13
7.92
7.99
8.10
7.81
8.14
7.88
7.980
0.33
Avgs
8.034
0.45
Copyright © 2019 Pearson Education, Inc.
s
p=p 1–p
( )
n
• Two things to note:
The lower control limit cannot be negative
When the number of defects is less than the LCL, then the system is out of
control in a good way. We want to find the assignable cause. Find what was
unique about this event that caused things to work out so well.
• Use Application 3.2: p-Chart for Attributes for an example of a p-chart problem.
The short answers are:
p=0.025;UCLp=0.064;LCL p=0; IN CONTROL
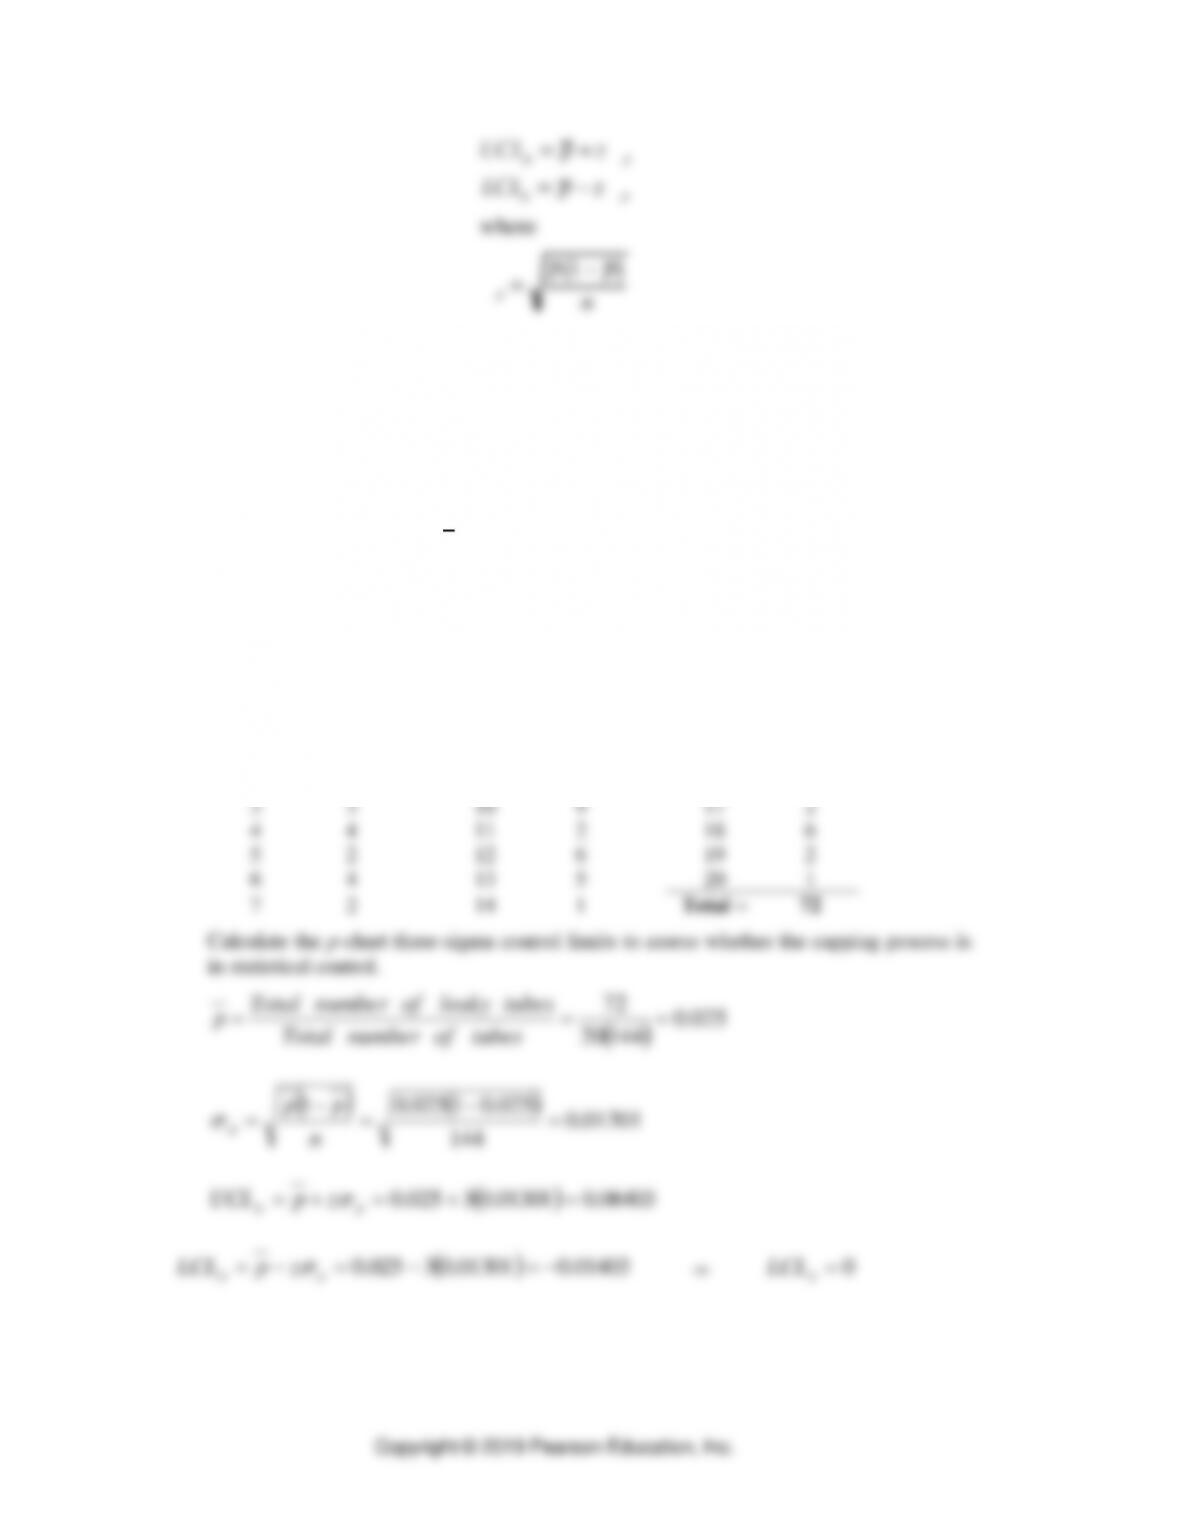
A sticky scale brings Webster’s attention to whether caulking tubes are being properly
capped. If a significant proportion of the tubes aren’t being sealed, Webster is placing
their customers in a messy situation. Tubes are packaged in large boxes of 144. Several
boxes are inspected and the following numbers of leaking tubes are found:
Sample
Tubes
Sample
Tubes
Sample
Tubes
1
3
8
6
15
5
2
5
9
4
16
0
3
3
10
9
17
2
4
4
11
2
18
6
5
2
12
6
19
2
6
4
13
5
20
1
7
2
14
1
Total =
72
Calculate the p-chart three-sigma control limits to assess whether the capping process is
in statistical control.
( )
025.0
14420
72 === tubesofnumberTotal
tubesleakyofnumberTotal
p
( )
( )
01301.0
144
025.01025.0
1=
−
=
−
=n
pp
p
( )
06403.001301.03025.0 =+=+= pp zpUCL
( )
01403.001301.03025.0 −=−=−= pp zpLCL
0=
p
LCL
• Active Model 3.2 in MyLab Operations Management provides additional insight on
the p-chart and its uses for the booking services department
• Tutor 3.2 in MyLab Operations Management provides a new example to practice the
use of p-charts.
b. c-chart — used for controlling the number of defects when more than one defect can be
present in a service or product
TEACHING TIP
Mention bubbles in a TV picture tube, accidents at an intersection, and complaints from one
patron at a hotel.
• Take a random sample of one.
• Inspect the quality attribute.
• Count the number of defects.
UCLc=c +z
s
c
LCLc=c –z
s
c
where
s
c=c
• Plot the number of defectives on a chart. If it is outside the range between the upper
and lower control limits, search for the assignable cause. If a cause is found do not
use these data to determine the control limits.
The Poisson distribution mean and standard deviation are both described using
the same number,
c
. The mean equals
c
, and the standard deviation equals
c
.
We set upper and lower control limits in a manner similar to p-charts.
Use Application 3.3: c-Chart for Attributes for an example of a c–chart.
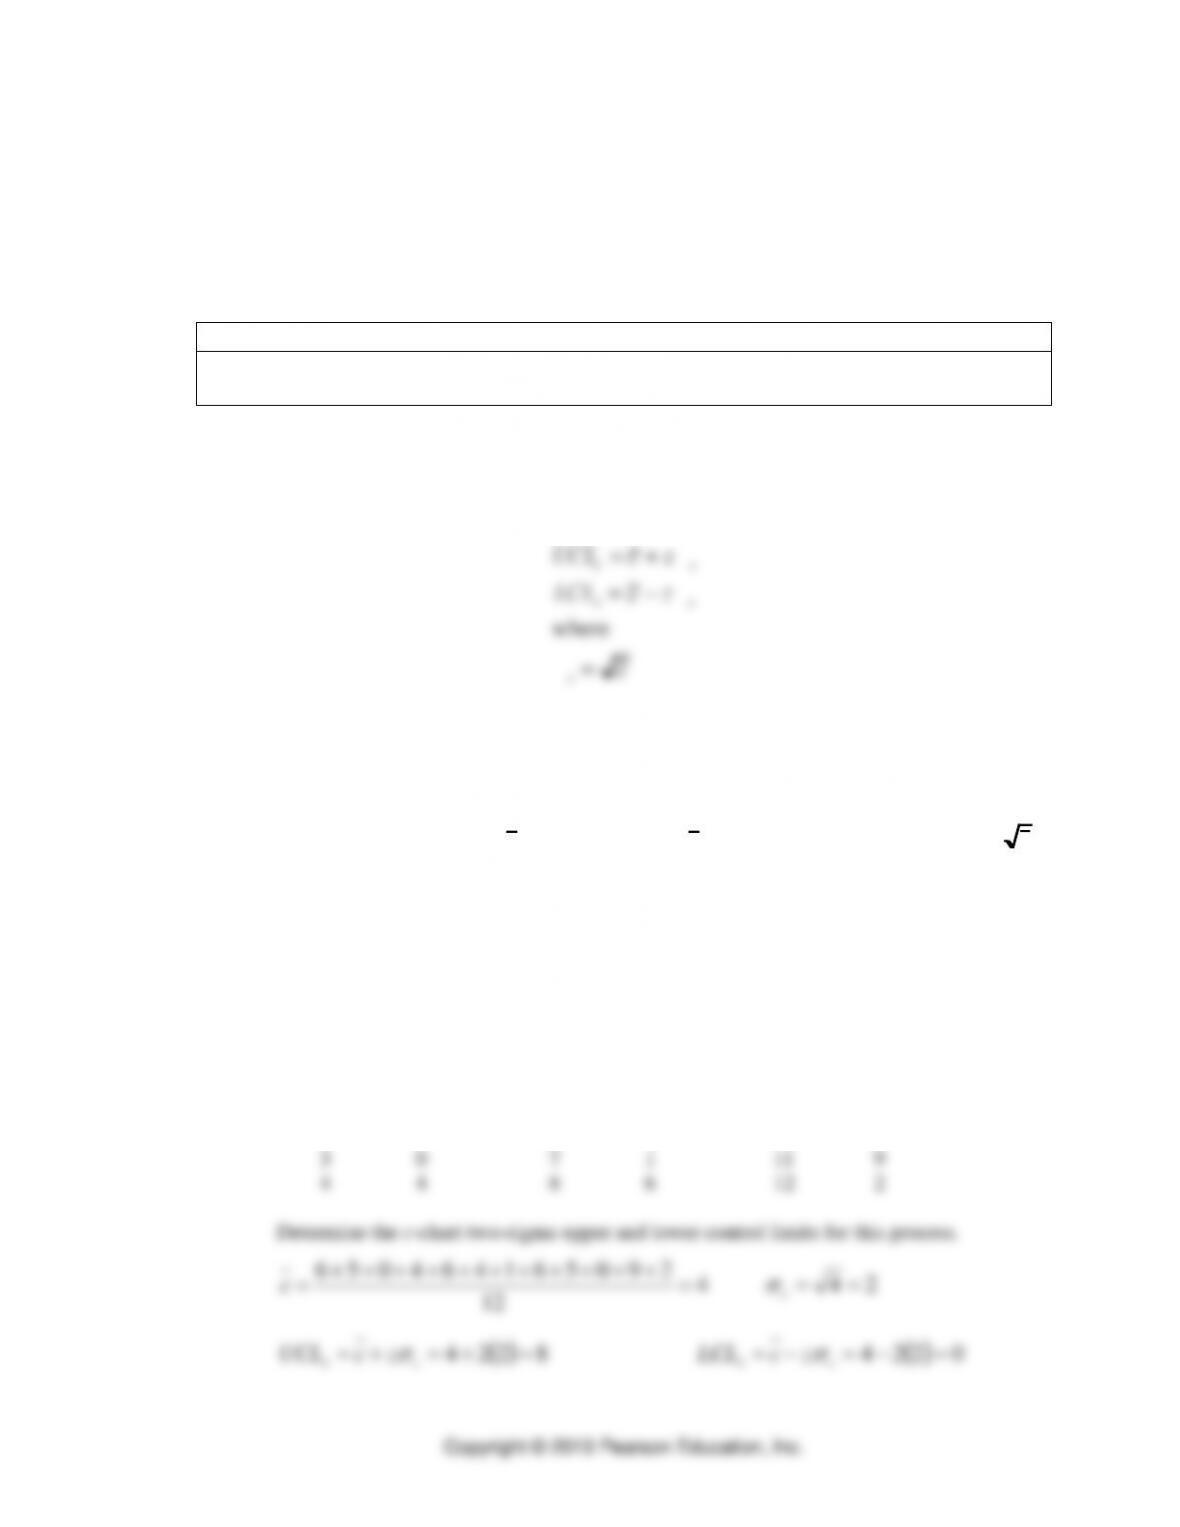
At Webster Chemical, lumps in the caulking compound could cause difficulties in
dispensing a smooth bead from the tube. Even when the process is in control, there will
still be an average of 4 lumps per tube of caulk. Testing for the presence of lumps
destroys the product, so Webster takes random samples. The following are results of the
study:
Tube #
Lumps
Tube #
Lumps
Tube #
Lumps
1
6
5
6
9
5
2
5
6
4
10
0
3
0
7
1
11
9
4
4
8
6
12
2
Determine the c–chart two-sigma upper and lower control limits for this process.
4
12
290561464056 =
+++++++++++
=c
24 ==
c
( )
8224 =+=+= cc zcUCL
( )
0224 =−=−= cc zcLCL
Copyright © 2019 Pearson Education, Inc.
• Tutor 3.3 in MyLab Operations Management provides a new example to practice the
use of c-charts.
5. Process Capability
A process that is in statistical control may not be producing services or products according to their
design specifications because control limits are based on the mean and variability of the sampling
distribution, not the design specifications.
TEACHING TIP
This is an important point that is difficult for the students.
1. Defining process capability
a. Process capability is the relationship between a process distribution and the upper and lower
specifications.
• Use Figure 3.13(a) to show a capable process – the extremes of the process distribution
fall within the upper and lower specifications.
• Use Figure 3.13(b) to show a non-capable process.
b. Use Figure 3.14 to show what reducing variability implies for a process.
• The firm with two-sigma quality produces 4.56 percent defects, or 45,600 defects per
million.
• The firm with four-sigma quality produces only 0.0063 percent defects, or 63 defects per
million.
c. Process capability index
• An index that measures the potential for a process to generate defective outputs relative to
either upper or lower specifications.
• The process capability index is
−−
=
3
ionSpecificatUpper
,
3
ionSpecificatLower
ofMinimum xx
Cpk
• If the process capability index is less than the target value, the process center is too
close to one of the specification limits or the process variability is too great, and the
process may generate too many defects.
• The capability index will always be less than or equal to the capability ratio. Cpk can
be used as a first check; if it passes the test, the process can be declared capable. If it
does not pass, Cp must be calculated to see if process variability is a source of the
problem.
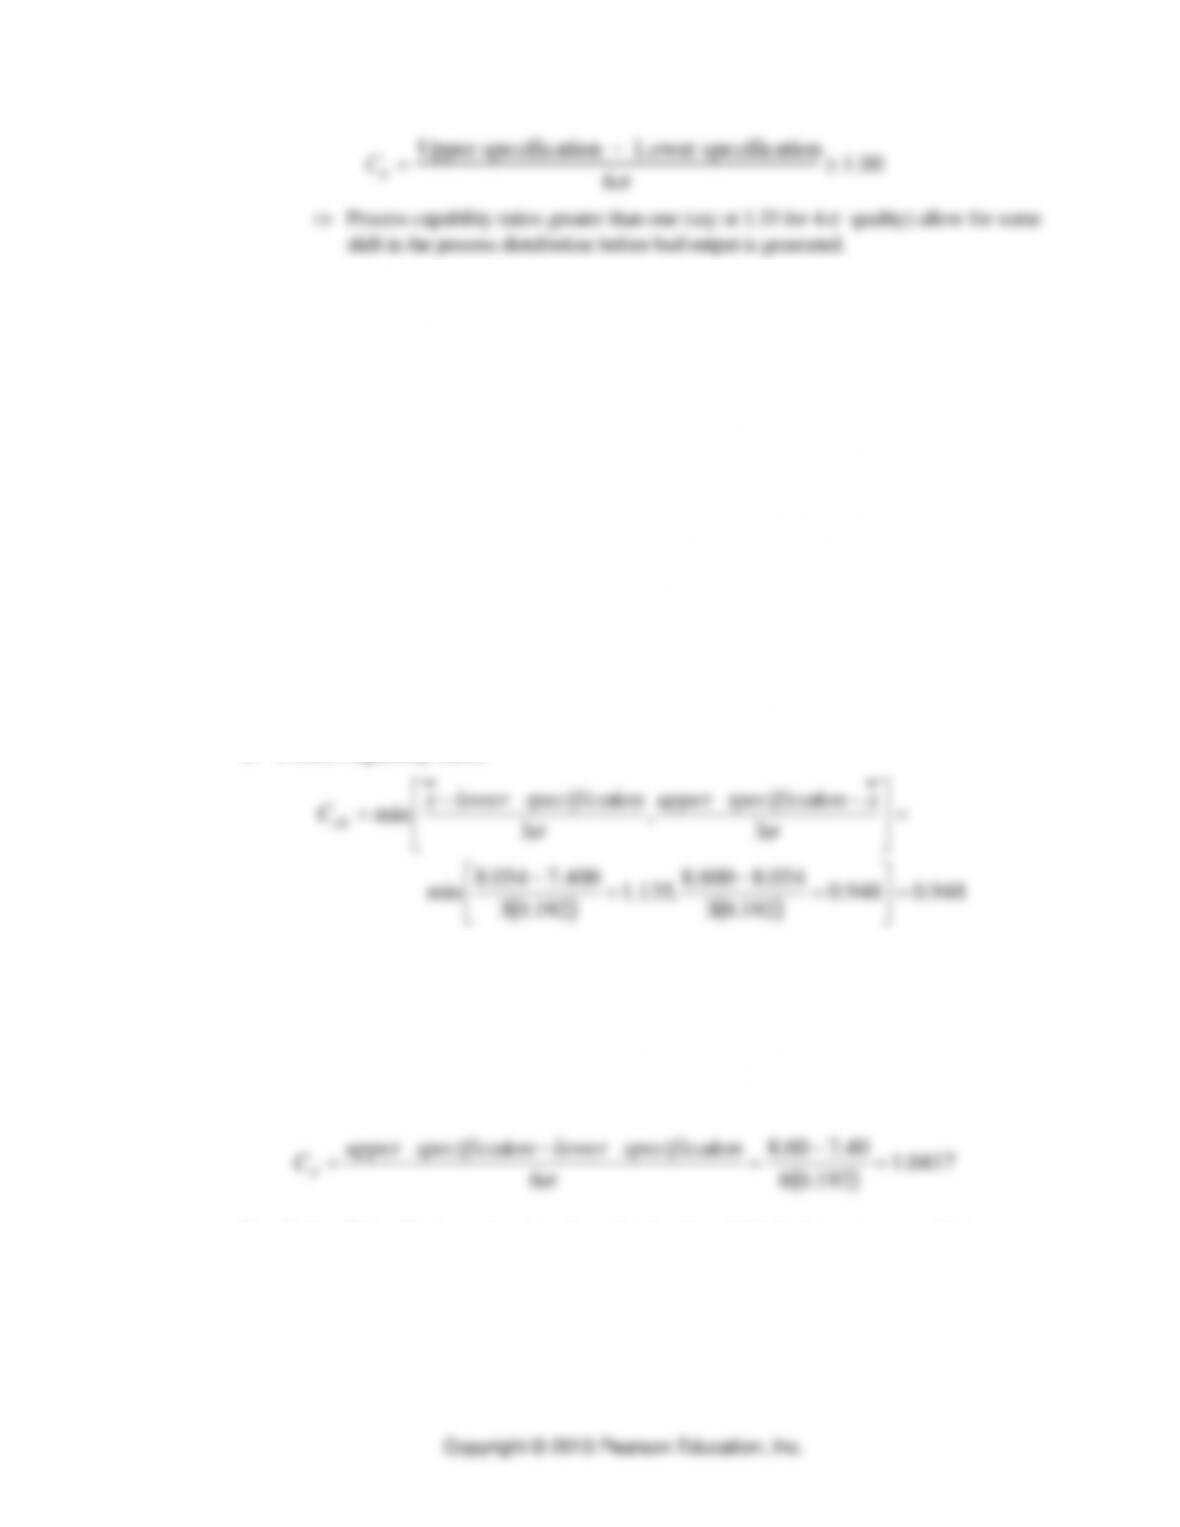
d. Process capability ratio
• Compares the tolerance width (upper spec – lower spec) to the variability of actual process
outputs. The portion of a distribution within ± 3
of the mean will include the vast
majority (99.74%) of the actual process outputs.
• The process is capable at the three-sigma level when the ratio
Copyright © 2019 Pearson Education, Inc.
2. Using continuous improvement to determine the capability of a process.
a. Step 1. Collect data, calculate mean and standard deviation for the process.
b. Step 2. Construct the process control charts.
c. Step 3. Compare the random samples to the control limits. Eliminate the assignable causes
and recalculate the control limits as appropriate until 20 consecutive random samples fall
within the control limits. This indicates that the process is in statistical control.
d. Step 4. Calculate the process capability index first, and then the capability ratio if needed. If the
process is capable, document changes to the process and monitor the output using control
charts. If it is not capable, eliminate the causes of off-center production or too much variation
and recalculate the control limits. Return to step 3.
3. Use Application 3.4: Process Capability Analysis
Webster Chemical’s nominal weight for filling tubes of caulk is 8.00 ounces ± 0.60 ounces.
The target process capability ratio is 1.33, signifying that management wants 4-sigma
performance. The current distribution of the filling process is centered on 8.054 ounces with
a standard deviation of 0.192 ounces. Compute the process capability index and process
capability ratio to assess whether the filling process is capable and set properly.
a. Process capability index:
( ) ( )
948.0948.0
192.03
054.8600.8
,135.1
192.03
400.7054.8
min
3
,
3
min
=
=
−
=
−
=
−−
=
xionspecificatupperionspecificatlowerx
Cpk
Recall that a capability index value of 1.0 implies that the firm is producing three-sigma
quality (0.26% defects) and that the process is consistently producing outputs within
specifications even though some defects are generated. The value of 0.948 is far below the
target of 1.33. Therefore, we can conclude that the process is not capable. Furthermore, we
do not know if the problem is centering or variability.
b. Process capability ratio:
( )
0417.1
192.06
40.760.8
6=
−
=
−
=
ionspecificatlowerionspecificatupper
Cp
Recall that if the Cpk is greater than the critical value (1.33 for four-sigma quality) we can
conclude that the process is capable. Since the Cpk is less than the critical value, either the
process average is close to one of the tolerance limits and is generating defective output, or
the process variability is too large. The value of Cp is less than the target for four-sigma
quality. Therefore we conclude that the process variability must be addressed first, and then
the process should be retested.
c. Active Model 3.3 in MyLab Operations Management provides additional insight
on the process capability problem at the intensive care unit lab.
d. Tutor 3.4 in MyLab Operations Management provides a new example to practice
the process capability measures.
6. International Quality Documentation Standards and Awards
1. ISO 9001:2008 documentation standards
a. address quality management by specifying what the firm does to fulfill the customer’s quality
requirements and applicable regulatory requirements
b. aims to enhance customer satisfaction
TEACHING TIP
Mention well-known companies who have received the award.
a. Established in 1987
b. Named for Secretary of Commerce Malcolm Baldrige
c. Improved quality as a means of reducing the trade deficit
d. Learn strengths and weaknesses and find ways to improve operations
e. Seven criteria
• Leadership
• Strategic Planning
7. Systems Approach to Total Quality Management
1. Quality requires a systems approach to be effective and underpins TQM.
2. Organizational components required to build a culture of quality:
a. Continuous improvement
b. Employee involvement
c. Management commitment and leadership
d. Analytical process thinking
e. Failure in managing the intersections between the four pillars is where most companies fall short in
achieving their quality objectives