Process Strategy and Analysis ⚫ CHAPTER 2 ⚫
2-21
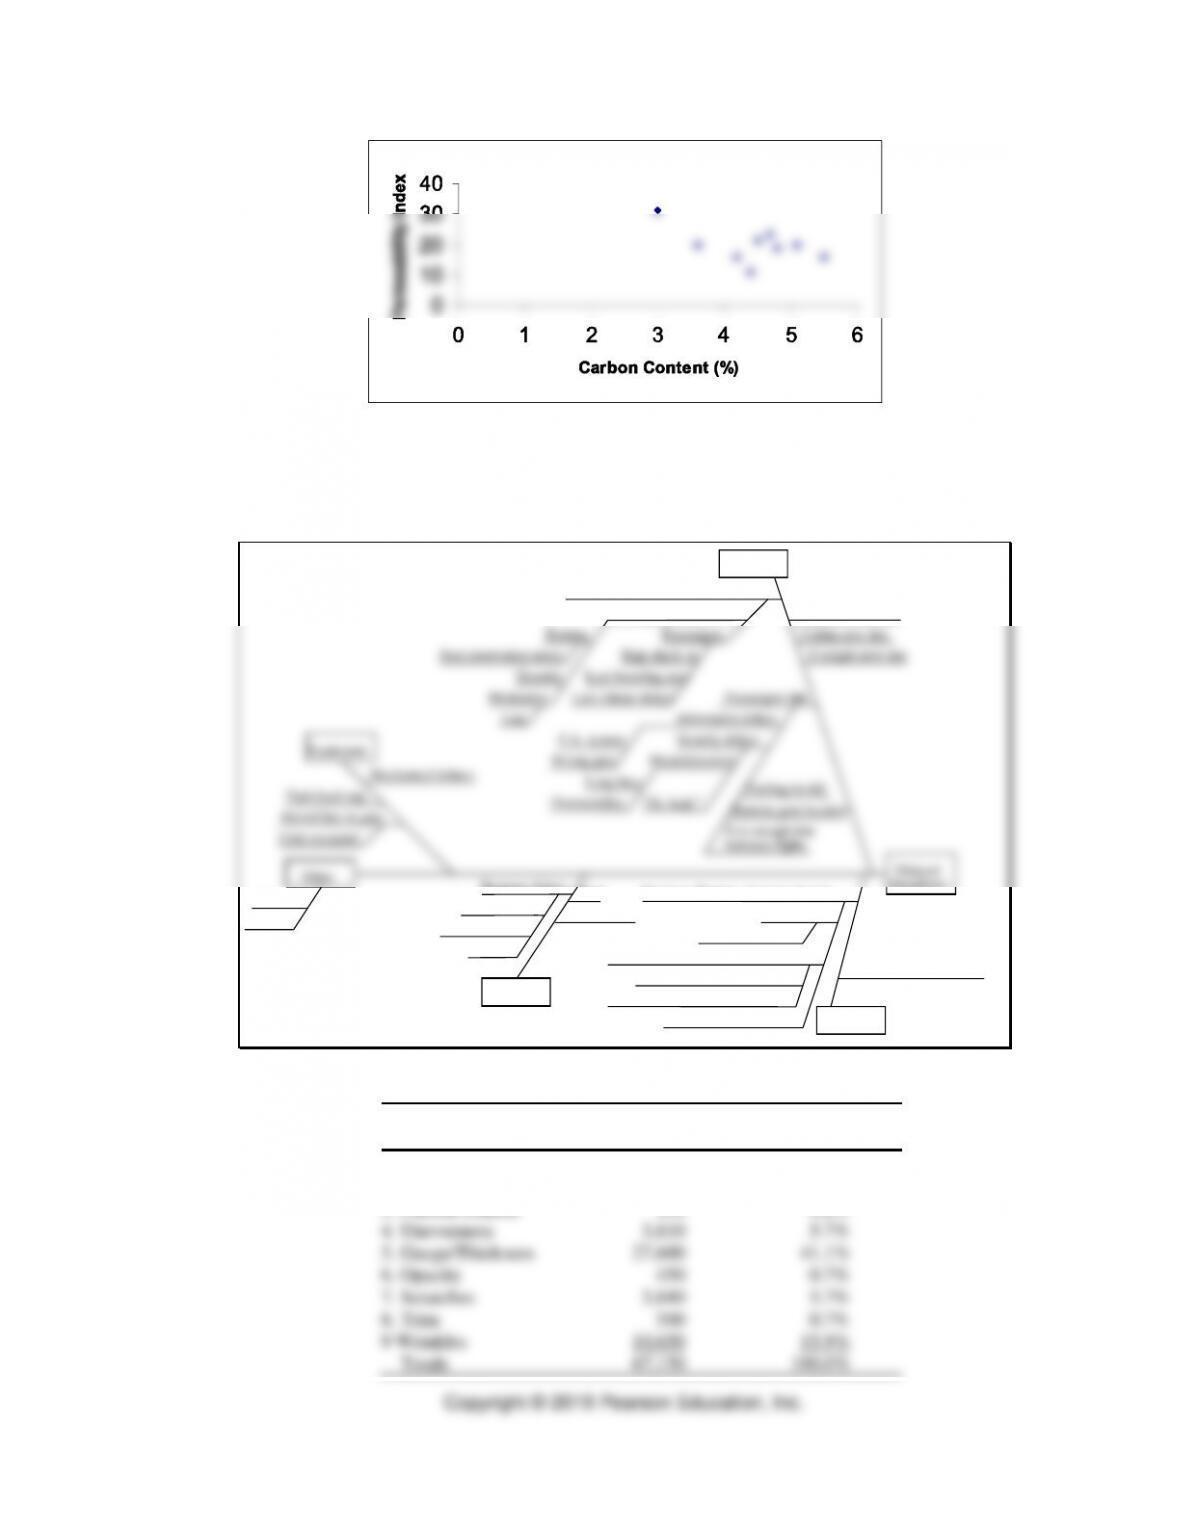
b. Correlation coefficient
0.547
=−
. There is a negative relationship between
permeability and carbon content, although it is not too strong.
c. Carbon content must be increased to reduce permeability index.
29. Superfast Airlines. One of many possible cause-and-effect diagrams follows.
Personnel
Passenger processing delays at gate
Gate agents
Training
Seat reservation errors
Quantity
Motivation
Late
Passengers
Skip check-in
Lost boarding pass
Last–minute delays
Cabin cleaners late
Cabin crew late
Cockpit crew late
Passengers late
Information delays
P.A. system
Wrong gate
Long lines
Oversensitive
Security delays
Metal detectors
“Hi, Jack!”
Parking lot full
Remote gate location
Not enough time
between flights
Delayed
departures
Other
Equipment
Mechanical failures
Push–back tug
Aircraft late to gate
Gate occupied
Desire to fill plane, increase income
Overbooking
Baggage delays
Skis, golf clubs
Baggage system
Carry-on
Food service
Bumped passengers
Desire to accommodate late passengers
Acceptance of late passengers
Cutoff too close to departure time
Weight and balance sheet
Standby boarding process Procedures
Fuel
Materials
Air traffic
Weather
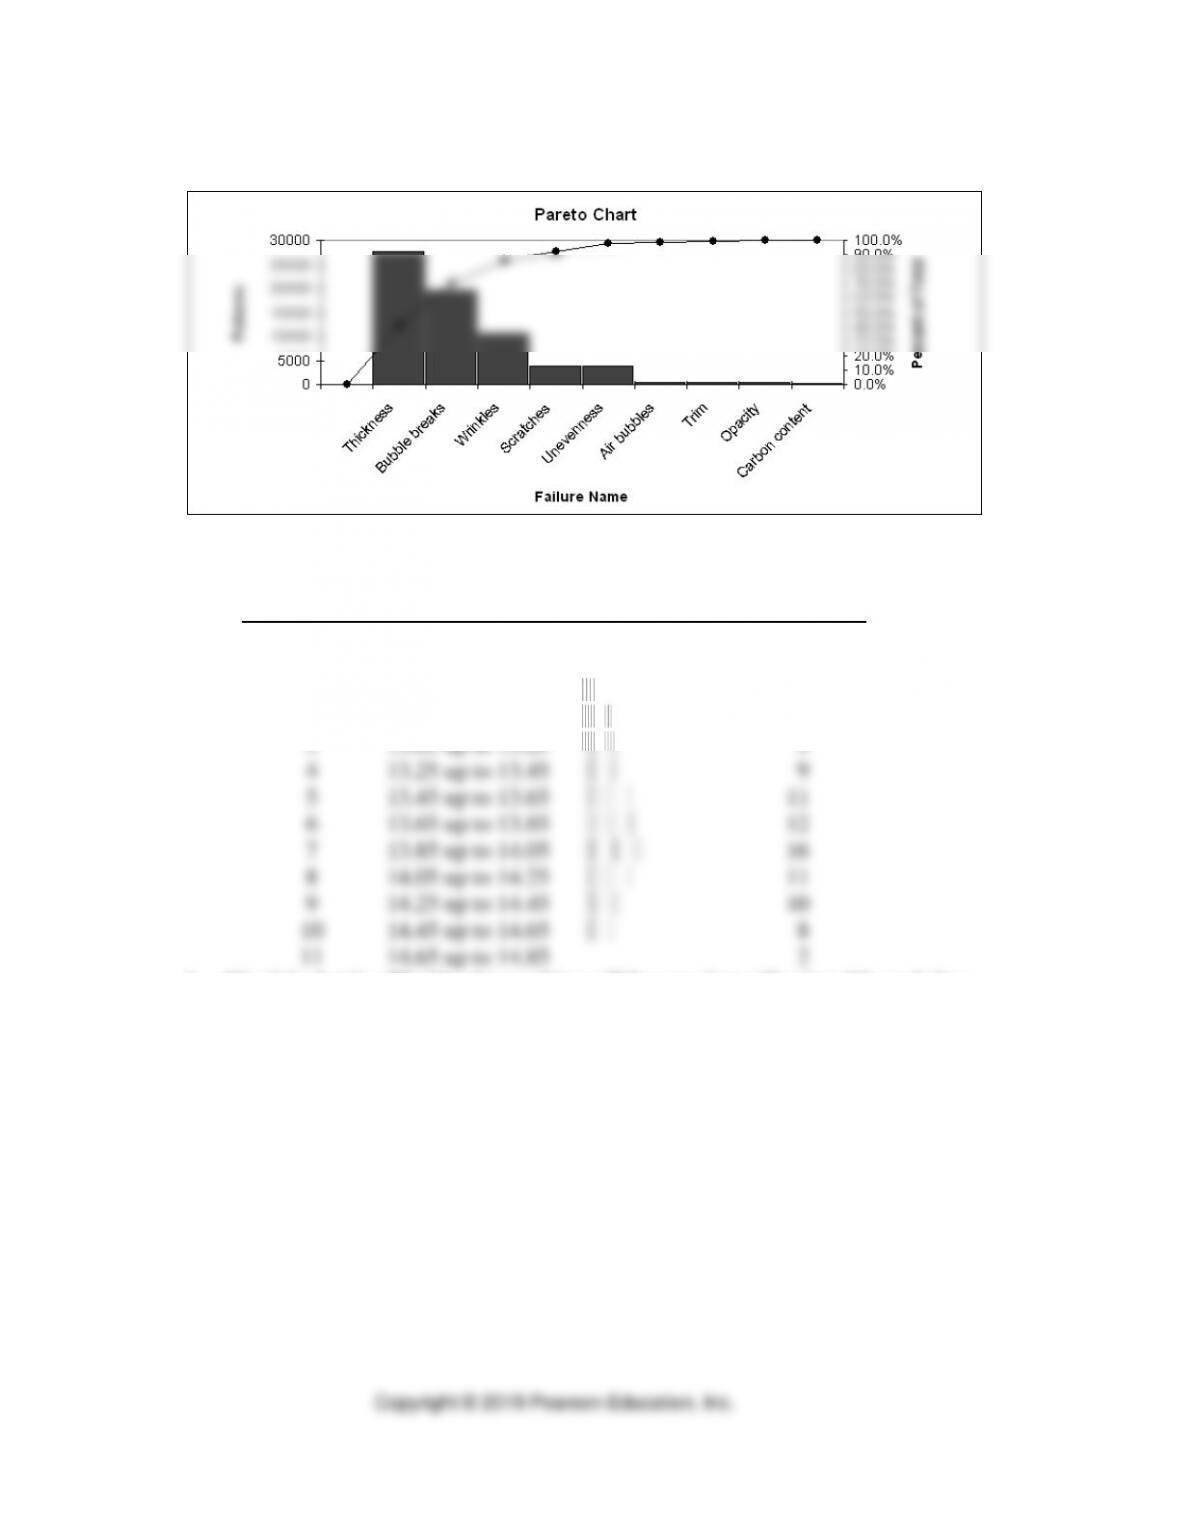
30. Plastomer, Inc.
10,650
Totals
67,150
100.0%
⚫ PART1 ⚫ Managing Processes
2-22
The following Pareto chart was created using the Bar, Pareto, and Line Charts
Solver of OM Explorer.
Management should attempt to improve the “thickness/gauge” problem first.
31. Shampoo bottling company
a. The tally of data into cells will be as follows.
Cell
Cell
Tally
Frequency
Number
Boundaries
1
12.65 up to 12.85
4
2
12.85 up to 13.05
8
3
13.05 up to 13.25
9
4
13.25 up to 13.45
9
5
13.45 up to 13.65
11
6
13.65 up to 13.85
12
7
13.85 up to 14.05
16
8
14.05 up to 14.25
11
9
14.25 up to 14.45
10
10
14.45 up to 14.65
8
11
14.65 up to 14.85
2
b. 4% of the bottles filled by the machine will be out of specification;4% are below
the lower limit, and none are above the upper limit. NOTE: If you turn the
table 90 degrees counterclockwise, the tallies create a histogram.
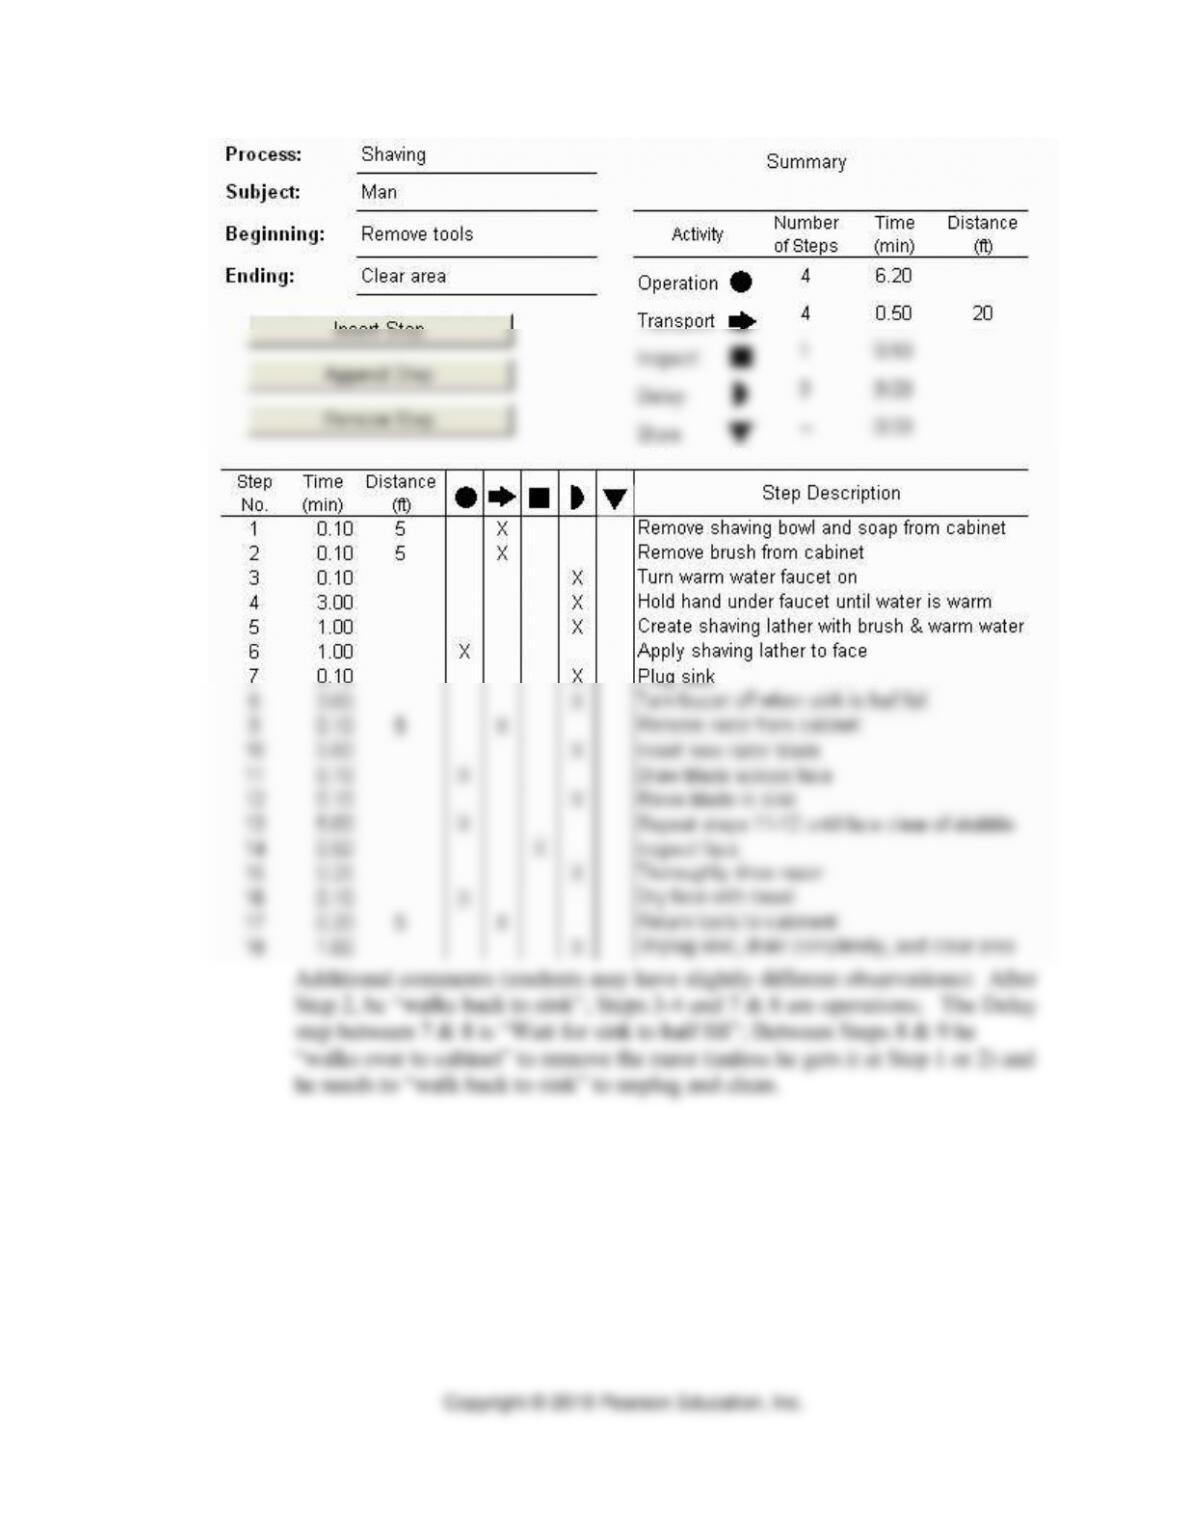
32. Team exercise on shaving
a. One possible solution would look like this:
Process Strategy and Analysis ⚫ CHAPTER 2 ⚫
2-23
⚫ PART1 ⚫ Managing Processes
2-24
b. Some ideas generated from brainstorming the process:
1. Leave bowl, soap, razor, and brush
on the counter.
2. Turn water on first.
3. Buy new water heater so water
warms faster.
4. Use shaving cream or gel.
5. Shave in the shower.
6. Plug sink before turning water on.
7. Run water while shaving instead
of plugging and filling sink.
8. Fill sink one-fourth full instead of
half full.
9. Use disposable razor or electric
razor.
10. Replace razor every other day.
11. Grow a mustache, beard, or goatee
to reduce shaving time.
12. Go to a barber.
13. Let face air dry.
14. Use cold water.
15. Do not inspect the face but shave
accurately the first time.
16. Shave every other day.
17. Don’t rinse blade each time.
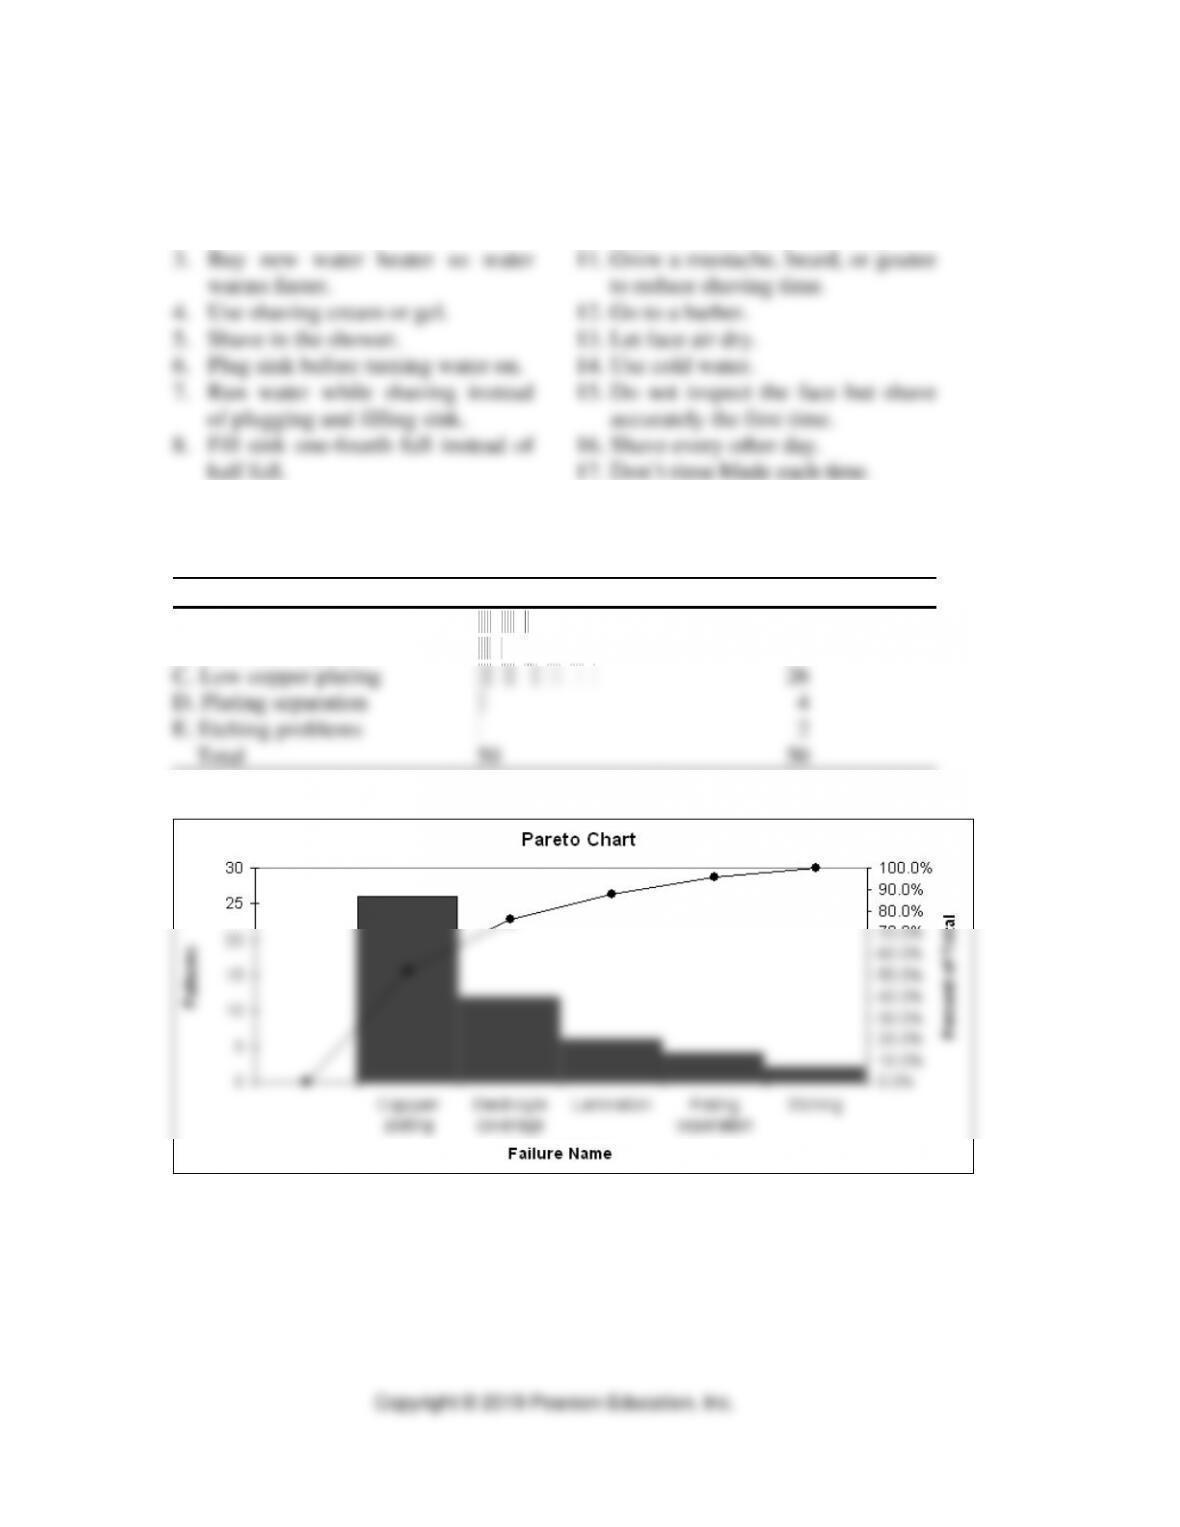
33. Conner Company
a. Tally sheet
Type of Failure
Tally
Number of Rejected Boards
A. Poor electrolyte coverage
12
B. Lamination problems
6
C. Low copper plating
26
D. Plating separation
4
E. Etching problems
2
Total
50
50
b. Pareto chart, from OM Explorer.
Process Strategy and Analysis ⚫ CHAPTER 2 ⚫
Copyright © 2019 Pearson Education, Inc.
2-25
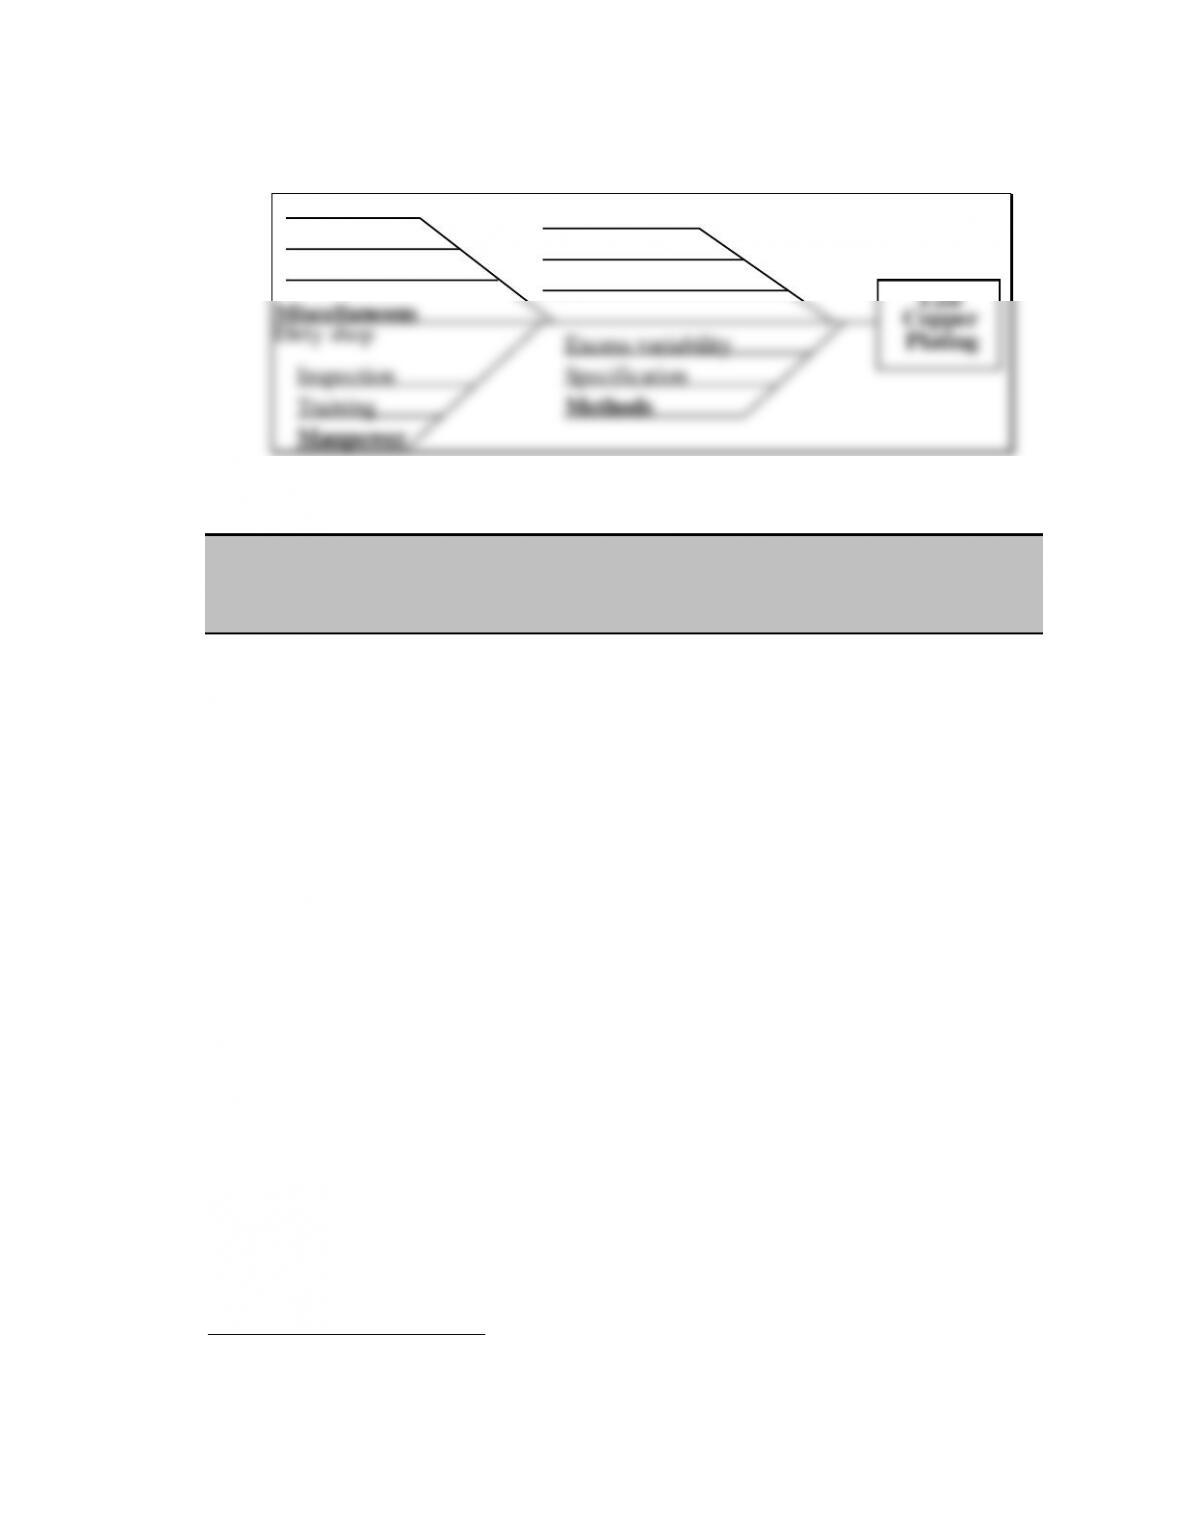
c. Cause-and-effect diagram (Note: several alternative ideas are possible here.)
Dirty shop
Manpower
Machines
Voltage stability
Materials
Composition
Excess variability
Methods
Copper
Setting
Inspection Specification
Training
Miscellaneous
Vendor
Plating
Low
CASE : CUSTOM MOLDS, INC. *
A. Synopsis
Custom Molds, Inc. is a small fabricator of custom-designed molds that are used in
injection molding machines to make plastic parts. Its major customers are in the
electronics industry where large volumes of plastic connectors are used. The
company has recently noticed a shift in its market as the total demand for molds has
declined, but the requests for molded parts have increased. In response to this shift,
Custom Molds, Inc. has expanded its operations to include the manufacture of
plastic parts. The case provides students with the opportunity to analyze the
different processes associated with mold fabrication and parts production and to
discuss the interaction between process management decisions and competitive
priorities.
B. Purpose
The purpose of this case is to focus the student on issues relating to process strategy
and to discuss how decisions involving process structure, customer involvement,
resource flexibility, and capital intensity interact with different competitive
priorities. Students need to resolve what it will take to compete effectively in each
of Custom Molds’ markets and how best to configure its processes. One needs to
consider specific issues:
1. There are two distinctly different processes taking place in the same facility.
The students should diagram each process (see flowcharts in Chapter 2) and
compare/contrast the strengths and weaknesses of each.
* This case was prepared by Dr. Brooke Saladin, Wake Forecast Univeristy, as a basis for classroom
discussion.

⚫ PART1 ⚫ Managing Processes
2-26
2. The different processes serve different customer needs. Mold fabrication
requires flexibility and quality where parts manufacturing competes on
delivery and low cost. The margin for parts is much smaller.
3. Although the number of orders has remained relatively stable, the volume
per order for parts has increased significantly over the last three years. This
increase has caused bottlenecks in the shop and has led to late deliveries of
parts.
4. The change in sales mix has created excess capacity in mold fabrication, and
the owner has relegated one of the master machinists to the role of expediter.
C. Analysis
Students should begin their analysis by examining the market trend data in the two
tables in the case. These data clearly show that although the number of orders
received over the three-year period for molds has remained constant, the total
number of molds fabricated has shown a declining trend: 722 in 2015, 684 in 2016,
and 591 in 2017. With 13 master machinists employed, mold fabrication capacity
can be estimated at
13 machinists 250 days/year 5 days/mold
or 650 molds fabricated/year
Another way to look at the excess capacity question is that each master machinist
working 250 days per year, averaging five days’ processing time per mold
fabricated, can produce 50 molds per year. At a current demand rate of 591, only 12
master machinists are required.
Process Strategy and Analysis ⚫ CHAPTER 2 ⚫
2-27
Mold Fabrication
Parts Manufacturing
Job process
Line process
High customer contact
Less-skilled labor
High-skilled labor
More capital intensive
Divergent processes
Less-divergent process
D. Recommendations
At this stage, early in an operations management course, specific recommendations
will be difficult for students and should not be the primary focus. The instructor
should look for general recommendations concerning: (1) capacity decisions and
the allocation of production resources; (2) the possible orientation toward either
molds fabrication or parts manufacturing; and (3) the physical separation and
focusing of each distinct process. A sample student response to the discussion
questions that follow will give (Exhibit TN.1) some idea of what to expect from a
student in an introductory course in operations and supply chain management
course.
E. Teaching Strategy
This case is designed to be used early in the course. A primary focus is to expose
the students to the concept of flowcharting processes and using the flowcharts to
analyze the strengths and weaknesses of the processes. A second focus is to show
the students the impact that process choice decisions have on the ability of the
company to compete on different competitive priorities.
For best results the instructor should assign this case as a homework assignment.
Students should come to class prepared to share their process flow diagrams. The
the board. This, however, is a good exercise for students to be involved in, as they
⚫ PART1 ⚫ Managing Processes
2-28
learn that flowcharts for even seemingly simple processes may be more difficult to
develop than they thought.
EXHIBIT TN.1
Custom Molds, Inc. Student Responses
Question 1
The Millers face a changing market environment for their two product lines—molds and
plastic parts—a problem that they must address. The mold market is in the mature phase.
Though the number of mold orders is constant, the average number of molds per orders is
Question 2
The market shift from molds to plastic parts impacts Custom Molds because of the different
production process required for each product. Mold production is a job process
environment with only a limited number of molds manufactured per order. This process
requires highly trained and skilled workers to manufacture the molds. Plastic parts
production is primarily a batch process, with characteristics of a line process, which
Question 3
Alternatives for the Millers are as follows:
1. They can shift their focus to plastic parts production. This will require increasing the
space dedicated to plastic parts production or adding additional space. This will also
2. They can move back to the focus on molds. However, this requires moving against the
apparent trend in the industry. This strategy will require Custom Molds to take business

Process Strategy and Analysis ⚫ CHAPTER 2 ⚫
2-29

⚫ PART1 ⚫ Managing Processes
2-30
CASE: JOSE’S AUTHENTIC MEXICAN RESTAURANT *
A. Synopsis
Jose’s Authentic Mexican Restaurant is a small, independently owned local
restaurant. Ivan, the waiter, has noticed a significant reduction in the size of tips,
leading him to concerns about the quality of the food and service. The
characteristics of the restaurant and the process that takes place in the restaurant are
described following. Students are asked to think of the characteristics of this
environment that define quality to the various players, identify the implied costs of
quality, and apply some of the analysis tools provided in the text.
B. Purpose
This case provides a scenario to which students can relate. Nearly every student has
eaten at a small ethnic restaurant, and you can count on their collective experience
to flesh out the unspoken issues presented in the case. There is sufficient description
of the process to spark considerable discussion as to how the nature of the process
(and the internal customer chain) interacts with the external customer’s perception
of quality. The students need to develop definitions and measures of quality from
several perspectives and then think of how to integrate these different views. A
discussion of the restaurant’s management has been purposefully excluded from
this case so that the students can freely devise the interventions that should be taken
to improve quality at Jose’s.
C. Discussion
1. The first question, asking how quality is defined, is designed to get students to think
of defining quality from the perspective of the various players. At a minimum, the
students should be able to describe the external customers as the patrons (diners) and
the internal customer chain as the cook and wait staff. Other expansions may be
offered as well (hostess, management, busboys, other kitchen staff, suppliers,
community, etc.). A partial list of factors is presented below. No doubt, your students
will come up with many more characteristics that can be used to define quality.
A. To the external customers (the diners), quality is defined by their
expectations. The case does not explicitly describe all of the following but
much may be inferred by the students based on their experiences with
restaurants. The customers can expect any or all of the following:
1. Location and access (to be in a reasonably safe, aesthetically acceptable
location, to be within walking distance, have adequate parking, be served by
public or other transportation).
* This case was prepared by Dr. Larry Meile, Boston College, as a basis for classroom discussion.

Process Strategy and Analysis ⚫ CHAPTER 2 ⚫
2-31
5. Good-tasting food served in an appealing fashion (taste, temperature,
portion, presentation). This characteristic, if held constant, is probably most
important for first-time patrons. Repeat patrons already know what they are
in for.
B. To the cook, an internal customer, quality is largely related to the work
environment.
1. The raw materials are available when needed, are fresh and tasty, have
good appearance, are easy to prepare (perhaps even have some of the
nasty tasks already completed—like prepeeled potatoes), and are
consistent from purchase to purchase.
C. To Ivan (also an internal customer), quality also relates to the workplace
environment.
1. The quality of the finished goods (the meals). The meal is the one described
in the menu, it is of adequate portion, it is produced in a timely fashion, it
tastes good, and it has a pleasant appearance.
D. To the restaurant’s management, quality is primarily related to the firm’s image
(in addition to the personal working environment issues faced by all employees).
1. The restaurant’s reputation in the community: viewed as an asset to the
community, a community supporter, a source of gainful employment, a
nonpolluter, a good neighbor.
2. The restaurant’s image in the eye of the consumer (diner): all of the
customer’s quality issues mentioned previously are met.
⚫ PART1 ⚫ Managing Processes
2-32
3. The restaurant’s image with governmental agencies: the health department
finds little fault with its operation, fire codes are met, appropriate security
measures have been taken, taxes are paid in full and on time.
Quality definitions can also be discussed by category:
❑ Customer–driven definitions of quality
❑ Conformance to specifications—food (weight, appearance, congruent with
menu description), preparation time, meeting health regulations.
❑ Value—customers feel that the food, service, and ambiance are worth the
price.
2. Question two asks the students to list some of the costs of poor quality. Although
specific values cannot be placed on them, conceptual sources of costs can be
identified. Note that these can be viewed from the restaurant’s perspective and from
Ivan’s perspective, and by shifting the view, the interventions (and costs)
change. A short list of possible actions and costs is provided following:
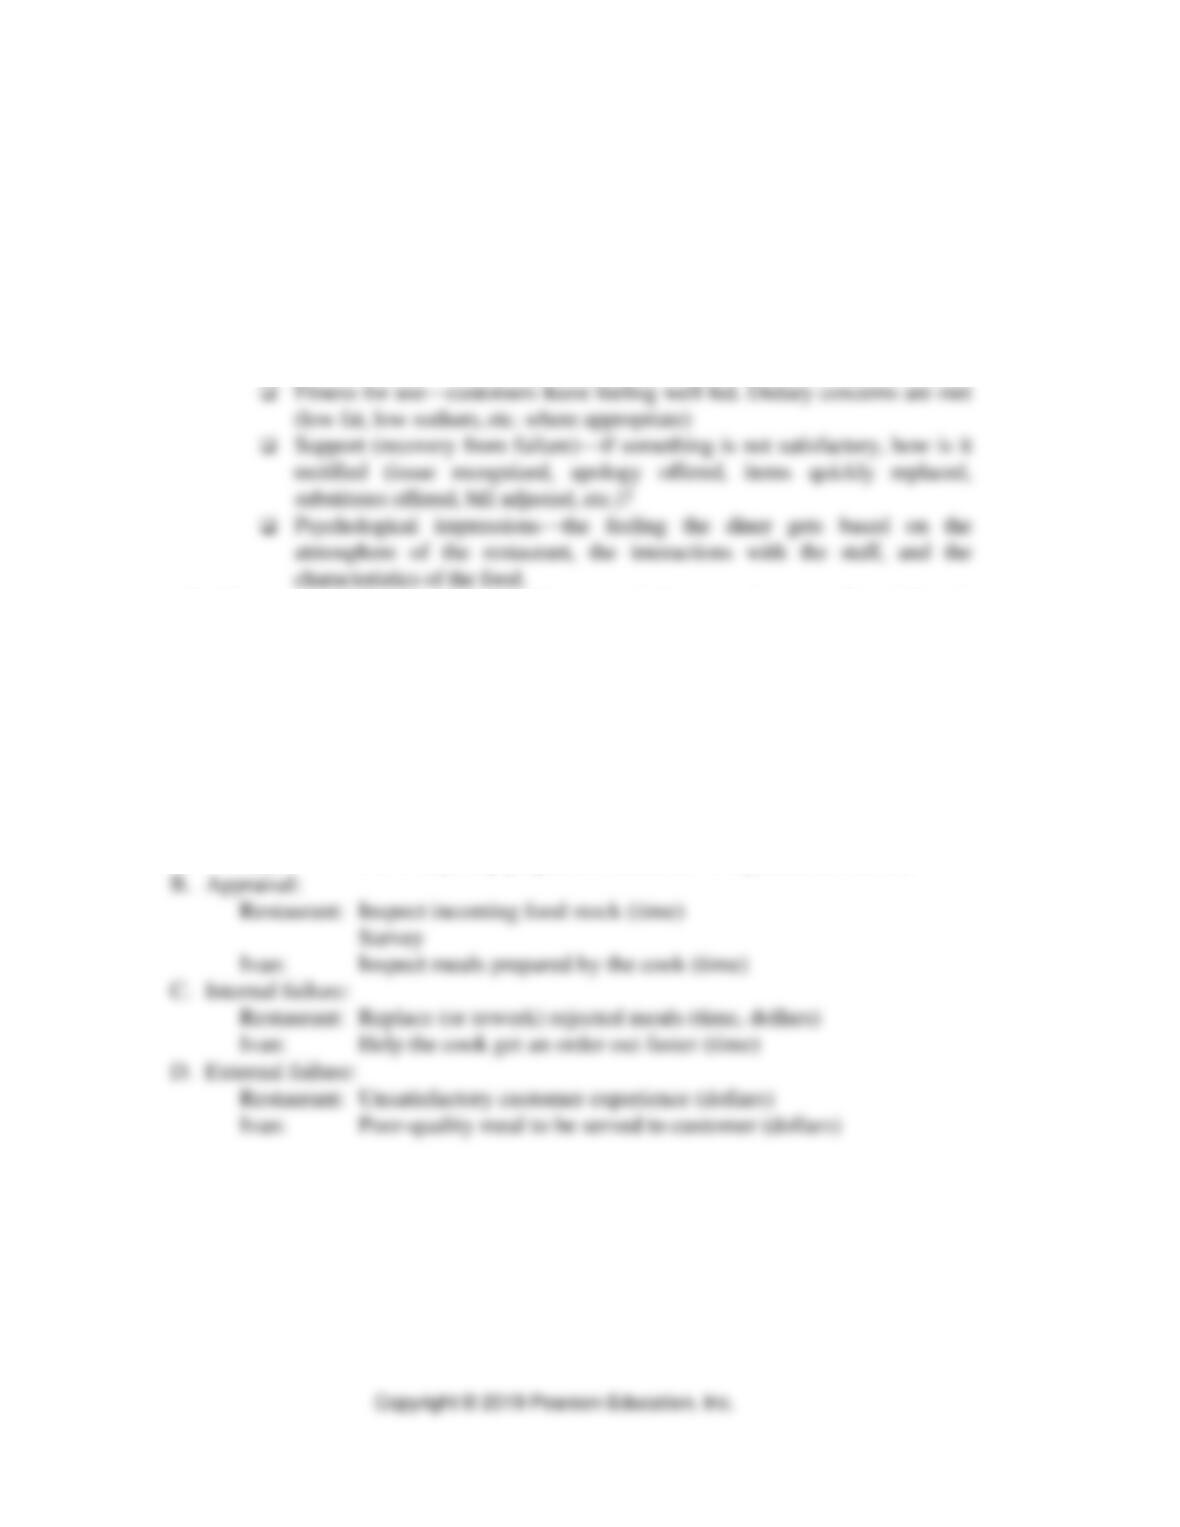
A. Prevention:
Restaurant:
Purchase better food stock (dollars). Reject and reorder sub
par supplies (time)
Set (and meet) food preparation standards (time)
Ivan:
Cull out poorly prepared meals; ask for replacements (time)
B. Appraisal:
Restaurant:
Inspect incoming food stock (time)
Survey
Ivan:
Inspect meals prepared by the cook (time)
C. Internal failure:
Restaurant:
Replace (or rework) rejected meals (time, dollars)
Ivan:
Help the cook get an order out faster (time)
D. External failure:
Restaurant:
Unsatisfactory customer experience (dollars)
Ivan:
Poor-quality meal to be served to customer (dollars)

Process Strategy and Analysis ⚫ CHAPTER 2 ⚫
2-33
3. Four of the quality tools are appropriate for Question Three. Checklists are already
done. Results of the customer satisfaction survey are shown in the case. From this
list a histogram or bar chart of the customer complaints can be made (see
Exhibit TN.1) and a Pareto chart ranking them in importance can be constructed (see
Exhibit TN.2).
their dining experiences).
D. Recommendations
Although no specific recommendations are called for, the students should be pressed to
think of what Ivan can do to improve his situation. The concept of employee
involvement (one of the elements of the TQM Wheel) can be discussed here. This case
provides a reverse view of the material discussed in the chapter. The chapter talks of
management’s challenge in establishing appropriate cultural change (including
awareness of the voice of the customer, advocating the concept of an internal customer
chain, and quality at the source), promoting individual development, and creating
effective awards and incentives. All of these issues can be viewed from Ivan’s
perspective and point out the frustrations experienced by employees if good quality
management is not practiced.
E. Teaching Suggestions
It is effective to ask the students to read this case before the discussion of the material in
the chapter. The case then can act as a common situation that can be used when lecturing
on the various quality topics. As the topics addressed by the questions at the end of the
case are covered by lecture, the students can be asked to respond to them as part of the
classroom discussion.
If the case is used after the chapter material has been covered, it can be used as a cold-
call case or it can be assigned for preparation before discussion in class. If prior
preparation is done, it may be effective to have the students answer the questions by
themselves and then meet as small groups to consolidate their ideas.
⚫ PART1 ⚫ Managing Processes
2-34
When discussing the costs of poor quality, it may be useful to provide a table for the
students on the board or on an overhead transparency listing the four costs and providing
two columns, one for the restaurant and one for Ivan as follows:
Restaurant
Ivan
Prevention
Appraisal
Internal failure
External failure
Possible points for discussion (those points in italics are covered in the preceding
discussion):
Customer-driven definitions of quality
Conformance to specifications
Value
Fitness for use
Support (recovery from failure)
Psychological Impressions
Quality as a competitive weapon
Employee involvement
Process Strategy and Analysis ⚫ CHAPTER 2 ⚫
Copyright © 2019 Pearson Education, Inc.
2-35
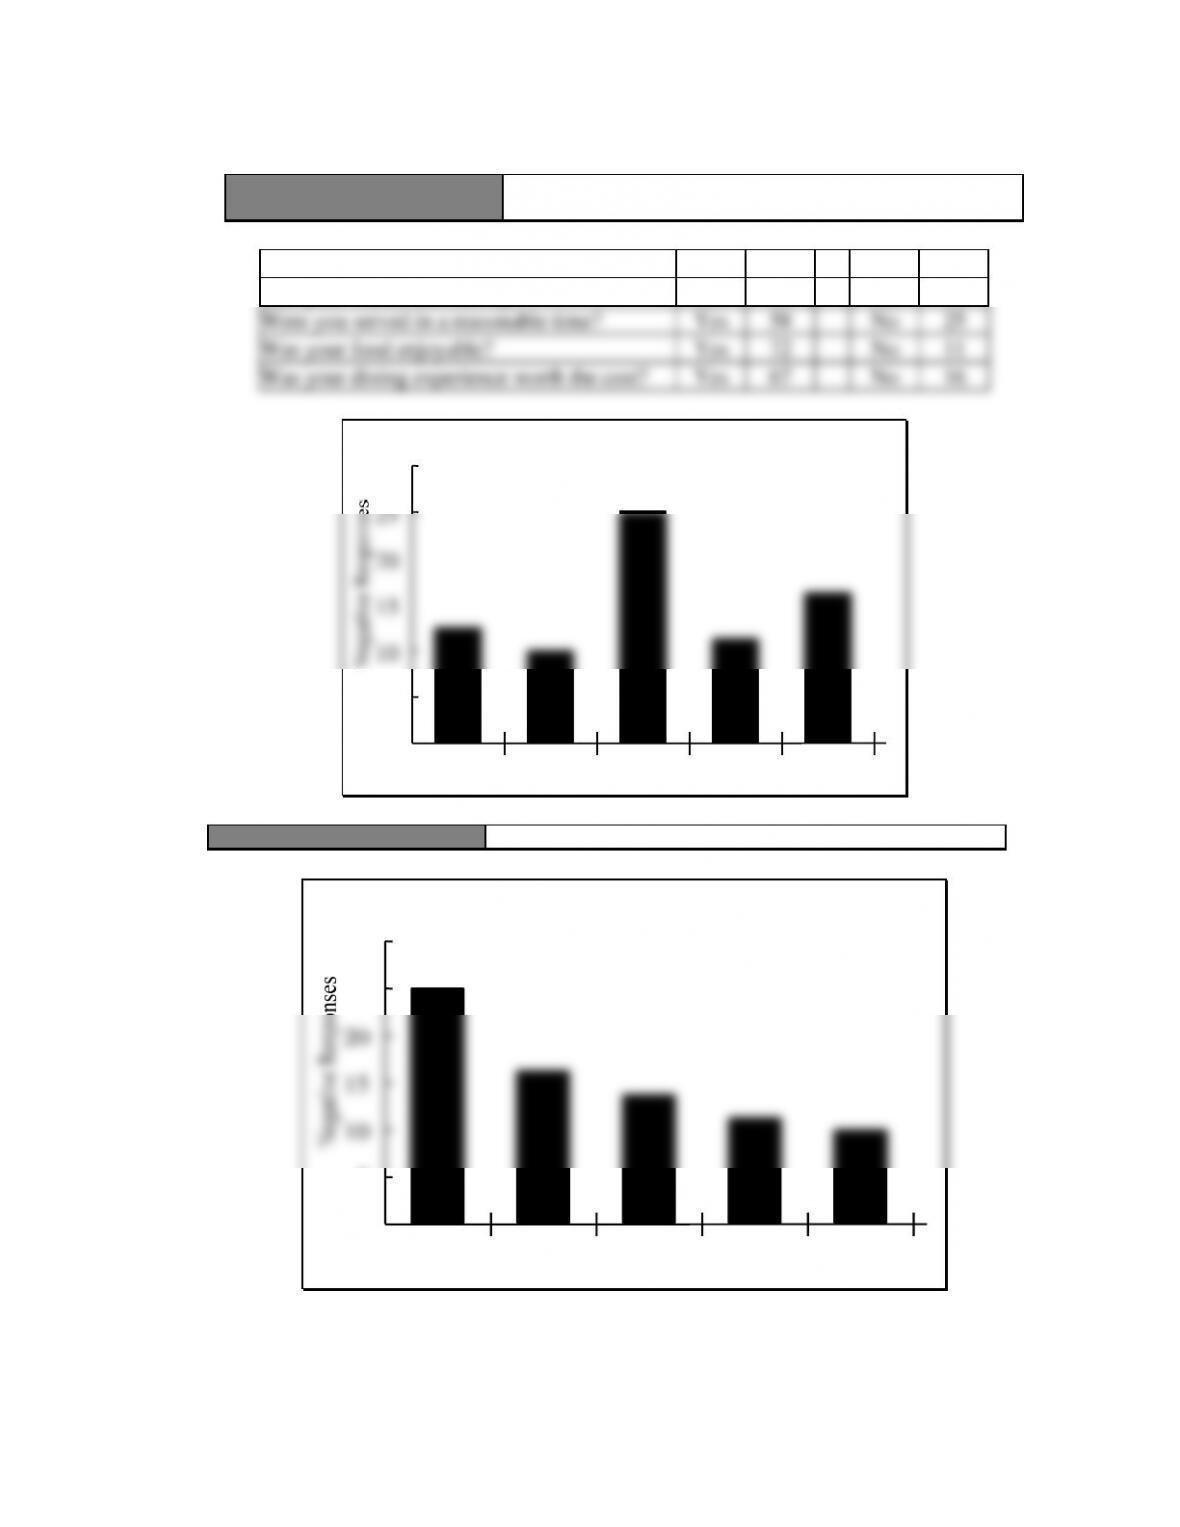
EXHIBIT TN.1
A Bar Chart of the Customer Complaints from the Customer Satisfaction
Survey Shown in the Case
Were you seated promptly?
Yes
70
No
13
Was your waiter satisfactory?
Yes
73
No
10
Were you served in a reasonable time?
Yes
58
No
25
Was your food enjoyable?
Yes
72
No
11
Was your dining experience worth the cost?
Yes
67
No
16
30
25
20
15
10
5
Customer Survey
Prompt
Seating
Sat.
Waiter
Serving
time
Enjoyable
food
Acceptable
cost
EXHIBIT TN.2
A Pareto Chart Ranking Customer Complaints
30
25
20
15
10
5
Prompt
Seating
Sat.
Serving
Enjoyable
Acceptable
Ranked Customer Responses
⚫ PART1 ⚫ Managing Processes
2-36
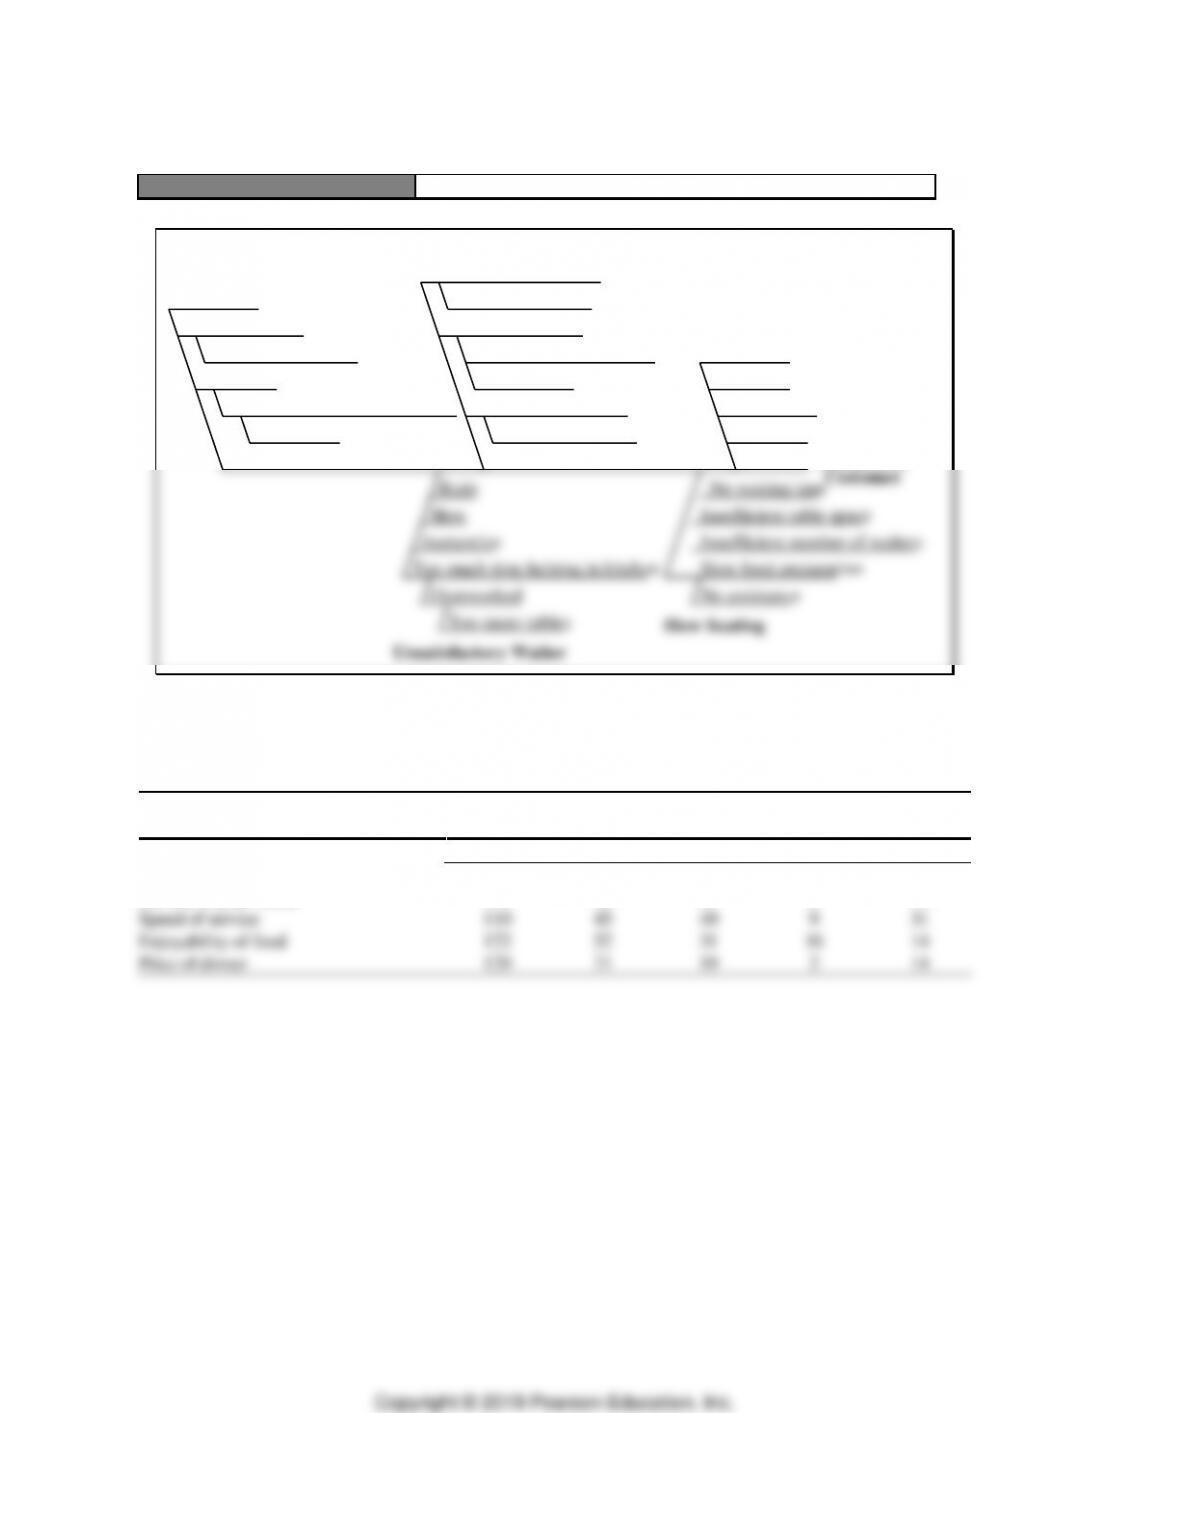
EXHIBIT TN.3
A Possible Cause–and-Effect (Fishbone) Diagram
Low Value
Poor service
Long wait
Dissatisfied
Customer
Overpriced
Poor food
No waiting time
Insufficient table space
Insufficient number of waiters
Slow Seating
Slow Service
Long preparation time
Slow food preparation
No assistance
Rude
Slow
Inattentive
Unsatisfactory Waiter
Too much time helping in kitchen
Overworked
Too many tables
Complicated menu
Fetching foodstocks
Not enough pre-prepared
No assistance
Low-quality ingredients
Inadequate supplier
Unenjoyable Food
Cold food
Waiting for other meals at table
Poor ingredients
Inadequate supplier
Appearance
Poor timing
Alternate survey:
1 = Completely Satisfied; 5 = Extremely Dissatisfied
How satisfied were you with
Customer survey results
(Number of replies to each response option)
1
2
3
4
5
Promptness of seating
129
63
19
14
9
Service of your waiter
134
56
31
0
14
Speed of service
110
45
40
9
31
Enjoyability of food
122
52
31
16
14
Price of dinner
129
71
19
2
14

Process Strategy and Analysis ⚫ CHAPTER 2 ⚫
2-37
ADDITIONAL CASE IN MyLab Operations Management
CASE: THE FACILITIES MAINTENANCE PROBLEM AT MIDWEST
UNIVERSITY *
A. Synopsis
This case describes the problems facing a medium-sized university, Midwest
University, as it tries to maintain 60 buildings on campus. The specific problem is
slow response time in completing work-order requests. The facilities maintenance
area is organized, structured, and scheduled around skilled craft areas. The issue
facing Sean Allen, manager of the facilities area, is how to organize and manage his
personnel to reduce this poor response time.
B. Purpose
The focus of this case is to highlight the importance that job design plays in the
delivery of a quality service package. As it now stands, the facilities maintenance
area at Midwest University is organized around craft functions, in much the same
way most traditional organizations are organized around finance, marketing, and
operations. The problem is that the processes necessary to provide a quality service
require coordination and integration across the skilled crafts. This leads to the
necessity of redesigning the way work is to be completed. The issues of job design
brought out in the case include:
1. Movement from a vertical organizational structure to a multicraft team-oriented,
horizontal organization
2. Use of enlargement, rotation, and enrichment as jobs are redesigned
3. Training requirements necessary to support the new job designs
4. Measuring the performance of the new organizational structure and providing
appropriate recognition
C. Analysis
The analysis and class discussion should begin by focusing on the issue of why
facilities maintenance is providing such poor response times to work-order requests.
Students who have ever lived on campus will readily identify with this problem.
Five- to ten-day lead times for work requests that, for the most part, take less than
one hour do seem a little absurd. The analysis of the problem should focus on the
key factors that contribute to this poor performance. Students should quickly be
able to identify the following three factors:
1. The difficulty in prioritizing work-order requests across both crafts and
buildings for scheduling purposes
2. The frequent need to involve more than one craft in order to complete the work–
order request
* This case was prepared by Dr. Brooke Saladin, Wake Forest University, as a basis for classroom

⚫ PART1 ⚫ Managing Processes
2-38
3. The geographical dispersion of 60 different buildings that need to be maintained
As the problem-identification discussion continues, students may add other
factors to these three. The instructor’s job here is to bring the students to the
realization that the top-down scheduling of work-order requests across crafts
and 60 different buildings is a very complex and integrative process. Students
should begin to realize that poor lead-time performance is actually a symptom
of a much larger problem, that is, the conflicts that are present by having a
“functional silo” orientation to job design when the performance of the job to
meet customer requirements calls for a multidisciplinary team approach. The
rest of the analysis should focus on the seven key elements of job design for
horizontal organizations:
1. Organize around processes: Ask students to identify the core processes that
are critical to the success of the facilities maintenance area. Key processes
identified should include:
❑ Order receipt and processing
❑ Work scheduling and dispatching
❑ Physical maintenance and repair
2. Flatten the organizational hierarchy: Supervision can be reduced by
breaking down the “functional craft silos” and the inherent managerial
redundancy created by each craft managing itself.
3. Teams manage the organization: Teams can be organized around the core
processes identified in point #1. Another factor to consider is the
geographical dispersion of the buildings on campus. Teams could be
organized not only as multicraft maintenance and repair groups but also
around specific geographical areas of the campus. Teams could then receive,
schedule, and repair their own work requests over a designated number of
buildings. This would push responsibility through the teams and help
alleviate the problem of travel across campus.
4. Customers drive performance: By having teams assigned to specific
buildings, relationships that would enhance the teams’ knowledge of
customer requirements could be developed. Specific measures of customer
satisfaction would need to be developed.
5. Management rewards team per performance: This structure naturally leads
to cross-training opportunities for which team members could be rewarded.
Other measures, such as number of work requests completed per time
period, average time to complete a work request, and customer satisfaction
index ranking, need to be established to evaluate the performance of the
team as a whole.
6. Supplies and customer contact: Geographical assignments will help foster
customer contact. This decentralization may, however, remove the teams
from maintenance and repair suppliers.

Process Strategy and Analysis ⚫ CHAPTER 2 ⚫
2-39
7. Training programs for all employees: Training should not only include the
opportunity for cross-craft skill training but should also look at
communication, team building, process improvement, problem solving, and
administrative skills.
D. Recommendations
The instructor should focus the students on looking at the “big picture” in making
recommendations with respect to job design. Students should address the issue of
moving toward a horizontal organization and away from the traditional, vertically
oriented craft silos. Their recommendations should encompass each of the seven
key factors of job design.
As a side note, the manager of facilities maintenance actually created cross–
functional craft teams and assigned these teams to specific areas of the campus.
Individual teams were responsible for scheduling and completing work within their
own assigned geographical area. The custodial staff was also integrated into the
team, which helped in planning and completing routine maintenance. The teams
were able to become familiar with both their “customers” and the individual needs
of the buildings in their area. Response times have been drastically reduced, with
50% of the requests getting same-day service and 80% of the work-order requests
getting next-day service. Large requests that exceed the resources of an individual
team are still coordinated by the main office.
E. Teaching Strategy
This is a short cold-call case that is positioned to get students thinking about the
impact job design has on an organization’s ability to satisfy customer needs.
Students should draw not only from the material on teams in Chapter 5, “Quality
and Performance”, but also from the concepts in Chapter 3, “Process Strategy”.
If you like using groups, this case can be effectively discussed by breaking the class
into groups and giving them 15 to 20 minutes to brainstorm alternative approaches
to reducing the response time to work-order requests. Then get them back together
and go around to each group for a report on what they brainstormed, putting each
group’s responses on the board. Compare and contrast the similarities and
differences in each group’s approach.
The instructor should take the last 10 to 15 minutes to categorize the group’s
responses on the board with respect to the major concepts of the chapter. Indicate
which alternatives focus on each of the seven key factors of job design; which
responses deal with enlargement, rotation, or enrichment; which focus on the
development of standards, training needs, or incentive plans. By doing this
summary, the instructor has the opportunity to tie the concepts of job design
together into an integrated whole. You can conclude by describing briefly what
actually happened as presented in the recommendation section.