Chapter
2 Process Strategy and Analysis
TEACHING TIP
This chapter focuses on process strategy and analysis, which specifies the pattern of decisions
made in managing processes so that the processes will achieve their competitive priorities
assigned to it, such as quality, flexibility, time, and cost. Note that supply chains have processes
also, they just have external suppliers and customers. The chapter then provides some tools and
perspectives of process analysis
TEACHING TIP
Introduce with a business example, such as CVS Pharmacy. The opening illustrates that careful
design and execution of processes can have a positive impact on customer satisfaction and
ultimately on the business outcomes and financial success.
1. Emphasize that processes are everywhere, in all functional areas of the enterprise.
a. As explained in Chapter 1: processes are found in accounting, finance, human resources,
management information systems, marketing, supply chain, and operations.
2. Managers must see to it that processes in all departments are adding as much customer value
as possible.
3. Two basic change strategies for analyzing and modifying processes: process reengineering
and process improvement
4. Three particularly important principles concerning process strategy
5. Four common process decisions
a. Process structure
b. Customer involvement
c. Resource flexibility
d. Capital intensity
1. Process Structure in Services
TEACHING TIP
One of the first decisions a manager makes in designing a well-functioning process is to choose a
process type that best achieves the relative importance of quality, time, flexibility, and cost for
that process.
1. Nature of Service Processes: Customer Contact
a. A good process strategy for a service process:
• Depends on the type and amount of customer contact.
• Customer contact: the extent to which the customer is present, is actively involved,
and receives personal attention during the service process.
b. Dimensions of customer contact
• Physical presence (face-to-face interaction is sometimes called a moment of truth, or
service encounter)
• What is processed
People-processing services
Possession-processing services
Information-based services
2. Customer-contact matrix (fitting the service processes with customer contact)
a. Customer contact and customization
• A key competitive priority is how much customization is needed
• Competitive priorities require more customization, the more the customer is present
and actively involved.
b. Process divergence and flow
• Process divergence: extent to which the process is highly customized with
considerable latitude as to how it is performed
Copyright © 2019 Pearson Education, Inc.
High divergence involves much judgment and discretion. Consulting and law, for
example
Low divergence is more repetitive and standardized
• Process flow, closely related to divergence, may range from highly diverse to linear.
Flexible flow means movements in diverse ways.
Line flow means movement in fixed sequence.
3. Service process structuring (three process structures forming a continuum)
a. Front office: a process with higher customer contact where the service provider interacts
directly with the customer
b. Hybrid office: a process with moderate levels of customer contact and standard services
with some options available
c. Back office: a process with low customer contact where the service provider interacts
little with the customer
TEACHING TIP
The Ritz-Carlton Hotel Company targets the top 1 to 3 percent of luxury traveler, and so gives a
huge emphasis on customization and top quality. The associates at the front desk characterize a
front office, because the customers are present, take an active part in creating the service, receive
personal attention, and have face-to–face contact.
2. Process Structure in Manufacturing
TEACHING TIP
Emphasize that many processes in a manufacturing setting are actually services to internal (or
external) customers, so the previous section applies also to manufacturing.
Manufacturing processes convert materials into goods that have a physical form.
1. Product-process matrix
• Three elements
• Volume
2. Manufacturing process structuring
• Process choice: A way of structuring the process by organizing resources around the
process or organizing them around the products
• Four process choices, forming a continuum
• Job process, high variety of products
• Batch process, higher volumes, batching of customer orders. Further differentiated as
small batch and large batch processes.
• Line process, high-volumes, standardized products, dedicated resources, repetitive
manufacturing
• Continuous flow process, the extreme end of high-volumes, rigid line flows. Primary
material moves without stopping.
3. Production and inventory strategies
• Design-to-Order Strategy
• Designing new products that do not currently exist
• Manufacturing to meet unique customer specifications
• Make-to-order strategy
• Make products to customer specifications in low volumes with job or small batch
processes,
• Matches up with flexibility (customization) and top quality
4. Layout
A layout is the physical arrangement of operations (or departments) created from the various
processes and puts them in tangible form
An operation is a group of human and capital resources performing all or part of one or more
processes.
See Supplement K
3. Process Strategy Decisions
1. Customer Involvement
TEACHING TIP
McDonald’s uses its self-ordering kiosks to get its customers involved in the ordering process
and to customize their orders This process not only increases accuracy of the order, but also
streamlines the process
a. Possible advantages
• Improved competitive capabilities
• Can increase value to customer
b. Emerging technologies: in a market where customers are technology-enabled, companies
can now engage in an active dialogue with customers and make them partners in creating
value.
c. Possible disadvantages
• Can be disruptive, making the process less efficient
2. Resource Flexibility
a. Workforce
• Implications of a flexible workforce
Requires more education and training
Copyright © 2019 Pearson Education, Inc.
Steady volume, high skills—permanent workforce
Variable volume, low skills—part-time or temporary employees to supplement
permanent workforce
Variable volume, high skills—trained flexible force that can be moved to
produce whatever the market demands
b. Equipment
• Managers must account for process divergence and diverse process flows when
making resource flexibility decisions. Break-even analysis can be useful.
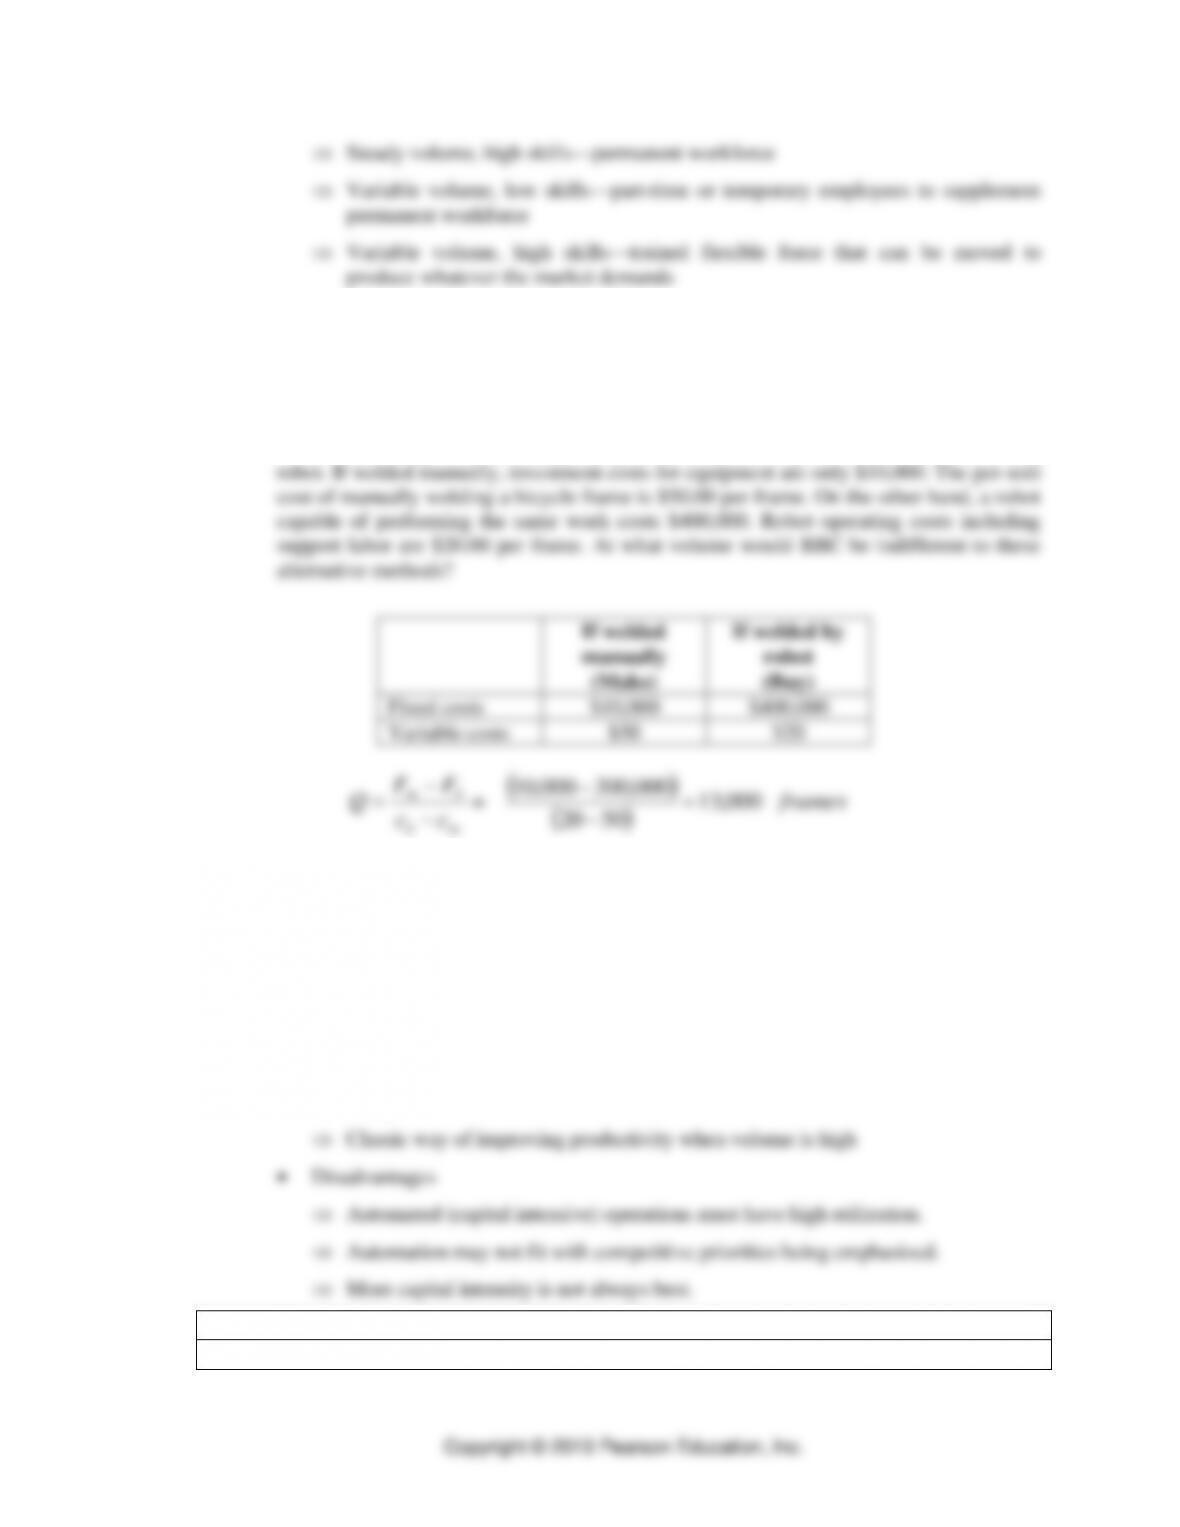
• Application 2.1 Break-Even Analysis in Process Choice.
BBC is deciding whether to weld bicycle frames manually or to purchase a welding
• Tutor 2.2 in MyLab Operations Management demonstrates how to do a break-even
analysis for equipment selection.
3. Capital Intensity
a. Capital intensity is the mix of equipment and human skills in the process; the greater the
relative cost of equipment, the greater is the capital intensity.
b. Automating manufacturing processes
• Advantage
TEACHING TIP
Give business example, such as Gillette’s package customization.
• Fixed automation: a manufacturing process that produces one type of part or product
in a fixed sequence of simple operations
TEACHING TIP
Mention chemicals and oil.
• Flexible (or programmable) automation: a manufacturing process that can be changed
easily to handle various products.
Useful in both low-customization and high-customization
Can be quickly set up to make a variety of products in small batches
Perhaps show photos of the JustBorn robots
c. Automating service processes
• Using capital inputs as a labor-saving device is also possible for service processes.
Examples:

4. Strategic Fit
The manager process strategist should understand how the four major process decisions tie
together.
1. Decision patterns for service processes
a. Process structure
b. Customer involvement
c. Resource flexibility
d. Capital intensity
2. Decision patterns for manufacturing processes
5. Strategies for Change
1. Process reengineering
TEACHING TIP
Mention Bell Atlantic reengineered its telephone business. After 5 years, it cut the time to
connect new customers from 16-days to just hours.
a. Critical processes
• Emphasis is placed on core business processes.
• Processes are broadly defined in terms of costs and customer value.
b. Strong leadership
• Senior executives must provide a strong leadership for reengineering success
c. Cross-functional teams
e. Clean-slate philosophy
• Start with the way a customer wants to deal with the company.
f. Process analysis.
3. Process Analysis
a. The documentation and detailed understanding of how work is performed and how it can
be redesigned
b. Six Sigma Process Improvement Model: employees must be trained in the “whys” and
the “how–tos” of process performance and what it means to customers, both internal and
external
• Define: the scope and boundaries of the process to be analyzed are first established.
6. Defining, Measuring and Analyzing the Process
TEACHING TIP
Introduce this section with business examples. It could be how processes were improved at
McDonald’s Corporation, which increased customer value with better processes, informed by
innovative data collection.
1. Techniques give management insight on current processes and possible changes.
a. flowcharts
b. work measurement techniques
c. process charts
2. Flowcharts
a. Diagrams that trace the flow of information, customers, equipment, or materials through
the various steps of a process.
b. Flowcharts show how organizations produce their outputs through a myriad of cross
functional work processes, allowing the design team to see all the critical interfaces
between functions and departments.
c. Swim Lane Flowcharts
TEACHING TIP
A more comprehensive treatment of work measurement techniques is provided in MyLab
Operations Management
Supplement H, “Measuring Output Rates”
Supplement I, “Learning Curve Analysis”
3. Work Measurement techniques
a. Time study method
• Selecting the work elements within the process to be studied
• Timing the elements
• Determining the sampling size
• Setting the final standard
b. Elemental standard data approach
c. Predetermined data approach
• Published database that divides each work element even more, into micromotions
d. Work sampling method
• Estimates proportion of time spent on different activities
• Supplement H, “Measuring Output Rates” in MyLab Operations Management
e. Learning curve analysis

• Supplement I, “Learning Curve Analysis” in MyLab Operations Management
4. Process Charts
a. Concentrates in more detail on a smaller number of steps than does a flowchart.
b. It is an organized way of documenting all of the activities performed by a person or a
group of people at a workstation, with a customer, or working with certain materials.
c. Five possible categories
• Operation
• Transportation
• Inspection
• Delay
• Storage
d. Estimate the annual cost of the entire process.
• It becomes a benchmark against which other methods for performing the process can
be evaluated.
• Annual labor cost can be estimated by finding the product of
(1) time in hours to perform the process each time
(2) variable costs per hour
(3) number of times the process is performed each year
TEACHING TIP
Mention Video Case: “Process Analysis at Starwood.” If possible, show the video that
accompanies it, using the questions at the end of the written case and the “pause point” in the
video itself to encourage class discussion.
5. Data analysis tools
a. Checklists: a form used to record the frequency of occurrence of certain process failures.
b. Histograms and bar charts
• Use Figure 2.11
c. Pareto Charts: a bar chart on which the factors are plotted in decreasing order of
frequency along the horizontal axis.
• Use Example 2.2
d. Scatter diagrams: a plot of two variables showing whether they are related.
e. Cause-and-effect diagram: relates a key performance problem to its potential causes
(sometimes called a fishbone diagram).
• Use Example 2.3
f. Graphs: representations of data in a variety of pictorial forms, such as line and pie charts.
• Line charts (see the “Quality and Performance” Chapter)
• Forecasting (see Chapter 8, “Forecasting”)
6. Data snooping
a. The power of the data analysis tools is greatest when they are used together.
b. Data snooping is the use of the tools to sift data, clarify issues and deduce causes.
c. Use Example 2.4
7. Simulation
c. See Supplement E, “Simulation”
7. Redesigning and Managing Process Improvements
1. Questioning and Brainstorming
a. A questioning attitude: ask six questions about each step in the process
• What is being done?
• When is it being done?
• Who is doing it?
• Where is it being done?
• How is it being done?
• How well does it do on the various metrics of importance?
TEACHING TIP
For each question, ask why? As time permits, have the class “brainstorm” Solved Problem 2 on
changing auto engine oil. Have students shout out their ideas in rapid fire manner without time
lost just yet for evaluation.
2. Creativity can be stimulated by having a brainstorming session: a time when a group of
people, knowledgeable on the process propose ideas for change by saying whatever comes to
mind
3. Benchmarking: focuses on setting quantitative goals for improvement
a. Competitive benchmarking is based on comparisons with a direct industry competitor.
b. Functional benchmarking compares areas such as administration, customer service, and
sales operations with those of outstanding firms in any industry.

c. Internal benchmarking involves using an organizational unit with superior performance
as the benchmark for other units.
4. Implementing: Seven mistakes to avoid in managing processes: