Chapter
13 Supply Chain Logistic Networks
TEACHING TIP
Ask students to give an example where a facility’s location makes a difference, or introduce with
examples, such as Starbucks and White Castle. Discuss the importance of location choices and
how these choices impact a firm’s value chain in terms of the Supplier Relationship Process and
the Customer Relationship Process. Stress that the location of facilities has a significant impact
on the firm’s operating costs, the prices it charges for services and goods, and its ability to
compete in the marketplace and penetrate new customer segments.
Discuss the opening vignette where capacity limitations and additional factors led Airbus SAS to
consider manufacturing outside of Europe. The question was, where? After an extensive study
and consideration of supply chain and incentive opportunities unique to the area, the, Mobile,
Alabama USA, location was chosen. The plant is now a manufacturer of the A320 family of
aircraft.
• Information technology and the Internet can help overcome the disadvantages related to a
firm’s location. An important trend discussed in this chapter is the use of geographic
information systems (GIS), used to identify market segments and how serving each of the
segments can profitability affect the firm’s location strategy.
• Location decisions affect processes and departments throughout the organization.
o Marketing must assess how the location will appeal to customers and possibly open
up new markets.
1. Factors Affecting Location Decisions
• Managers of both service and manufacturing organizations must weigh many factors when
assessing the desirability of particular locations, including the proximity to customers and
suppliers, labor costs, and transportation costs.
o The factor must be sensitive to location.
o The factor must have a high impact on the company’s ability to meet its goals.
1. Dominant factors in manufacturing
a. Favorable labor climate
• Most important for labor-intensive firms such as textiles, furniture, and consumer
electronics.
• Labor climate is a function of wage rates, training requirements, attitudes toward
work, worker productivity, and union strength.
d. Quality of life
• Good schools, recreational facilities, cultural events, and an attractive lifestyle
contribute to quality of life.
e. Proximity to suppliers and resources
• Firms dependent on inputs of bulky, perishable, or heavy raw materials.
• Inbound transportation costs become a dominant factor
• Examples
f. Proximity to the parent company’s facilities
• Plants supply parts to other facilitates or rely on other facilities for management and
staff support.
g. Utilities, taxes, and real estate costs
• Attractive in part due to the incentives from local government.
h. Other factors
• Room for expansion
• Construction costs
• Local ordinances
• Community attitudes
• For global operations: firms need a good local infrastructure and local employees
who are educated and have good skills.
2. Dominant factors in services
The factors for manufacturing also apply to service providers with one important addition: the
impact of location on sales and customer satisfaction.
a. Proximity to customers
• A key factor in determining how conveniently customers can carry on business with a
firm.
• The influence of location on revenue tends to be the dominant factor.
b. Transportation costs and proximity to markets
• With a warehouse nearby, many firms can hold inventory closer to the customer, thus
reducing delivery time and promoting sales.
c. Location of competitors
d. Site-specific factors
• Level of retail activity
• Residential traffic
• Site visibility
2. Load-Distance Method
In the systematic selection process, the analyst must identify attractive candidate locations
and compare them on the basis of quantitative factors. The load-distance (ld) method is one
way to facilitate this step.
• The objective is to select a location that minimizes the sum of the loads multiplied by
the distance the load travels.
• Time may be used instead of distance.
1. Distance Measures
a. Euclidean distance is the straight-line distance, or shortest possible path, between two
points.
•
( ) ( )
2
*
2
*yyxxd iii −+−=
where
di = distance between customer i and the proposed facility
xi = x-coordinate of customer i
yi = y-coordinate of customer i
*
x
= x-coordinate of proposed facility
*
y
= y-coordinate of proposed facility
b. Rectilinear distance measures the distance between two points with a series of 90-degree
turns, as along city blocks.
• di = |xi – x*| + |yi – y*|
2. Calculating a load-distance score
• Depending on the industry, a load may be shipments from suppliers, shipments
between plants or to customers, or it may be customers or employees traveling to and
from the facility.
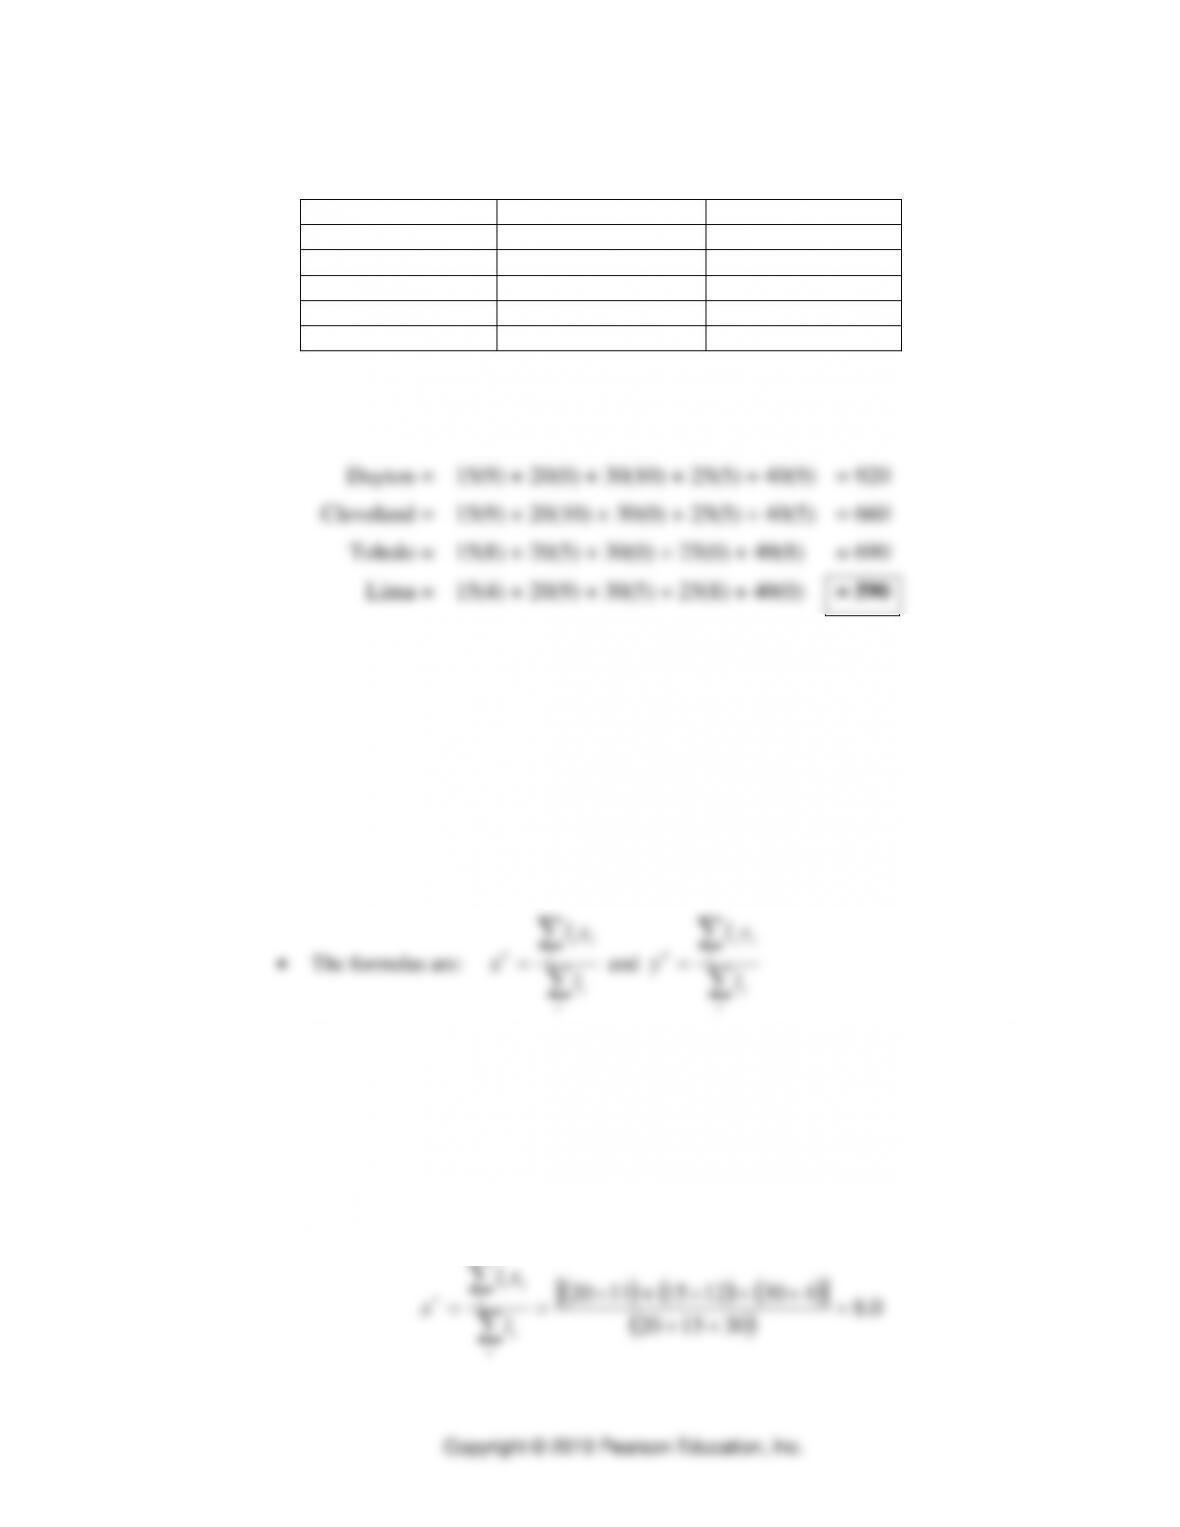
this plant to those five locations. The following information has been collected. Which is
best, assuming rectilinear distance?
Location
x, y coordinates
Trips/year
Cincinnati
(11,6)
15
Dayton
(6,10)
20
Cleveland
(14,12)
30
Toledo
(9,12)
25
Lima
(13,8)
40
Calculations:
Cincinnati =
15(0) + 20(9) + 30(9) + 25(8) + 40(4)
= 810
Dayton =
15(9) + 20(0) + 30(10) + 25(5) + 40(9)
= 920
Cleveland =
15(9) + 20(10) + 30(0) + 25(5) + 40(5)
= 660
Toledo =
15(8) + 20(5) + 30(0) + 25(0) + 40(8)
= 690
Lima =
15(4) + 20(9) + 30(5) + 25(8) + 40(0)
= 590
3. Center of gravity
Used as a good starting point to evaluate locations in target areas using the load-distance
method.
• The center of gravity’s x coordinate, denoted
x
, is found by multiplying each point’s
x coordinate by its load
( )
i
l
, summing these products
ii xl
, and then dividing by
the sum of the loads
( )
i
l
.
• The center of gravity’s y coordinate, denoted
y
, is found the same way
ii
iii
l
xl
ii
iii
l
yl
• This location is generally not the optimal one for the distance measures, but it still is
an excellent starting point.
• Application 13.3: Center of Gravity
A firm wishes to find a central location for its service. Business forecasts indicate travel
from the central location to New York City on 20 occasions per year. Similarly, there will
be 15 trips to Boston, and 30 trips to New Orleans. The x,y-coordinates are (11.0, 8.5) for
New York, (12.0, 9.5) for Boston, and (4.0, 1.5) for New Orleans. What is the center of
gravity of the three demand points?
( ) ( ) ( )
( )
0.8
301520
43012151120 =
++
++
==
ii
iii
l
xl
x
( ) ( ) ( )
( )
5.5
301520
5.1305.9155.820 =
++
++
==
ii
iii
l
yl
y
3. Break-Even Analysis
• Used to help a manager compare location alternatives on the basis of quantitative factors that
can be expressed in terms of total costs.
o Basic Steps
▪ Determine the variable costs and fixed costs for each site.
▪ Plot total cost lines (for assistance, see Tutors A.1 and A.2 in OM Explorer).
▪ Identify the approximate ranges for which each location has lowest cost.
▪ Solve algebraically for break-even points over the relevant ranges.
o Use Example 13.2: Break-Even Analysis for Location
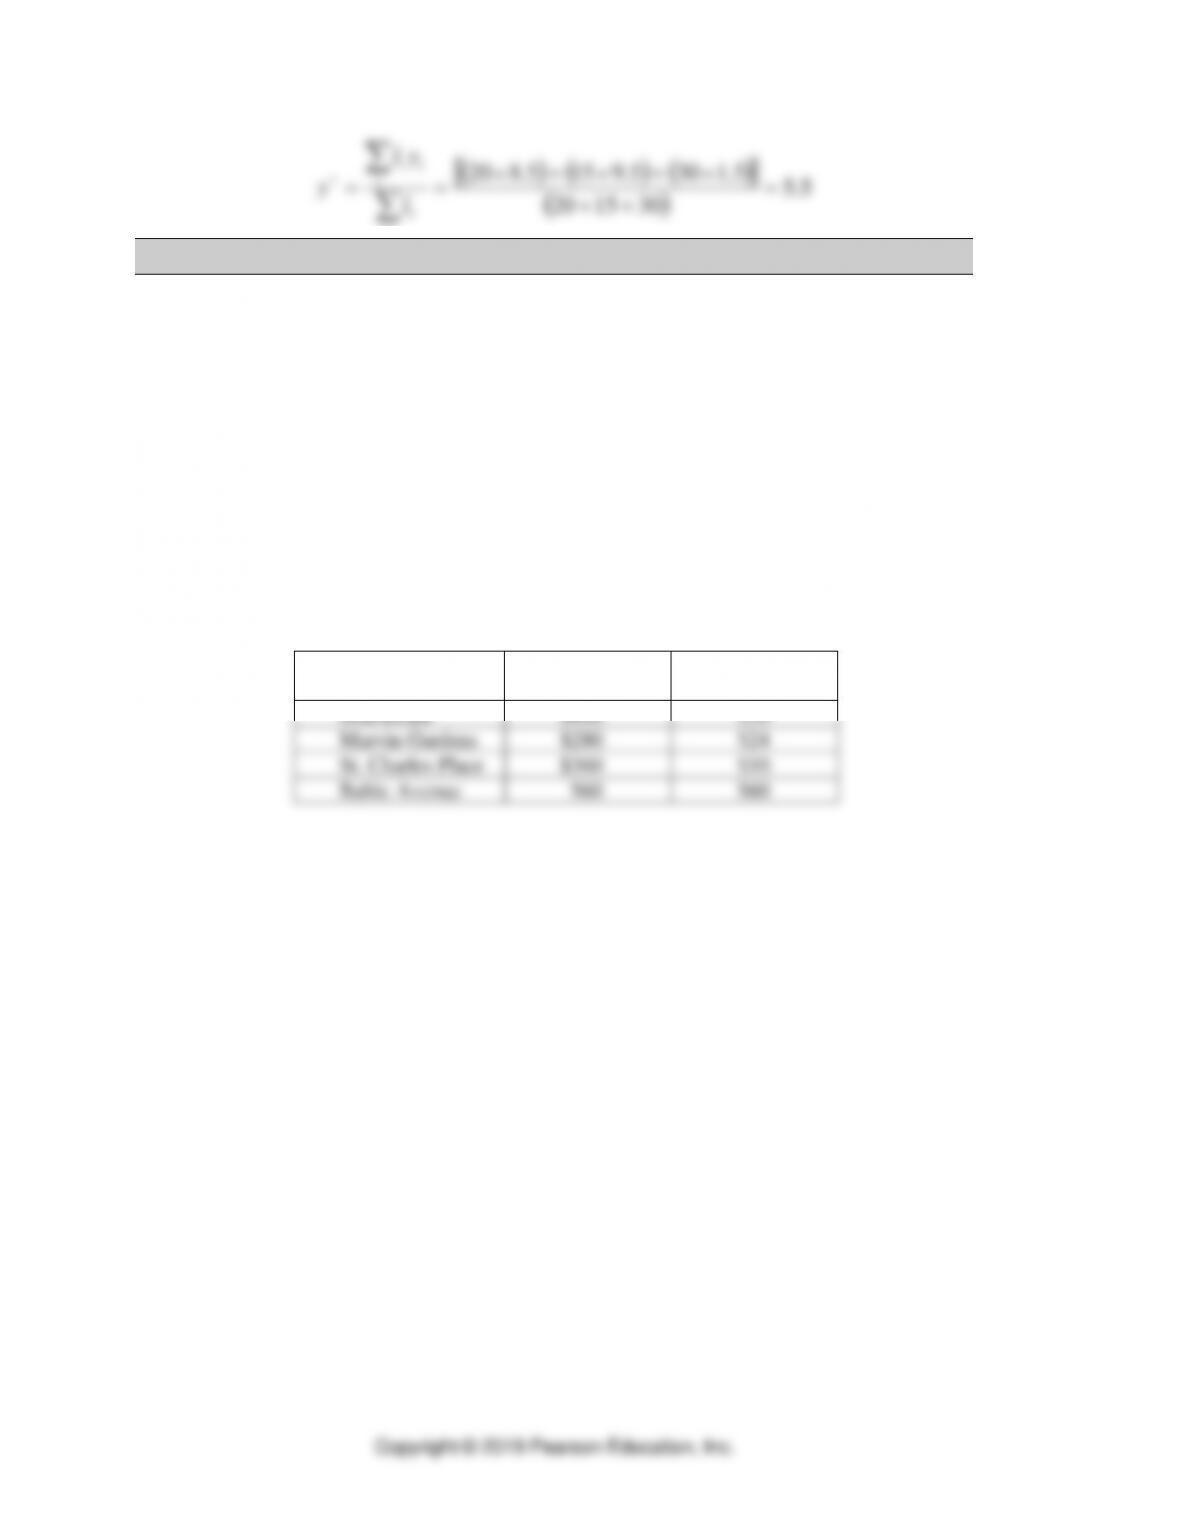
• Application 13.4: Break-Even Analysis. By chance, the Atlantic City Community Chest has
to close temporarily for general repairs. They are considering four temporary office
locations:
Property
Address
Move-in
Costs
Monthly
Rent
Boardwalk
$400
$50
Marvin Gardens
$280
$24
St. Charles Place
$360
$10
Baltic Avenue
$60
$60
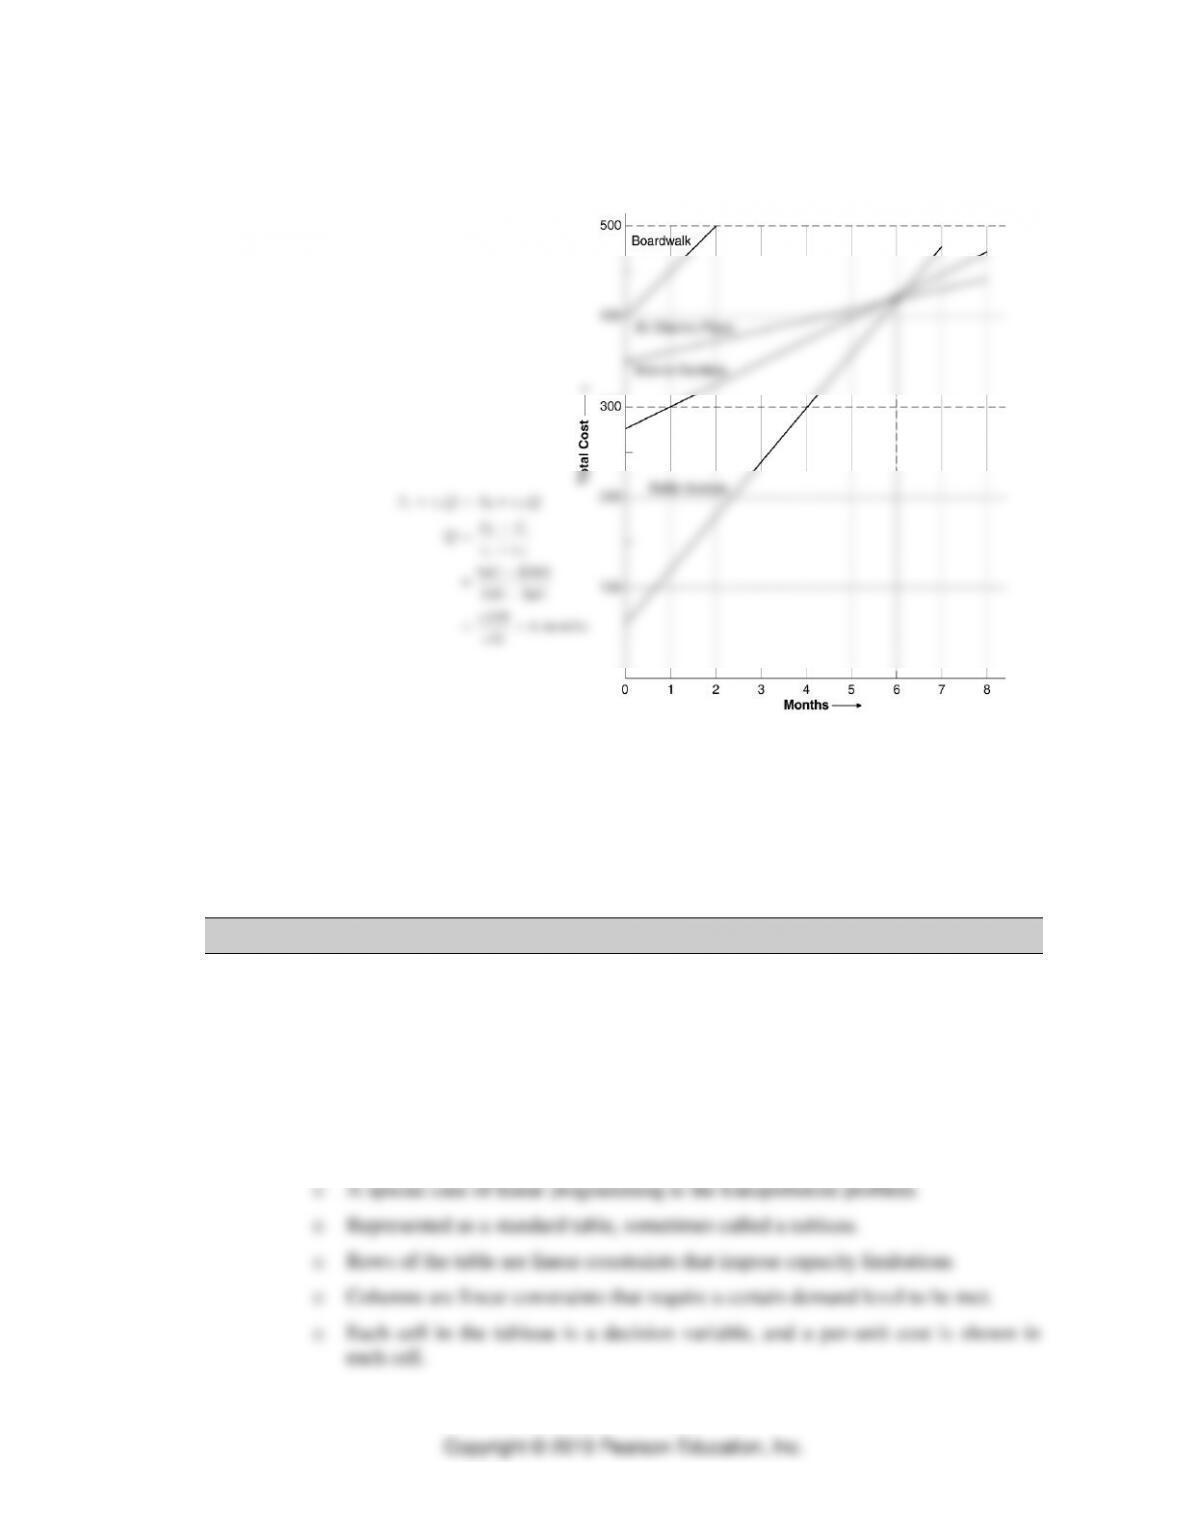
Use the graph below to determine for what length of lease each location would be
favored? Hint: In this problem, lease length is analogous to volume.
The short answer: Baltic Avenue if 6 months or less, St. Charles Place if longer.
• Active Model 13.2 in MyLab Operations Management provides insights on defining the three
relevant ranges found in Example 13.2.
• Tutor 13.3 in MyLab Operations Management provides another example to practice break–
even analysis for location decisions.
4. Transportation Method
• When facilities are interactive, the location of a new facility affects the shipping pattern
of other facilities in the network. Three major issues:
o Location: what is the best location for the new facility?
o Allocation: how much work should be assigned to each facility?
o Capacity: what is the best capacity for each facility?
• The transportation method for location problems
o The focus in this section is on the setup and interpretation of the problem.
• Transportation method for location
o Can help solve multiple-facility location problems.
▪ Allocation that minimizes the cost of shipping from two or more plants,
or sources of supply, to two or more warehouses, or destinations.
▪ Does not solve all facets of the multiple-facility location problem. It
only finds the best shipping pattern between plants and warehouses.
1. Setting up the initial tableau
a. Basic steps
• Create a row for each plant and a column for each warehouse
2. Dummy plants or warehouses
a. The transportation method also requires that the sum of capacities equal the sum of
demands.
b. If capacity exceeds requirements we add an extra column (a dummy warehouse)
• If requirements exceed capacity we add an extra row (a dummy plant)
• Assign shipping costs to equal to the stockout costs of the new cells.
3. Finding a solution
a. The goal is to find the least-cost allocation patterns that satisfies all demands and
exhausts all capacities.
b. Use Example 13.3. The optimal solution for the Sunbelt Pool Company, found with
POM for Windows, is shown in figure 13.5.
5. Geographic Information Systems
• A geographical information system (GIS) is a system of computer software, hardware, and
data that the firm’s personnel can use to manipulate, analyze, and present information
relevant to a location decision.
o Can also integrate different systems to create a visual representation of a firm’s
location choices.
o Among other things
▪ Used to store databases
▪ Display maps
▪ Create models that can take information from existing datasets, apply
analytic functions, and write results into new derived datasets.
▪ Together (these three functionalities) are critical parts of an intelligent GIS.
o A GIS system can be a really useful decision-making tool because many of the
decisions made by business today have a geographical aspect.
TEACHING TIP
Mention Managerial Practice 13.1, which illustrates how fast-food uses GIS to select their sites.
Also highlighted is how governmental data can provide a statistical mother lode of information
used to make better GIS-based location decisions.
1. Using GIS to identify locations and demographic customer segments
a. GIS can be useful for identifying locations that relate well to a firm’s target market based
on customer demographics.
b. When coupled with other location models, sales forecasting models, and geodemographic
systems, it can give a firm a formidable array of decision-making tools for its location
decisions.
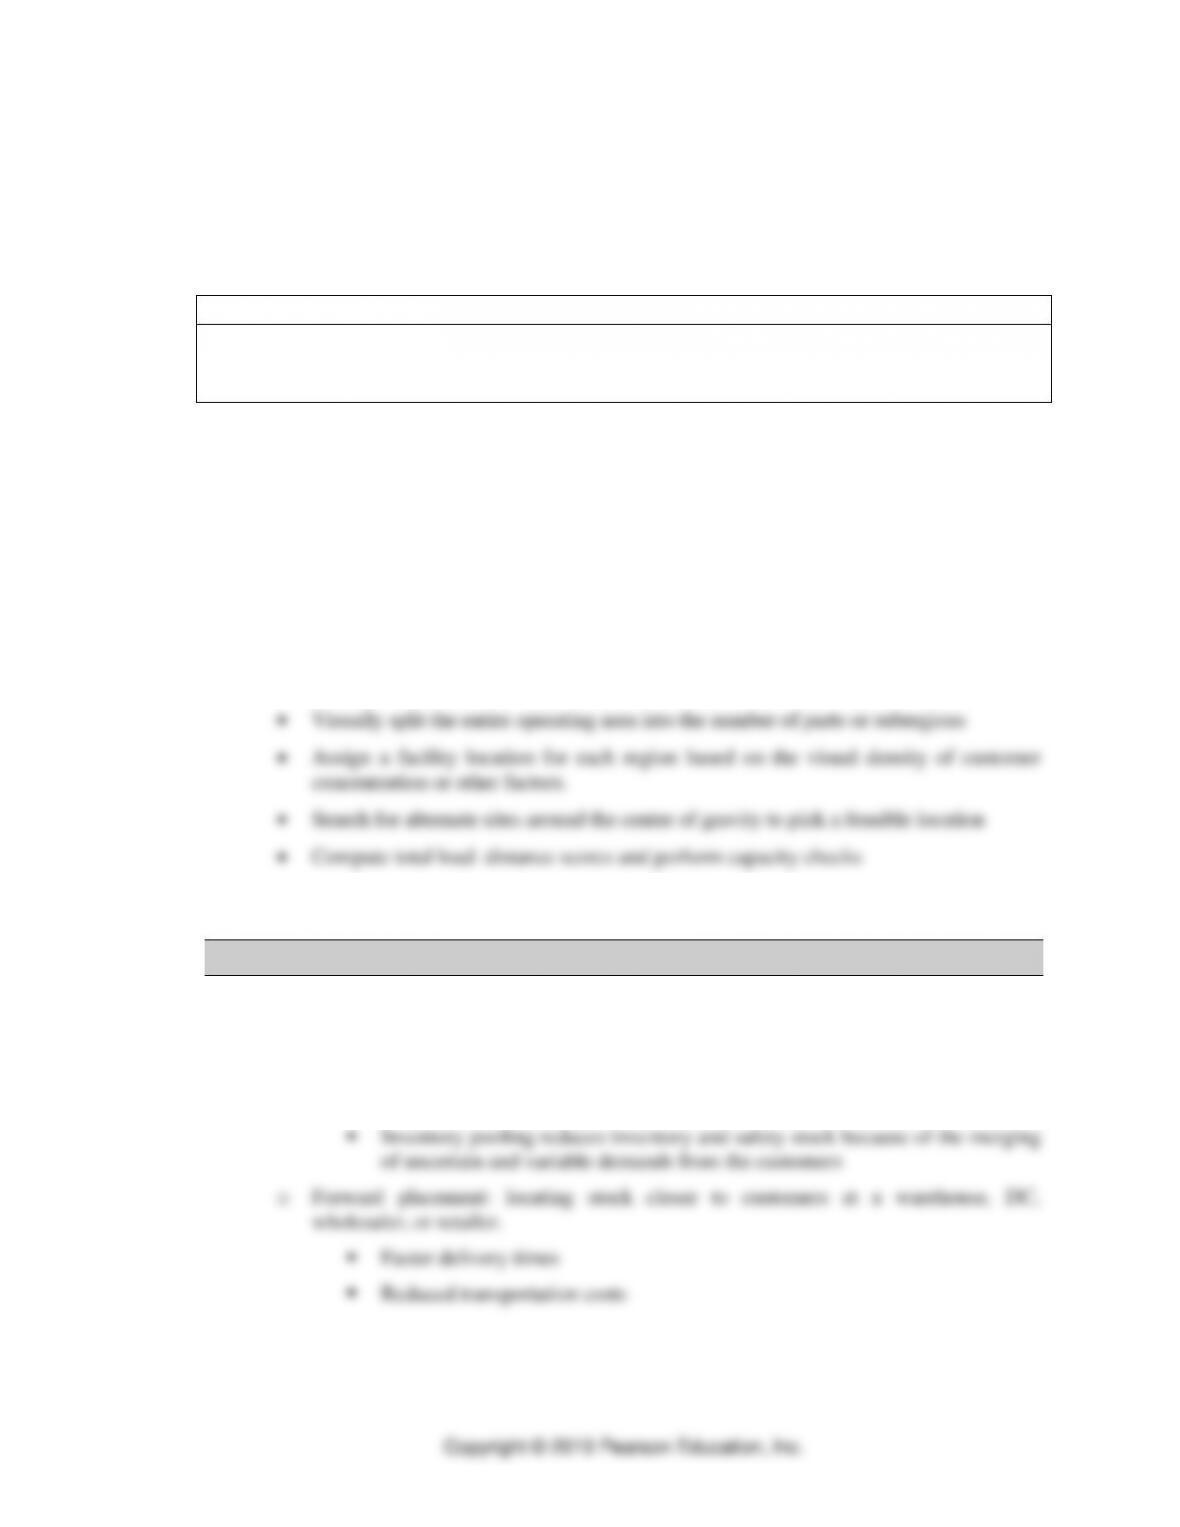
2. The GIS method for locating multiple facilities
a. A five-step framework that captures the use of GIS for locating multiple facilities
• Map the data for existing customers and facilities in the GIS.
b. Starbucks video in MyLab Operations Management shows how to do a geodemographic
analysis using MapPoint 2004.
6. Inventory Placement
• A fundamental supply chain design decision that affects performance
• Two extreme positions
o Centralized placement: keeping all the inventory of a product at a single location and
shipping directly to each of its customers.
7. A Systematic Location Selection Process
• Quantifiable costs and other measures as well as various qualitative factors must be
considered as parts of a complete evaluation.
• Process of selecting a new facility
o Step1: identify the important location factors and categorize them as dominant or
secondary.
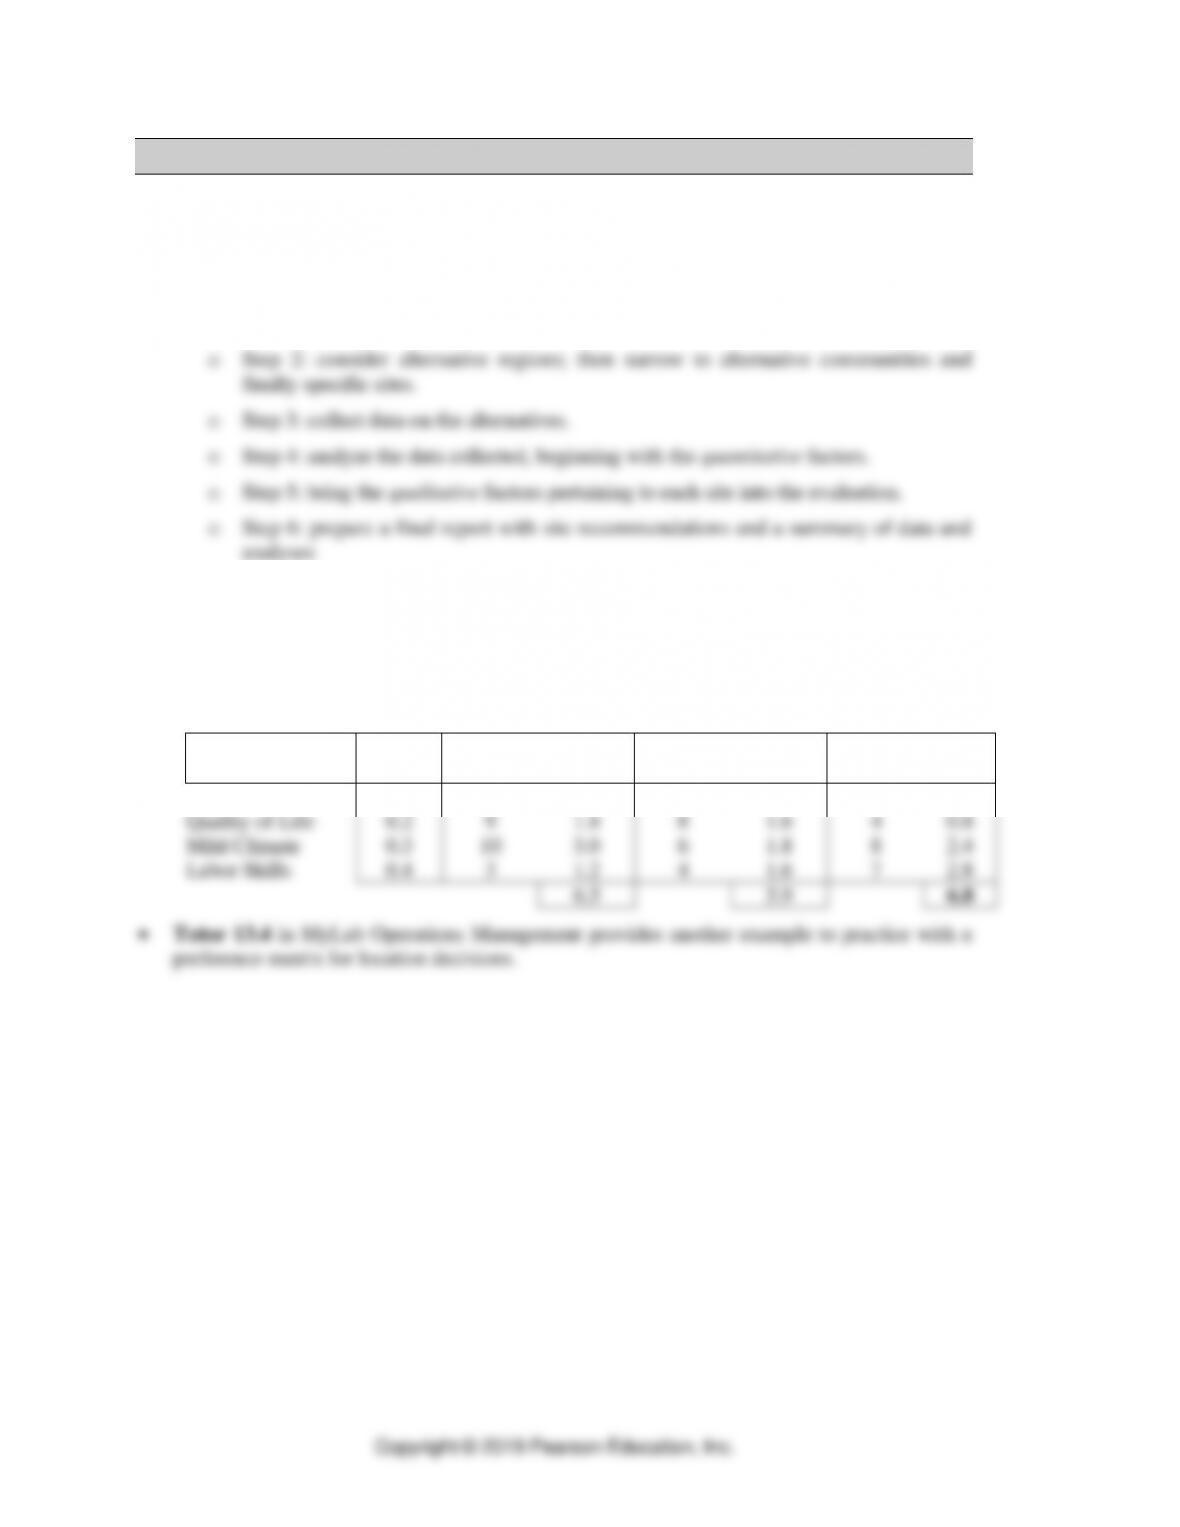
• Use Example 13.4 Calculating Weighted Scores in a Preference Matrix
o Application 13.5: Preference Matrix
o Management is considering three potential locations for a new cookie factory. They
have assigned scores shown below to the relevant factors on a 0 to 10 basis (10 is
best). Using the preference matrix, which location would be preferred?
Location
Factor
Weight
The
Neighborhood
Sesame
Street
Ronald’s
Playhouse
Material Supply
0.1
5
0.5
9
0.9
8
0.8
Quality of Life
0.2
9
1.8
8
1.6
4
0.8
Mild Climate
0.3
10
3.0
6
1.8
8
2.4
Labor Skills
0.4
3
1.2
4
1.6
7
2.8
6.5
5.9
6.8
• Tutor 13.4 in MyLab Operations Management provides another example to practice with a
preference matrix for location decisions.