Chapter
11
Resource Planning
DISCUSSION QUESTIONS
1. Some responses from each functional area could include:
❑ Marketing: The available-to-promise quantities because they determine when
orders can be promised to customers and the history of orders accepted for each
product by time period because this information can be useful in projecting future
demand patterns.
2. A master flight schedule specifies the arrival and departure times for all the flights an
airline must produce to meet customer demands. Here, the lead time is the time
aircraft.
3. The purpose of this exercise is to get the students to think about the usefulness of
ERP for each of their major areas of interest. Because groups consist of different
functional area representatives, the discussion is intended to emphasize the cross–
functional needs that are satisfied with an information system such as ERP. Some
responses to this exercise include:
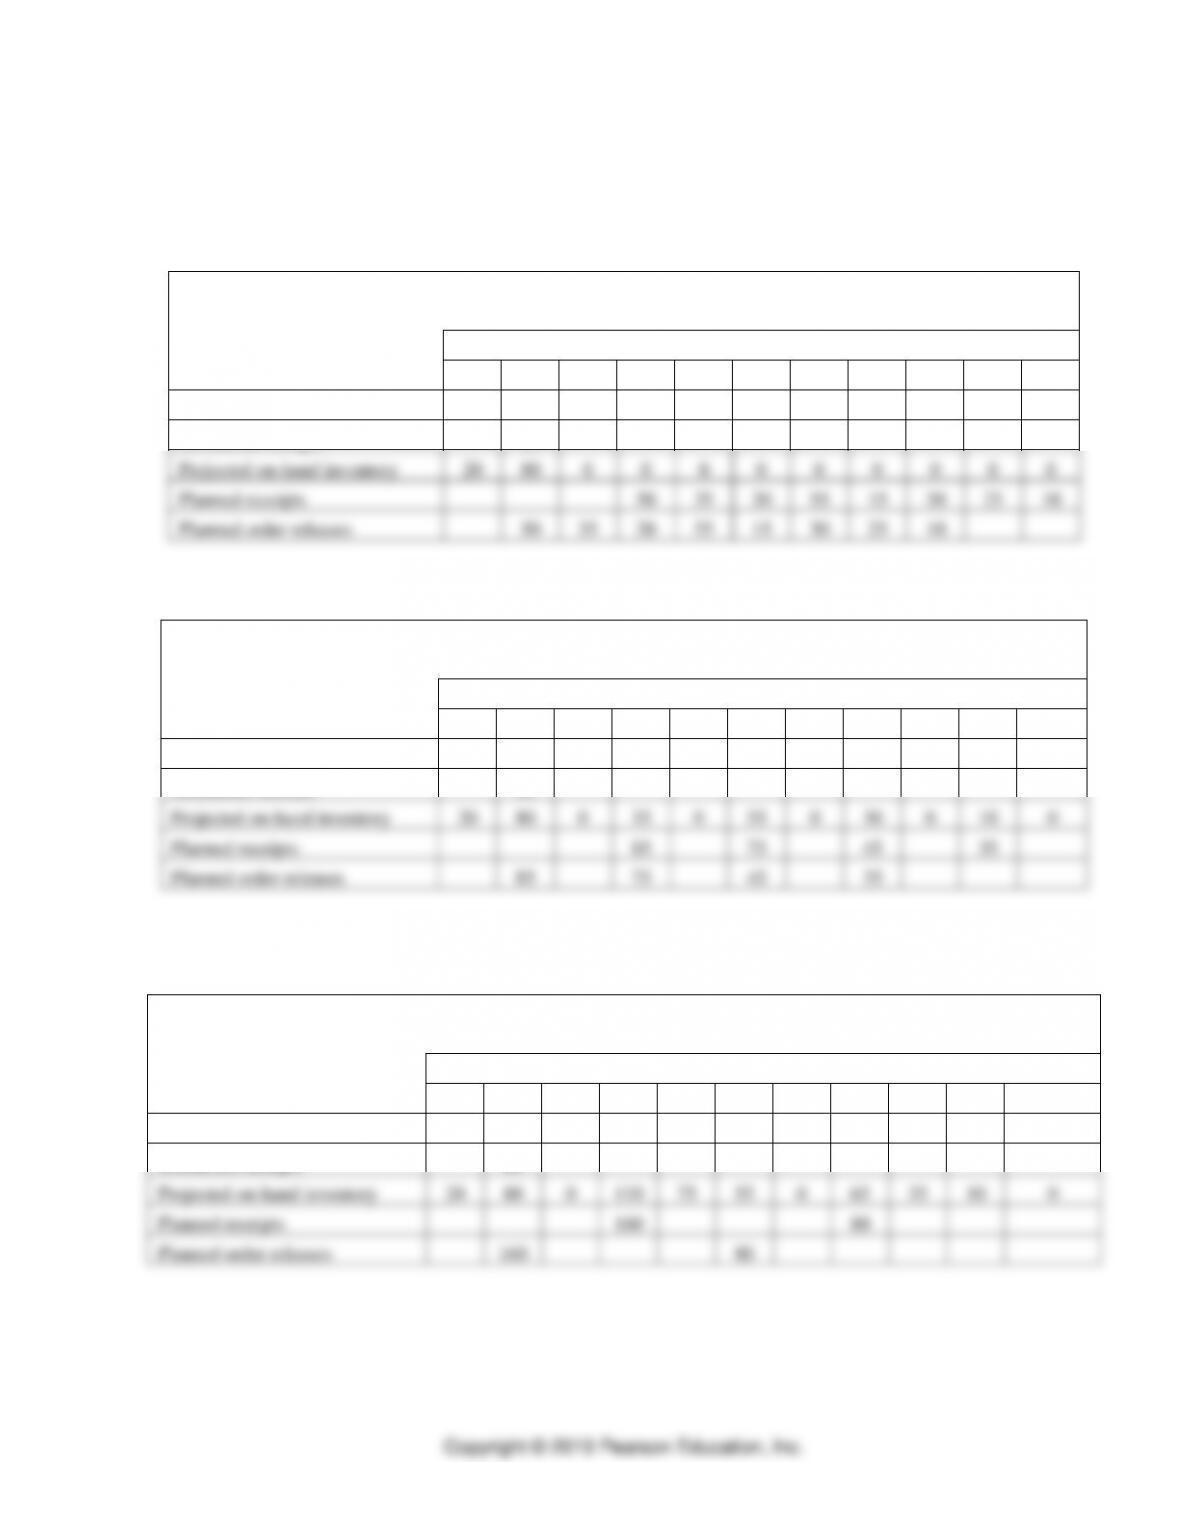
❑ Marketing—information about the availability of finished products that can be
promised for delivery; finished goods inventory performance (service levels,
stockouts).
⚫ PART 2 ⚫ Managing Customer Demand
11-2
4. The principles of MRP can be used for UPS by identifying bills of resources for
PROBLEMS
Master Production Scheduling
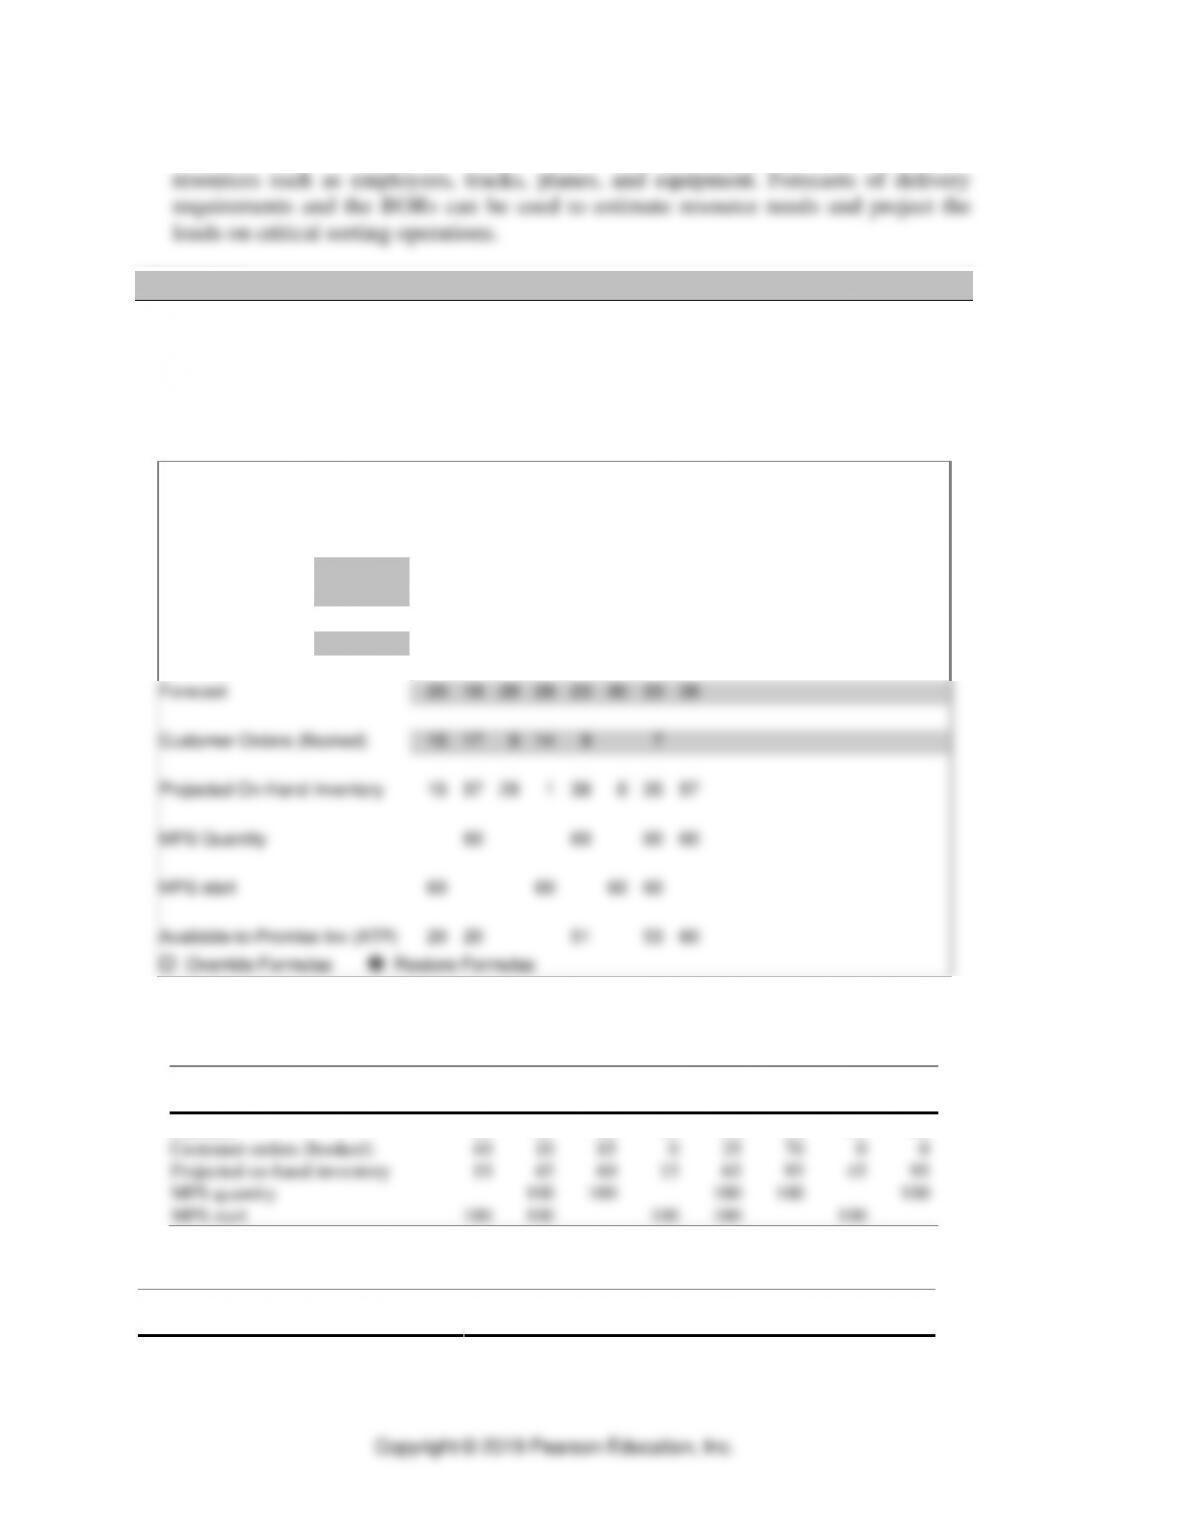
1. MPS record in Figure 11.29 The following table is from the Master Production
Scheduling Solver in OM Explorer. The ATP row is not required for this problem.
Solver Master Production Scheduling
Enter data in yellow shaded areas.
Lot Size
60
Lead Time
1
Quantity on Hand
35
1
2
3
4
5
6
7
8
9
10
11
12
13
14
15
Forecast
20
18
28
28
23
30
33
38
Customer Orders (Booked)
15
17
9
14
9
7
Projected On-Hand Inventory
15
57
29
1
38
8
35
57
MPS Quantity
60
60
60
60
MPS start
60
60
60
60
Available-to-Promise Inv (ATP)
20
20
51
53
60
Override Formulas
Restore Formulas
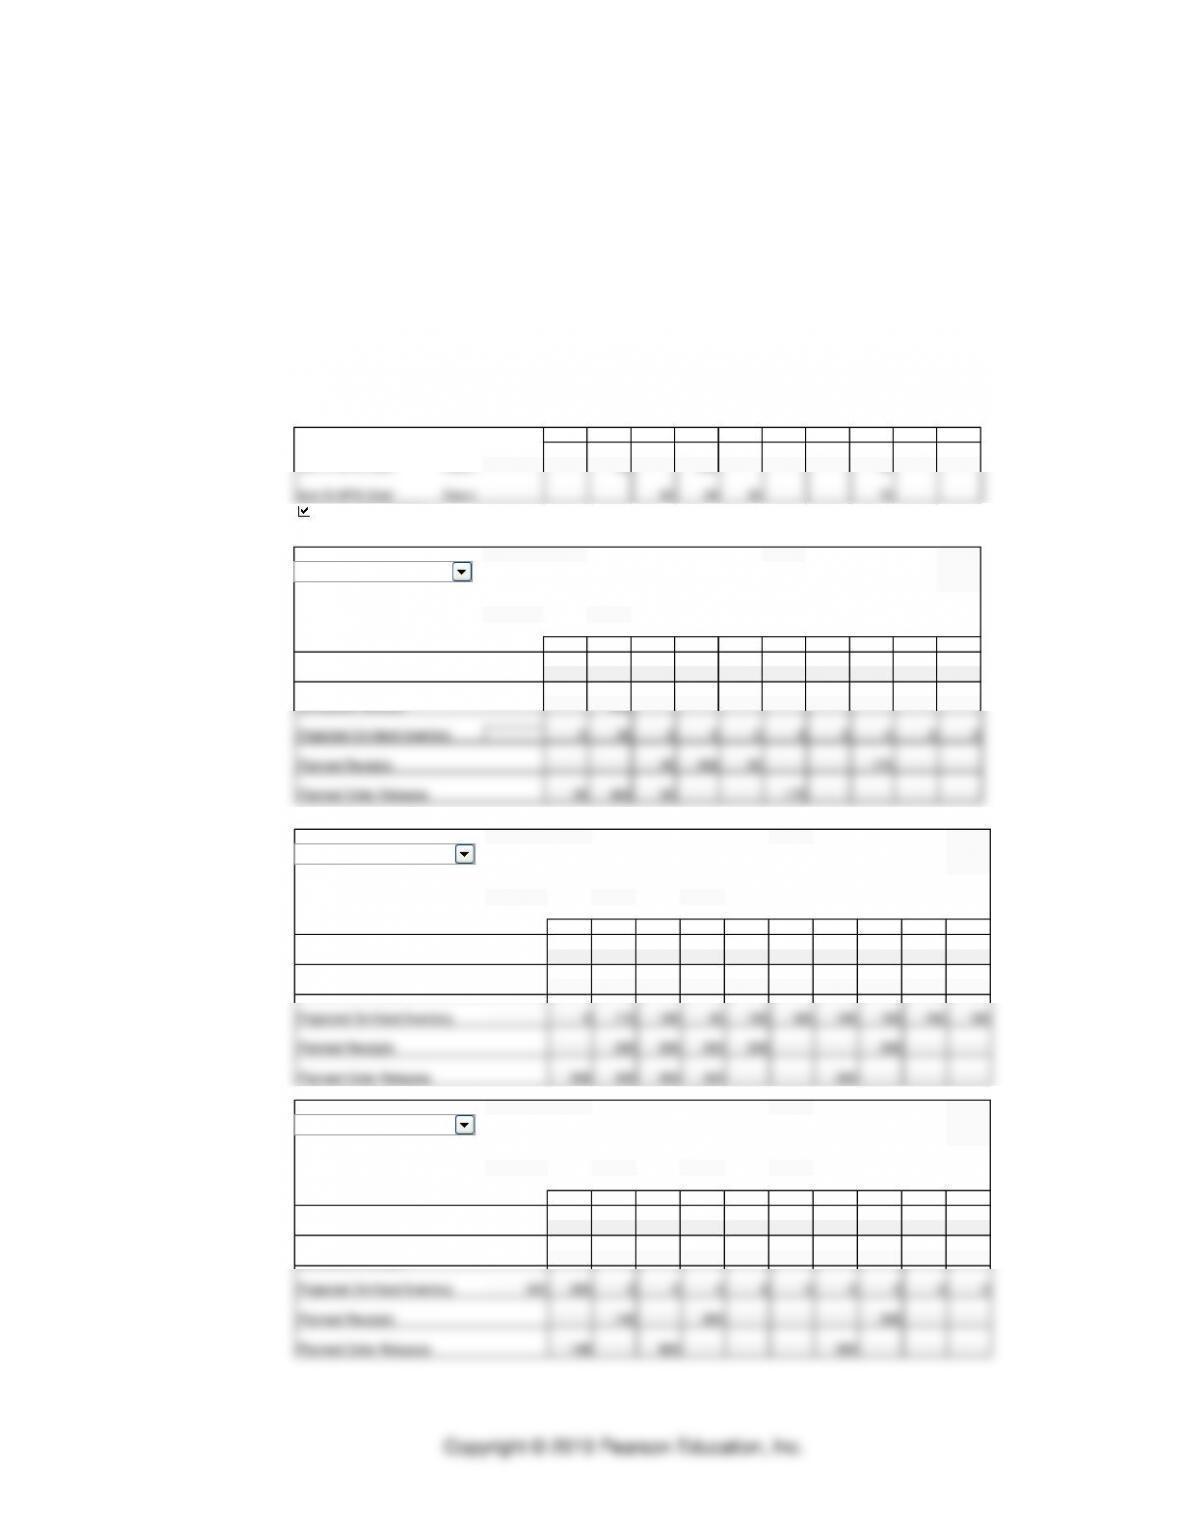
2. MPS record in Figure 11.30
Lot Size: 100
January
February
Quantity on Hand: 75
1
2
3
4
5
6
7
8
Forecast
65
65
65
45
50
50
50
50
Customer orders (booked)
40
10
85
0
35
70
0
0
Projected on-hand inventory
10
45
60
15
65
95
45
95
MPS quantity
100
100
100
100
100
MPS start
100
100
100
100
100
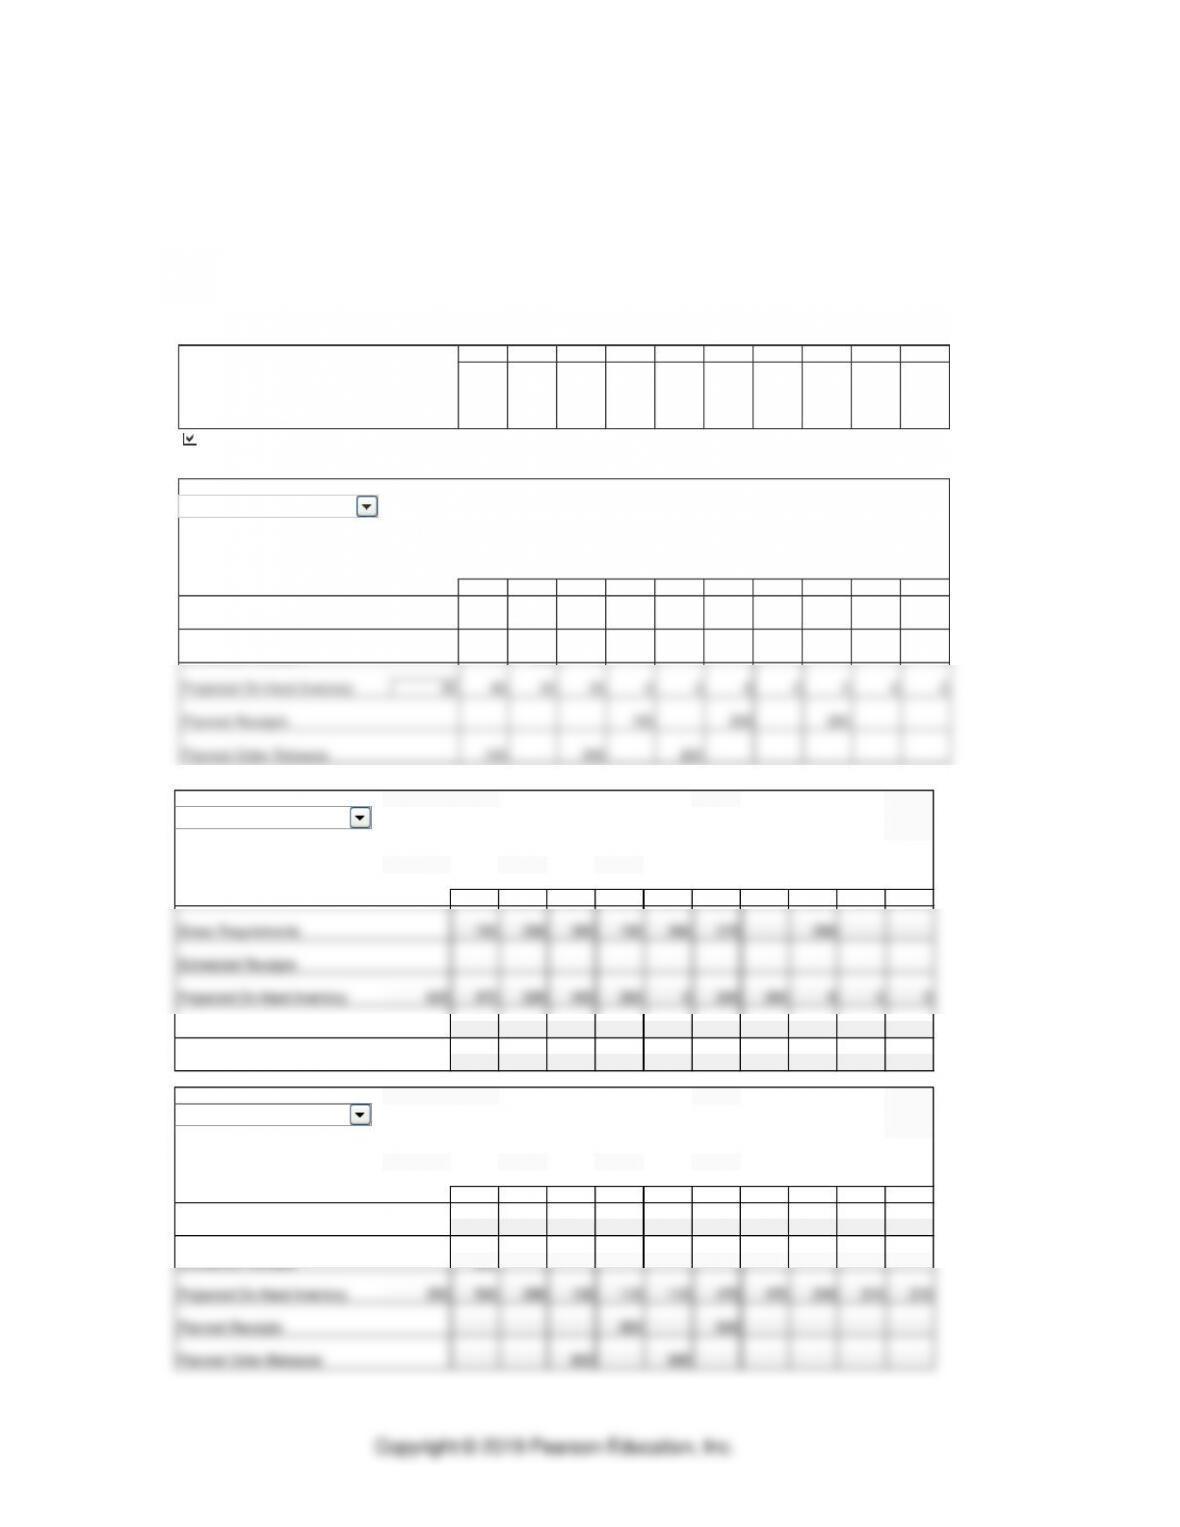
3. An end-item
Lot Size: 100
Week
Quantity on Hand: 80
1
2
3
4
5
6
7
8
9
10
Forecast
30
20
35
50
25
25
0
40
0
50
Customer orders (booked)
22
30
15
9
0
0
5
3
7
0
Resource Planning ⚫ CHAPTER 11
11-3
Projected on-hand inventory
50
20
85
35
10
85
80
40
33
83
MPS quantity
100
100
100
MPS start
100
100
100
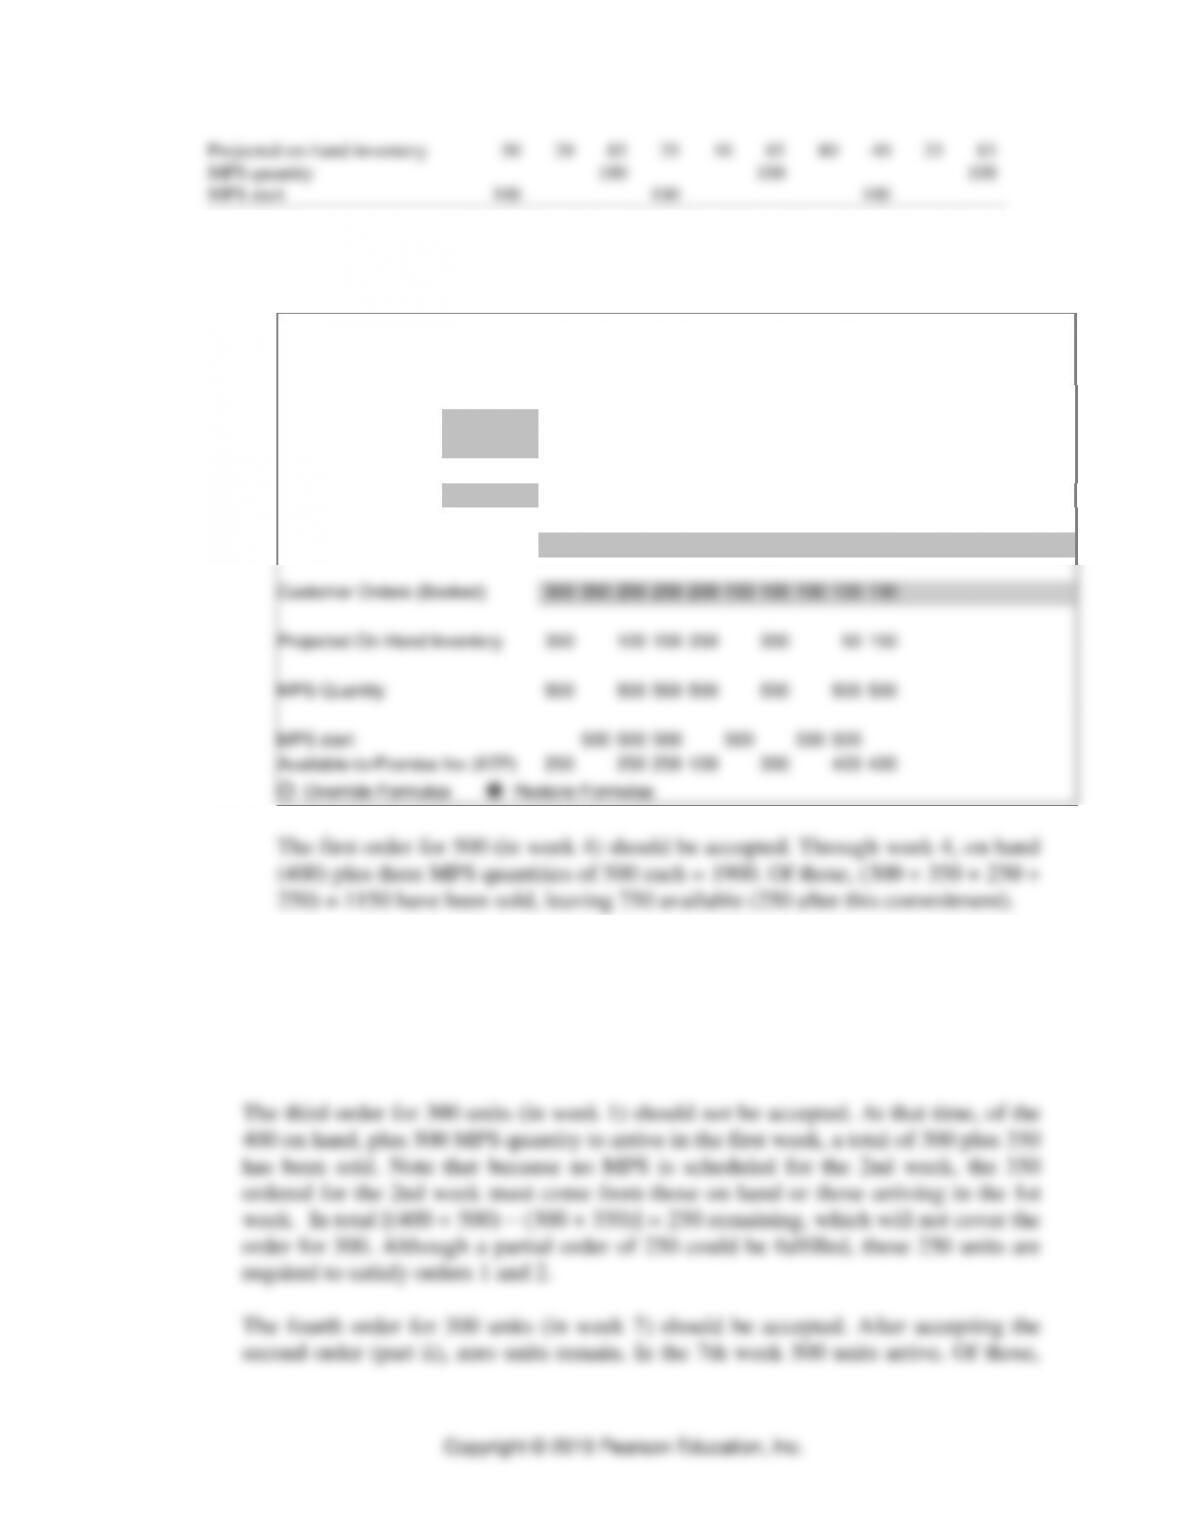
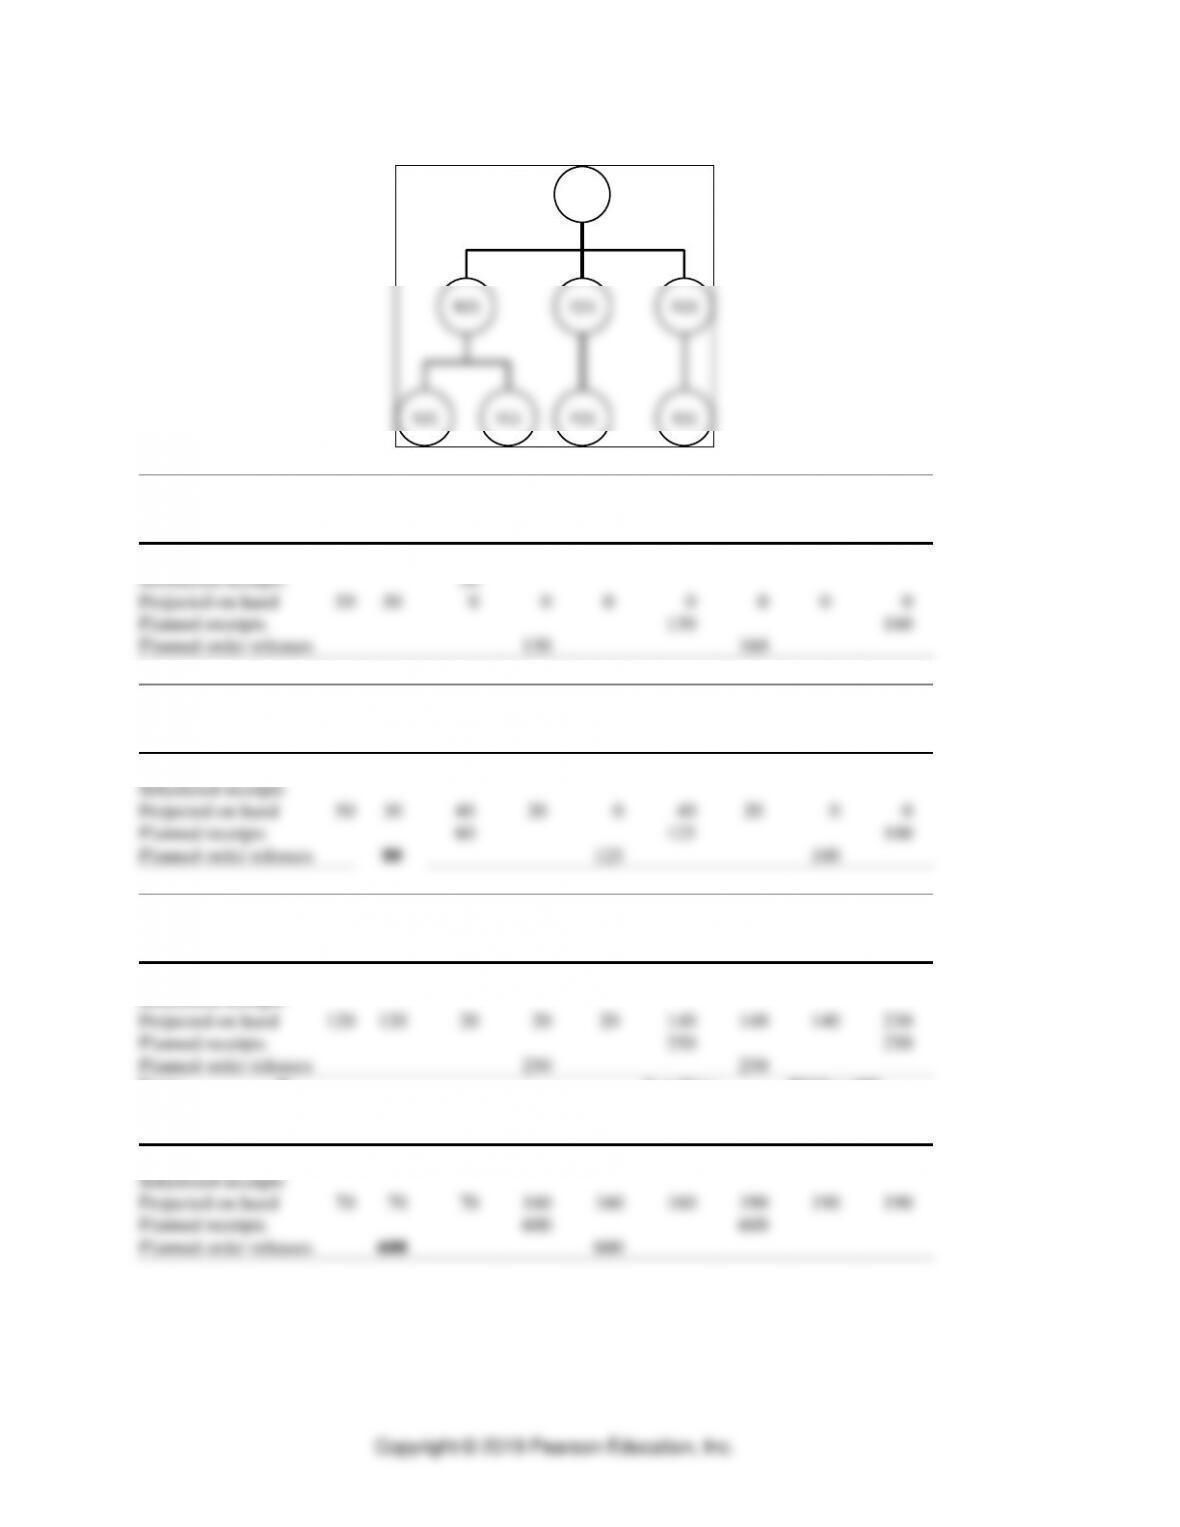
4. Ball Bearings
Prospective MPS
a.
Solver Master Production Scheduling
Enter data in yellow shaded areas.
Lot Size
500
Lead Time
1
Quantity on Hand
400
1
2
3
4
5
6
7
8
9
10
11
12
13
14
15
Forecast
550
300
400
450
300
350
200
300
450
400
Customer Orders (Booked)
300
350
250
250
200
150
100
100
100
100
Projected On-Hand Inventory
350
100
150
350
300
50
150
MPS Quantity
500
500
500
500
500
500
500
MPS start
500
500
500
500
500
500
Available-to-Promise Inv (ATP)
250
250
250
150
300
400
400
Override Formulas
Restore Formulas
The first order for 500 (in week 4) should be accepted. Through week 4, on hand
(400) plus three MPS quantities of 500 each = 1900. Of those, (300 + 350 + 250 +
250) = 1150 have been sold, leaving 750 available (250 after this commitment).
b. The second order for 400 (in week 5) should be accepted. Through week 5, the
250 remaining after the first order plus one more MPS quantity of 500 = 750. Of
those, 200 have been sold in the 5th week and 150 in the 6th week. Therefore,
(250 + 500 – 200 – 150) = 400 are still available. There will be zero units
remaining for sale even after accepting this order.
⚫ PART 2 ⚫ Managing Customer Demand
11-4
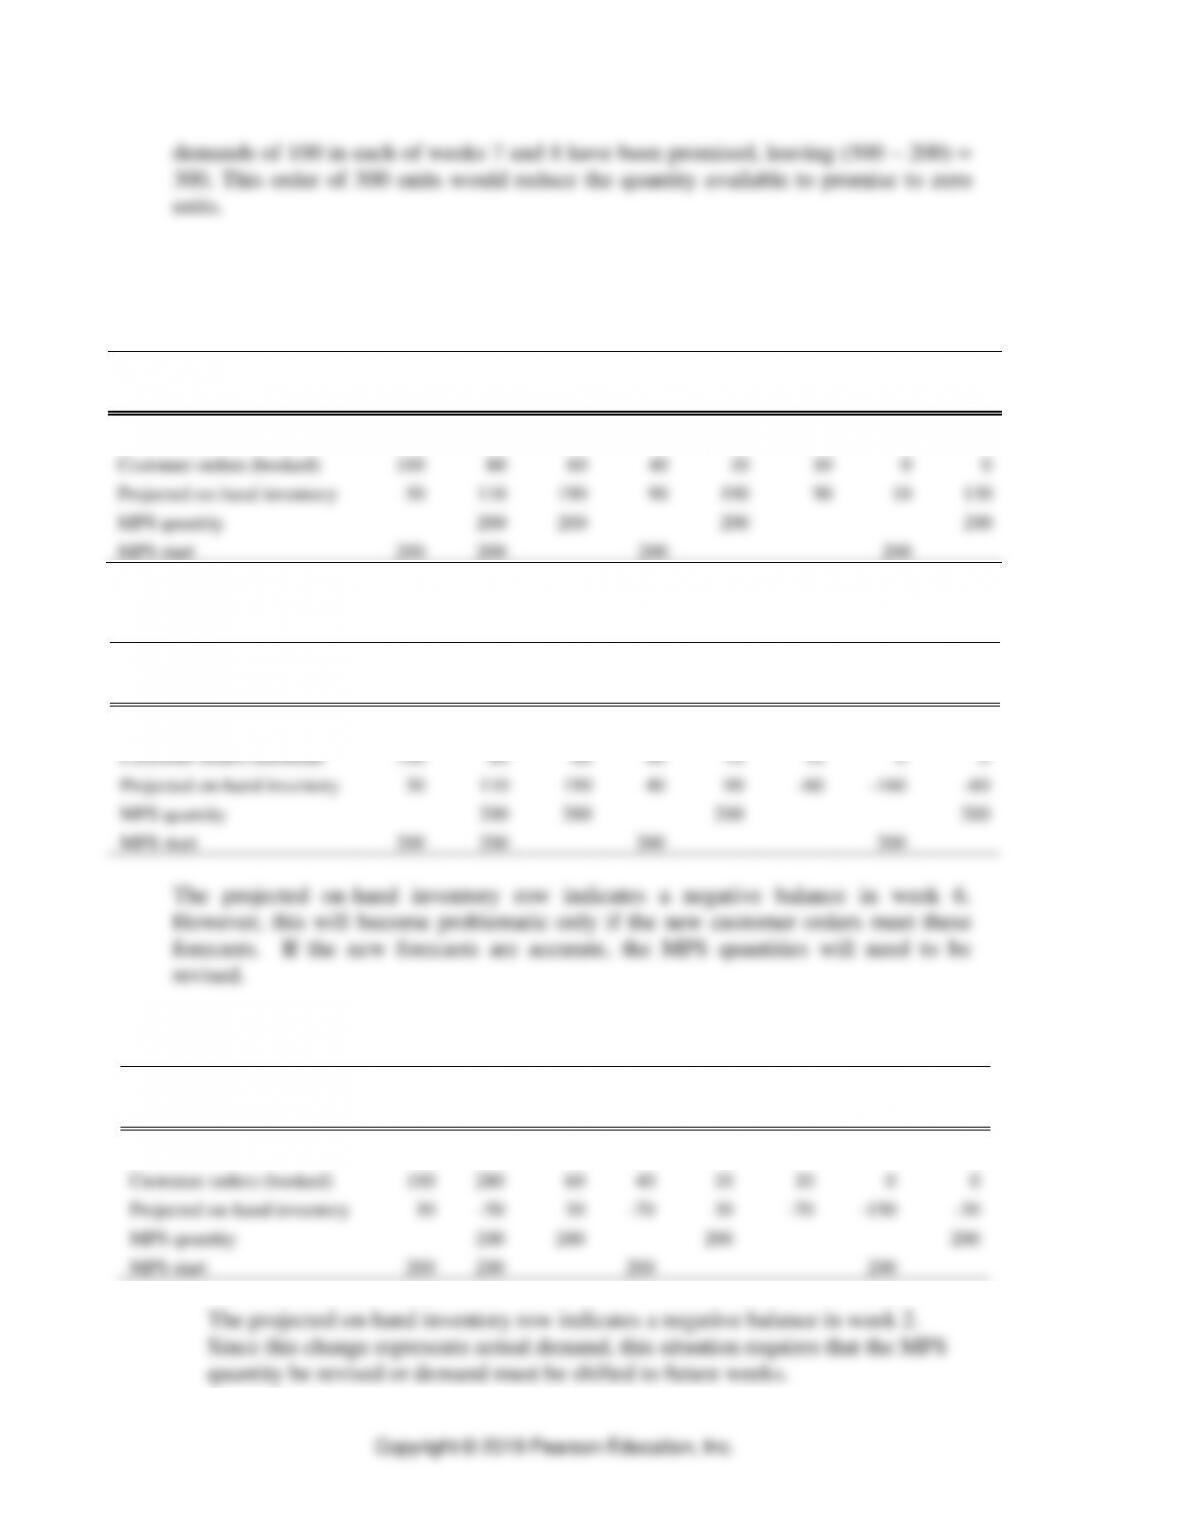
5. Tabard Industries
a. The prospective MPS
Week
Quantity on Hand: 150
1
2
3
4
5
6
7
8
Forecast
120
120
120
100
100
100
80
80
Customer orders (booked)
100
80
60
40
10
10
0
0
Projected on-hand inventory
30
110
190
90
190
90
10
130
MPS quantity
200
200
200
200
MPS start
200
200
200
200
b. The revised MPS given changes in forecasted demand
Week
Quantity on Hand: 150
1
2
3
4
5
6
7
8
Forecast
120
120
120
150
150
150
100
100
Customer orders (booked)
100
80
60
40
10
10
0
0
Projected on-hand inventory
30
110
190
40
90
–60
–160
–60
MPS quantity
200
200
200
200
MPS start
200
200
200
200
c. The revised MPS given a newly accepted customer order
Week
Quantity on Hand: 150
1
2
3
4
5
6
7
8
Forecast
120
120
120
100
100
100
80
80
Customer orders (booked)
100
280
60
40
10
10
0
0
Projected on-hand inventory
30
–50
30
–70
30
–70
–150
–30
MPS quantity
200
200
200
200
MPS start
200
200
200
200
Resource Planning ⚫ CHAPTER 11
11-5
6. Completed MPS Record
ITEM: 2″ Pneumatic Control Valve ORDER POLICY: 75 units
LEAD TIME: 1 week QUANTITY ON HAND: 10 units
Week
1
2
3
4
5
6
7
8
Forecast requirements
40
40
40
40
30
30
50
50
Customer orders (booked)
60
45
30
35
10
5
5
0
Projected on-hand inventory
25
55
15
50
20
65
15
40
MPS quantity
75
75
75
75
75
MPS start
75
75
75
75
Available-to-promise
(ATP) inventory
25
30
65
75
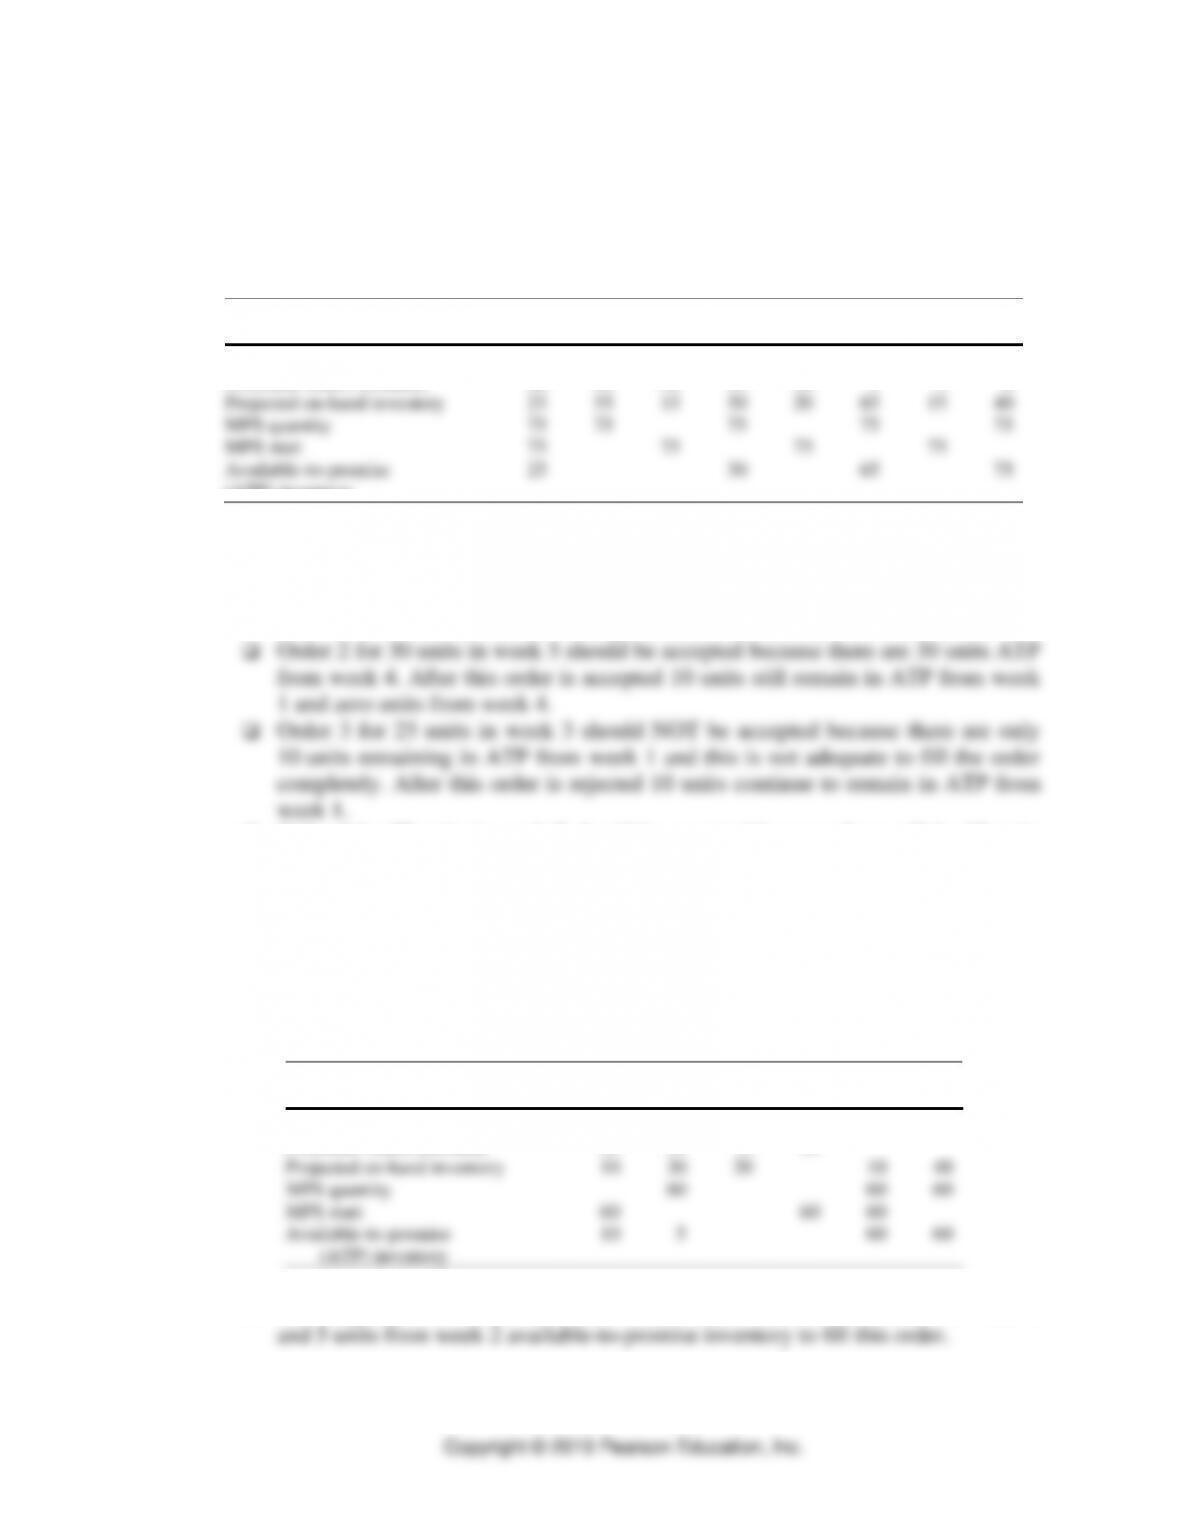
Decisions on the arriving orders:
❑ Order 1 for 15 units in week 2 should be accepted because there are 25 units ATP
from week 1. After this order is accepted 10 units remain in ATP from Week 1.
❑ Order 4 for 75 units in week 7 should be accepted because there will be 65 units
in ATP from week 6, which, along with the 10 units that continue to remain in
ATP from week 1, will be adequate to fill the order completely.
7. a. Completed MPS Record
ITEM: Electric Hand Drill ORDER POLICY: 60 units
LEAD TIME: 1 week QUANTITY ON HAND: 30 units
Week
1
2
3
4
5
6
Forecast requirements
15
40
10
20
50
30
Customer orders (booked)
20
25
10
20
Projected on-hand inventory
10
30
20
10
40
MPS quantity
60
60
60
MPS start
60
60
60
Available-to-promise
(ATP) inventory
10
5
60
60
b. The shipping date would be week 2 because we will have 10 units from week 1
⚫ PART 2 ⚫ Managing Customer Demand
11-6
8. Completed MPS record
ITEM: Product C ORDER POLICY: 40 units
LEAD TIME: 2 weeks QUANTITY ON HAND: 10 units
Week
1
2
3
4
5
6
7
8
9
10
11
12
Forecast requirements
15
15
15
15
20
20
20
20
15
15
15
15
Customer orders
(booked)
25
12
8
10
2
3
0
0
0
0
0
0
Projected on-hand
inventory
25
10
35
20
0
20
0
20
5
30
15
0
MPS quantity
40
40
40
40
40
MPS start
40
40
40
40
Available-to-promise
(ATP) inventory
13
20
37
40
40
9. Master Production Schedule for end item
a. MPS
Lot Size: 100 LT = 2 weeks
Week
Quantity on Hand: 60
1
2
3
4
5
6
7
8
9
10
Forecast
30
30
30
30
30
30
25
25
25
25
Customer orders (booked)
22
30
15
11
0
0
9
0
0
0
Projected on-hand inventory
30
0
70
40
10
80
55
30
5
80
MPS quantity
100
100
100
MPS start
100
100
100
ATP
8
74
91
100
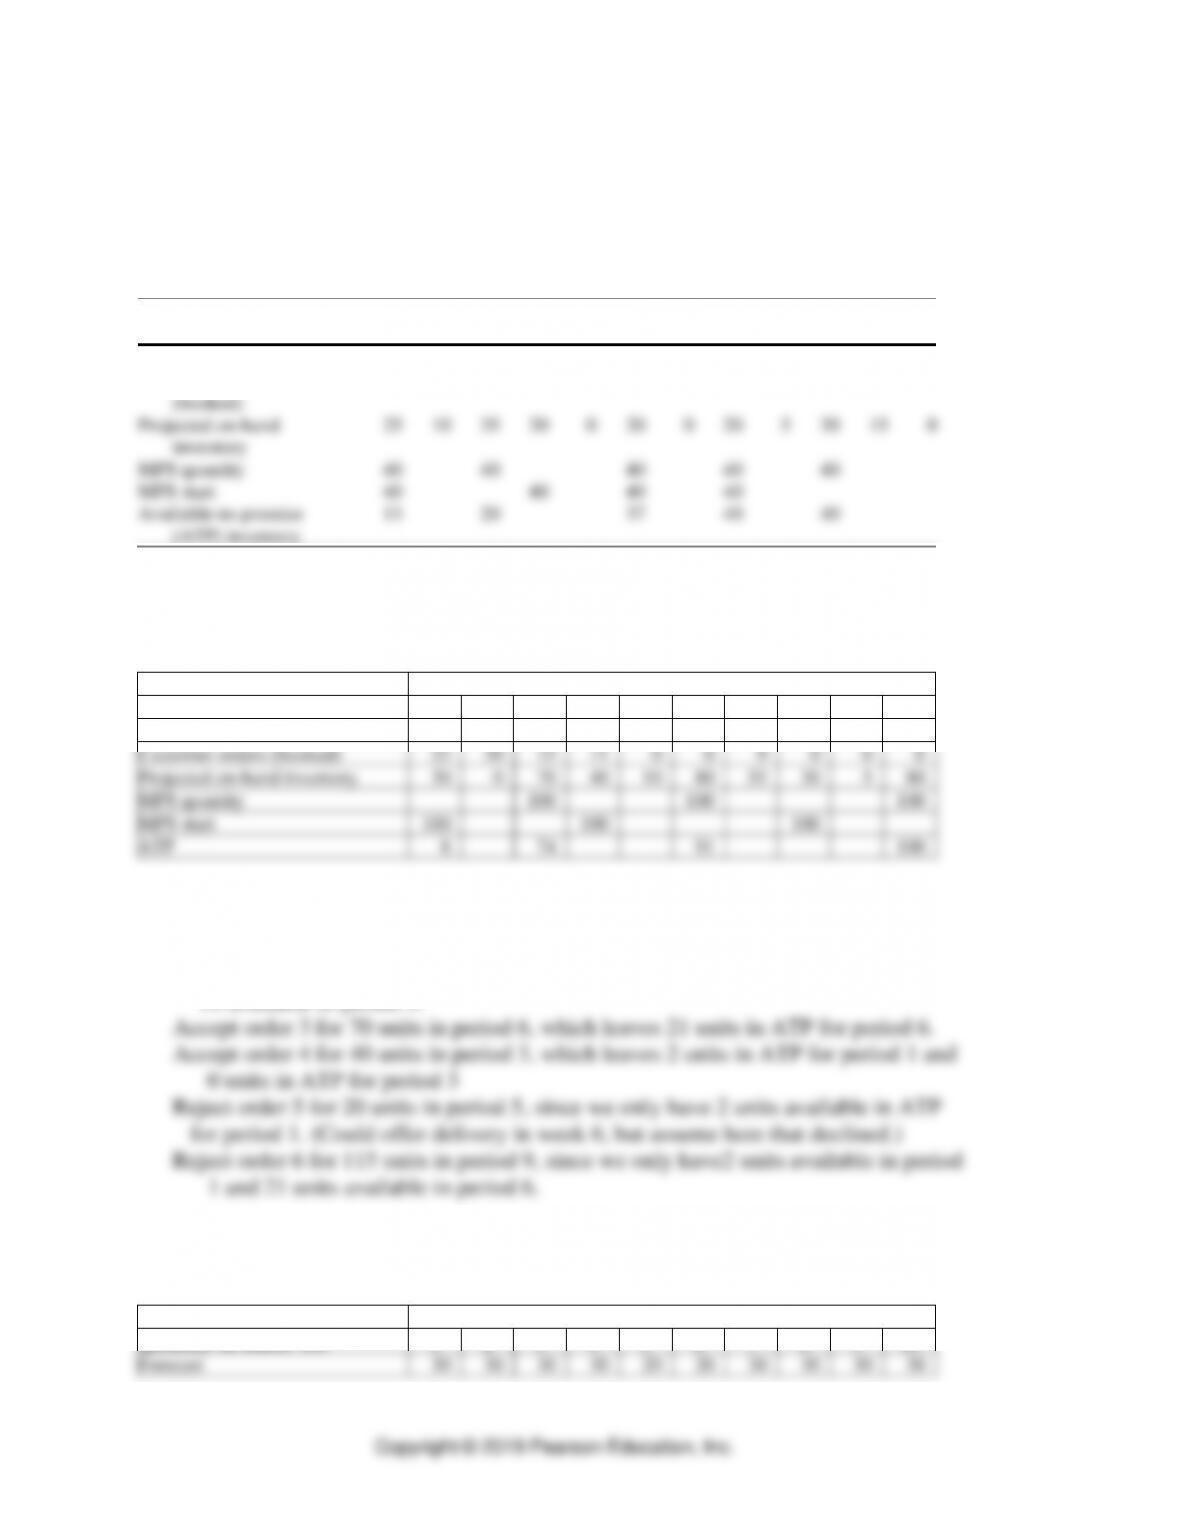
b. Order Acceptance
Accept order 1 for 40 units in period 3, which leaves 34 units in ATP for period 3.
Reject order 2 for 60 units in period 4, since we only have 8 available in period 1 and
34 available in period 3.
10. Master Production Schedule for an end item
a. MPS
Lot Size: 75 LT = 2 weeks
Week
Quantity on Hand: 100
1
2
3
4
5
6
7
8
9
10
Forecast
30
30
30
30
20
20
30
30
30
30
Resource Planning ⚫ CHAPTER 11
11-7
Customer orders (booked)
15
38
7
5
0
3
10
0
0
0
Projected on-hand inventory
70
32
2
47
27
7
52
22
67
37
MPS quantity
75
75
75
MPS Start
75
75
75
ATP
40
67
65
75
b. Order Acceptance
Accept order 1, which leaves 20 units in ATP for period 1.
MRP Explosion
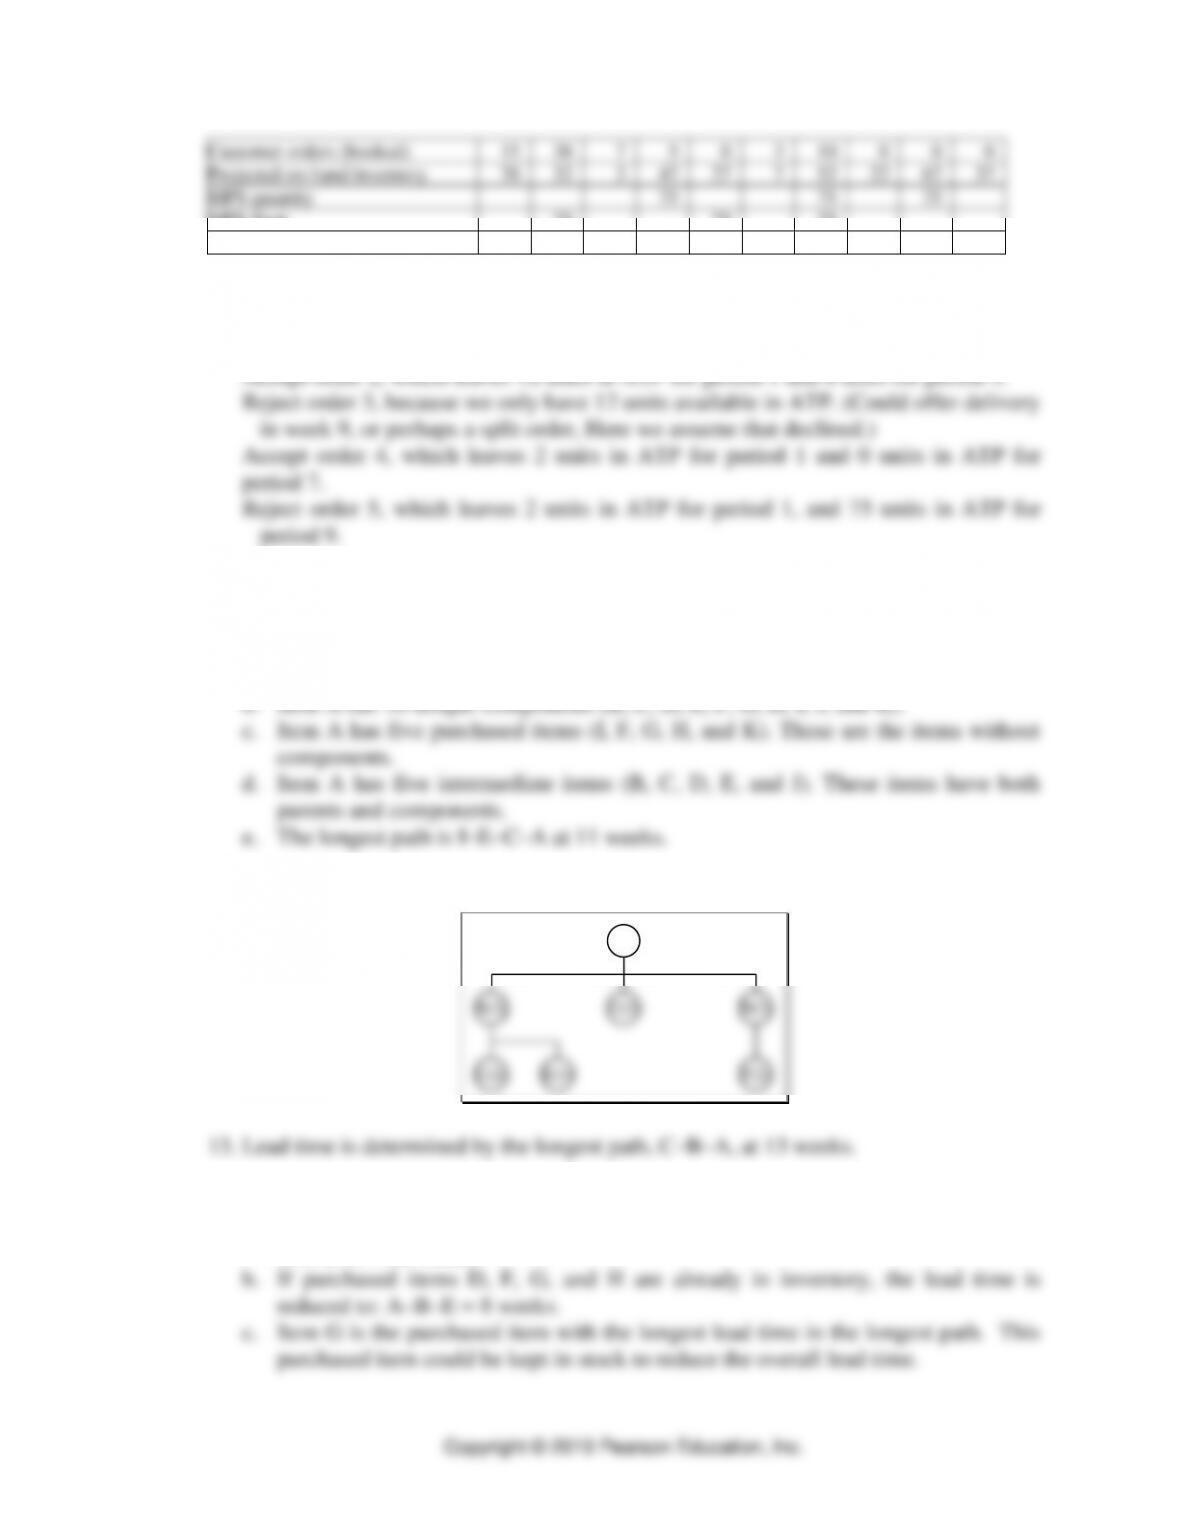
11. Bill of materials, Figure 11.33
a. Item I has only one parent (E). However, item E has two parents (B and C).
12. Item A. The bill of materials for item A is shown following.
A
C(2) D(2)
B(2)
E(1)
C(2) F(2)
14. The bill of materials for item A with lead times is shown following.
a. Lead time is determined by the longest path
G-E-B-A = 12 weeks.
⚫ PART 2 ⚫ Managing Customer Demand
11-8
A
C(1)
B(1)
E(1)
D(1)
H(1)
G(1)
H(1)
F(1)
LT = 1
LT = 2LT = 2
LT = 6 LT = 5 LT = 6 LT = 3
LT = 4 LT = 3
15. Refer to Figure 11.23 and Solved Problem 1.
A
C(1)
B(3)
E(2)
D(1)
G(1)
D(1)
F(1)
LT = 1
LT = 3LT = 2
LT = 3 LT = 6 LT = 1 LT = 3
LT = 3
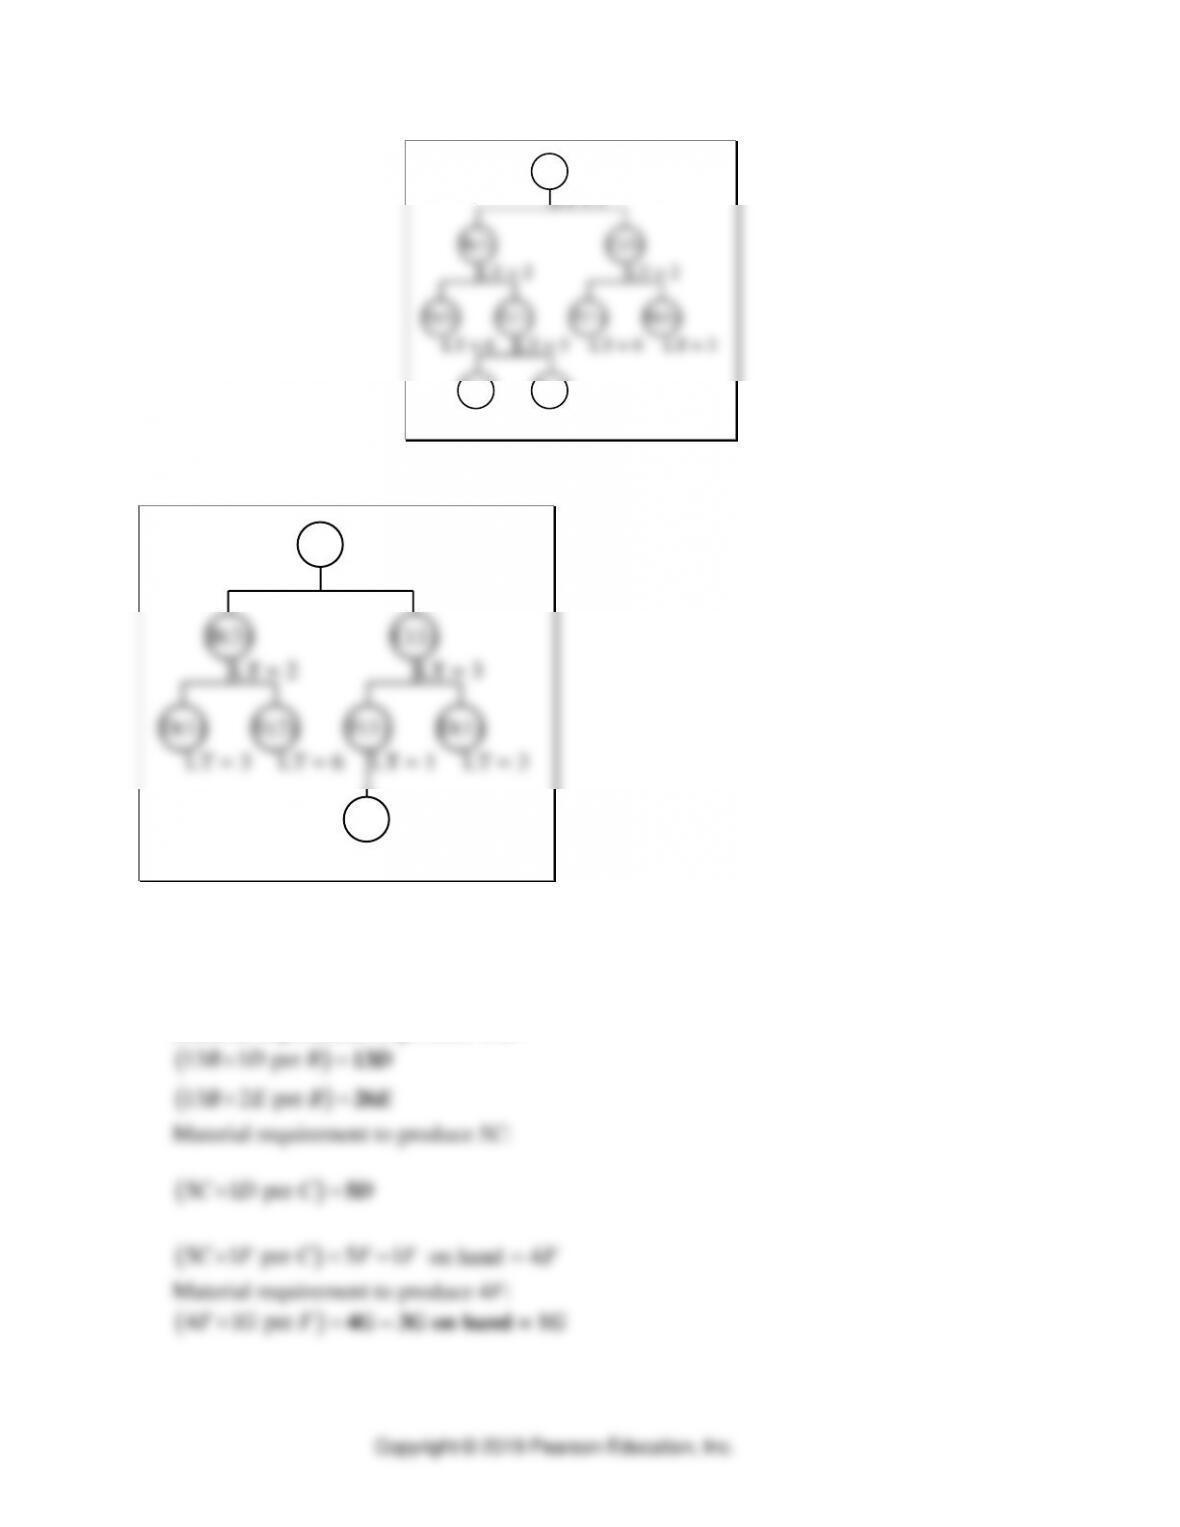
Material requirement to produce 5 units of end-item A:
( )
5 3 per 15 2A B A B B = −
on hand
=13B
( )
5 1 per 5A C A C=
Material requirement to produce 13B:
Resource Planning ⚫ CHAPTER 11
11-9
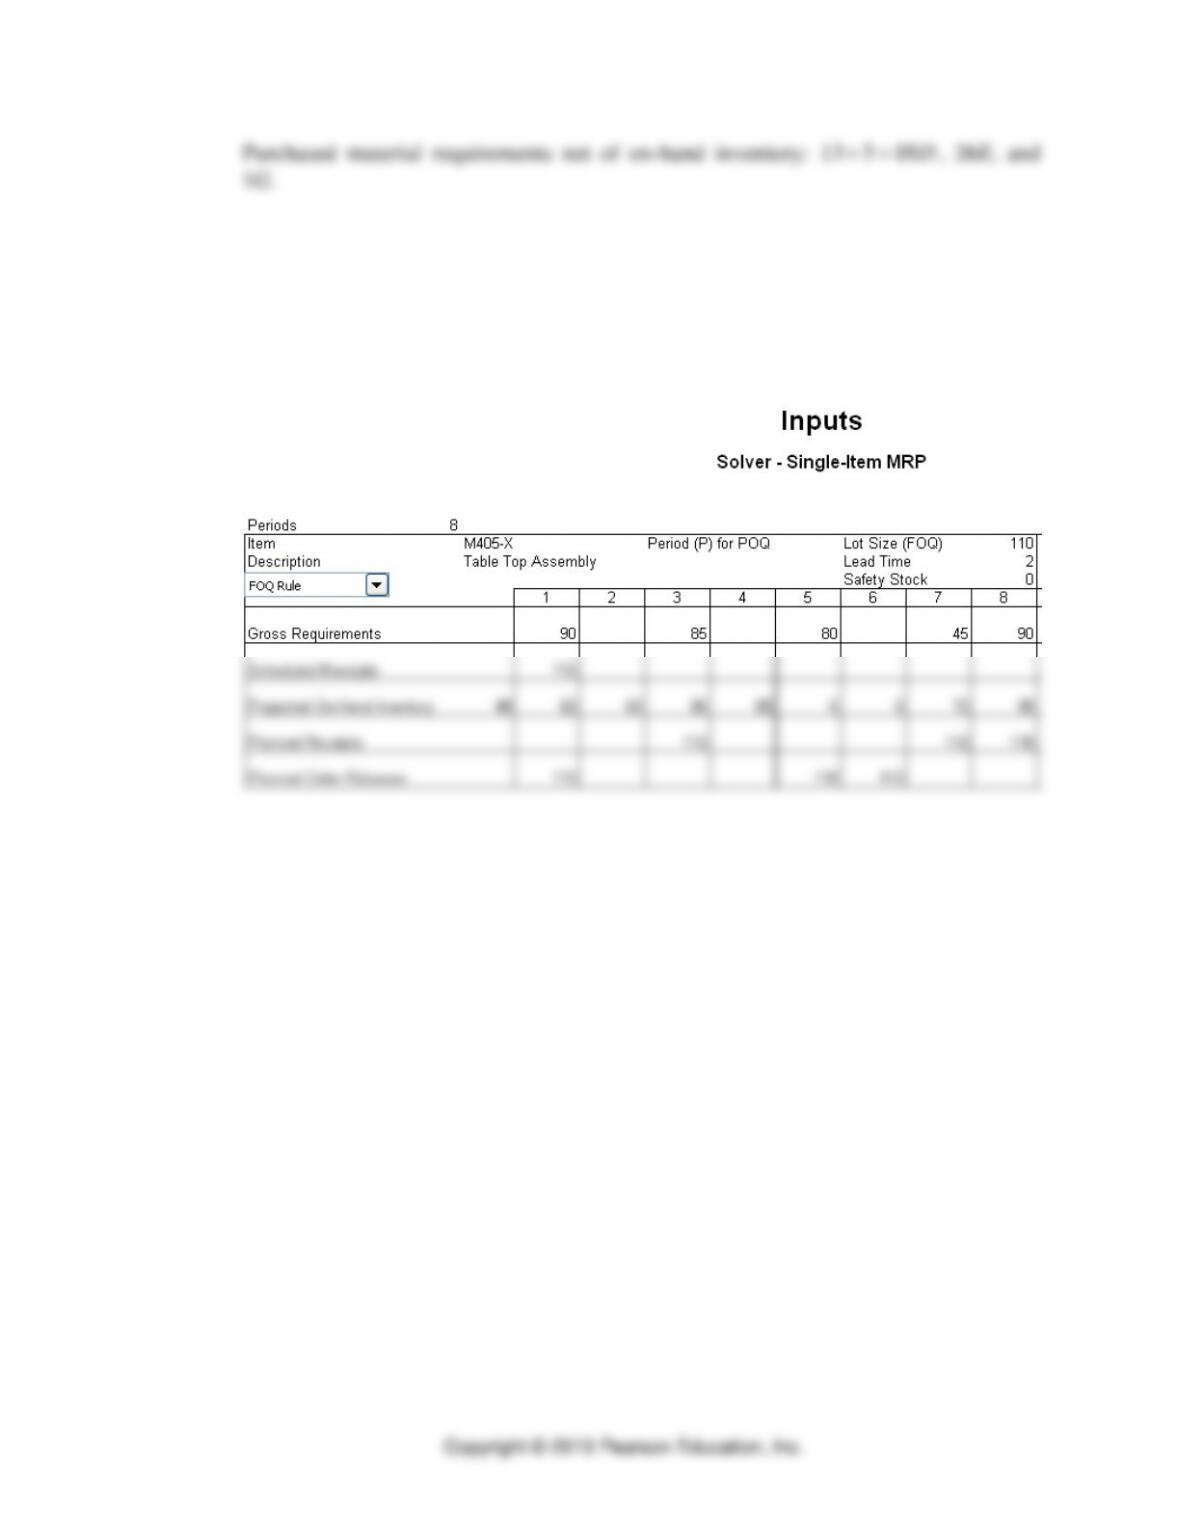
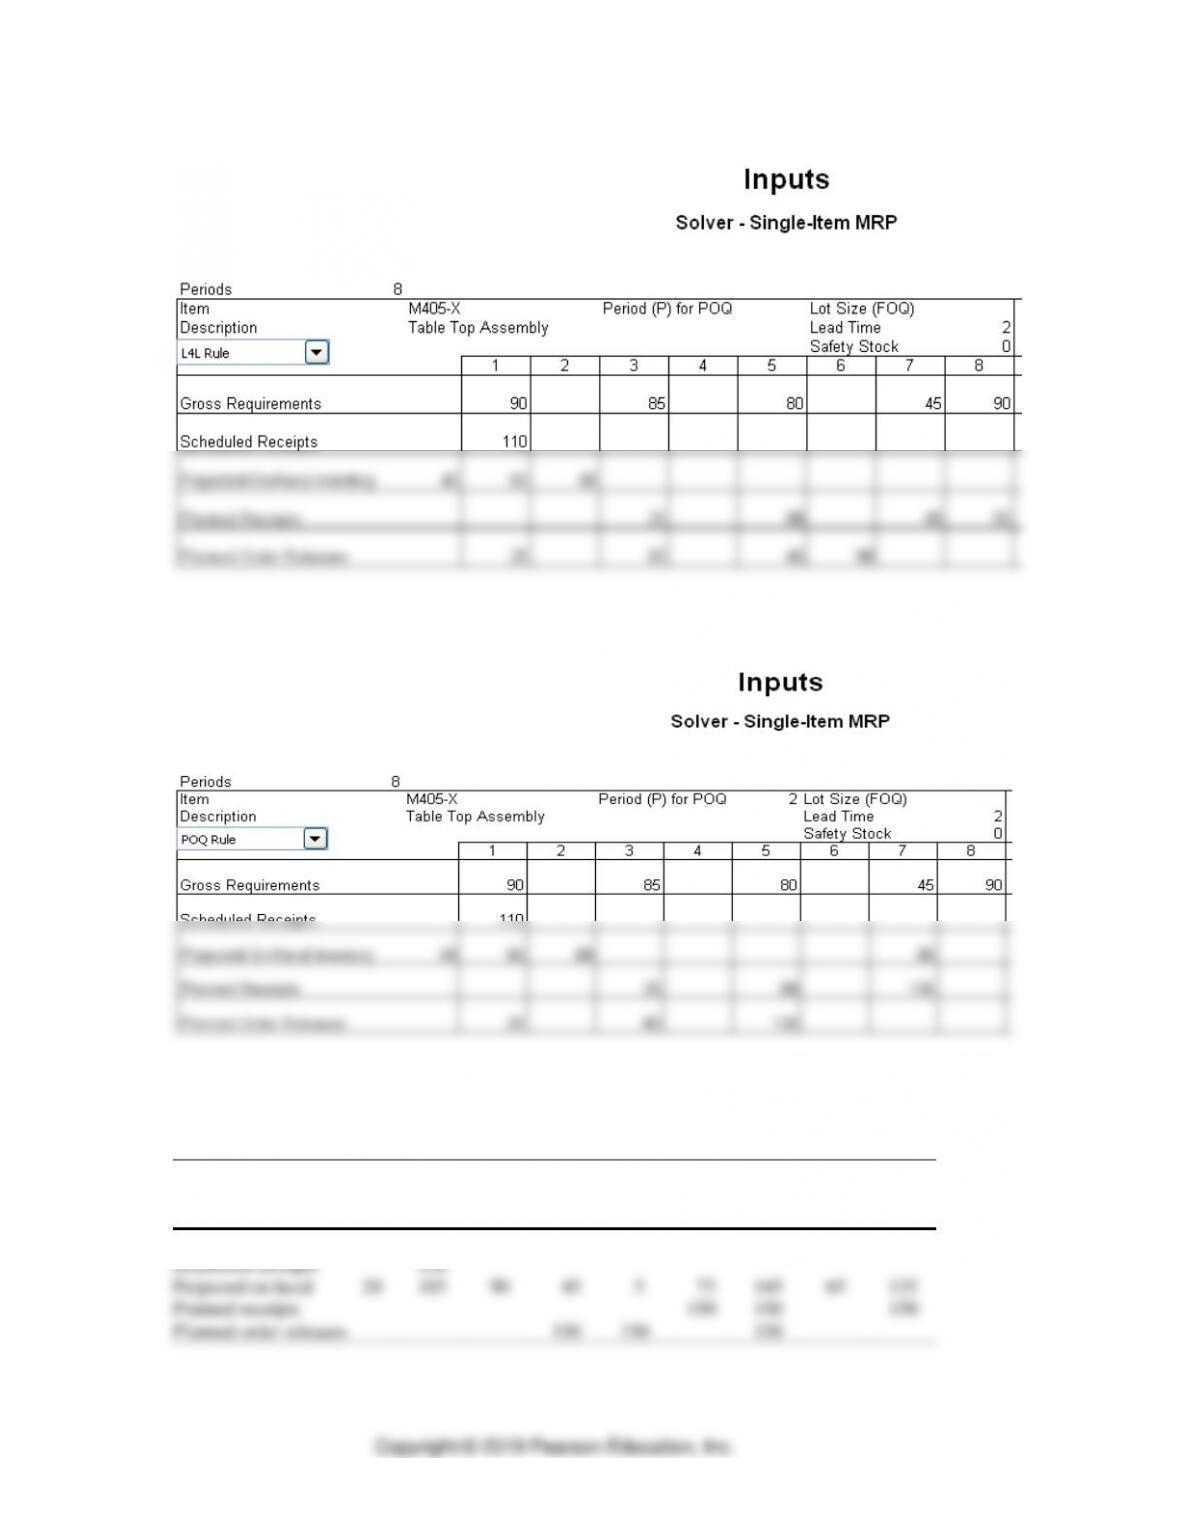
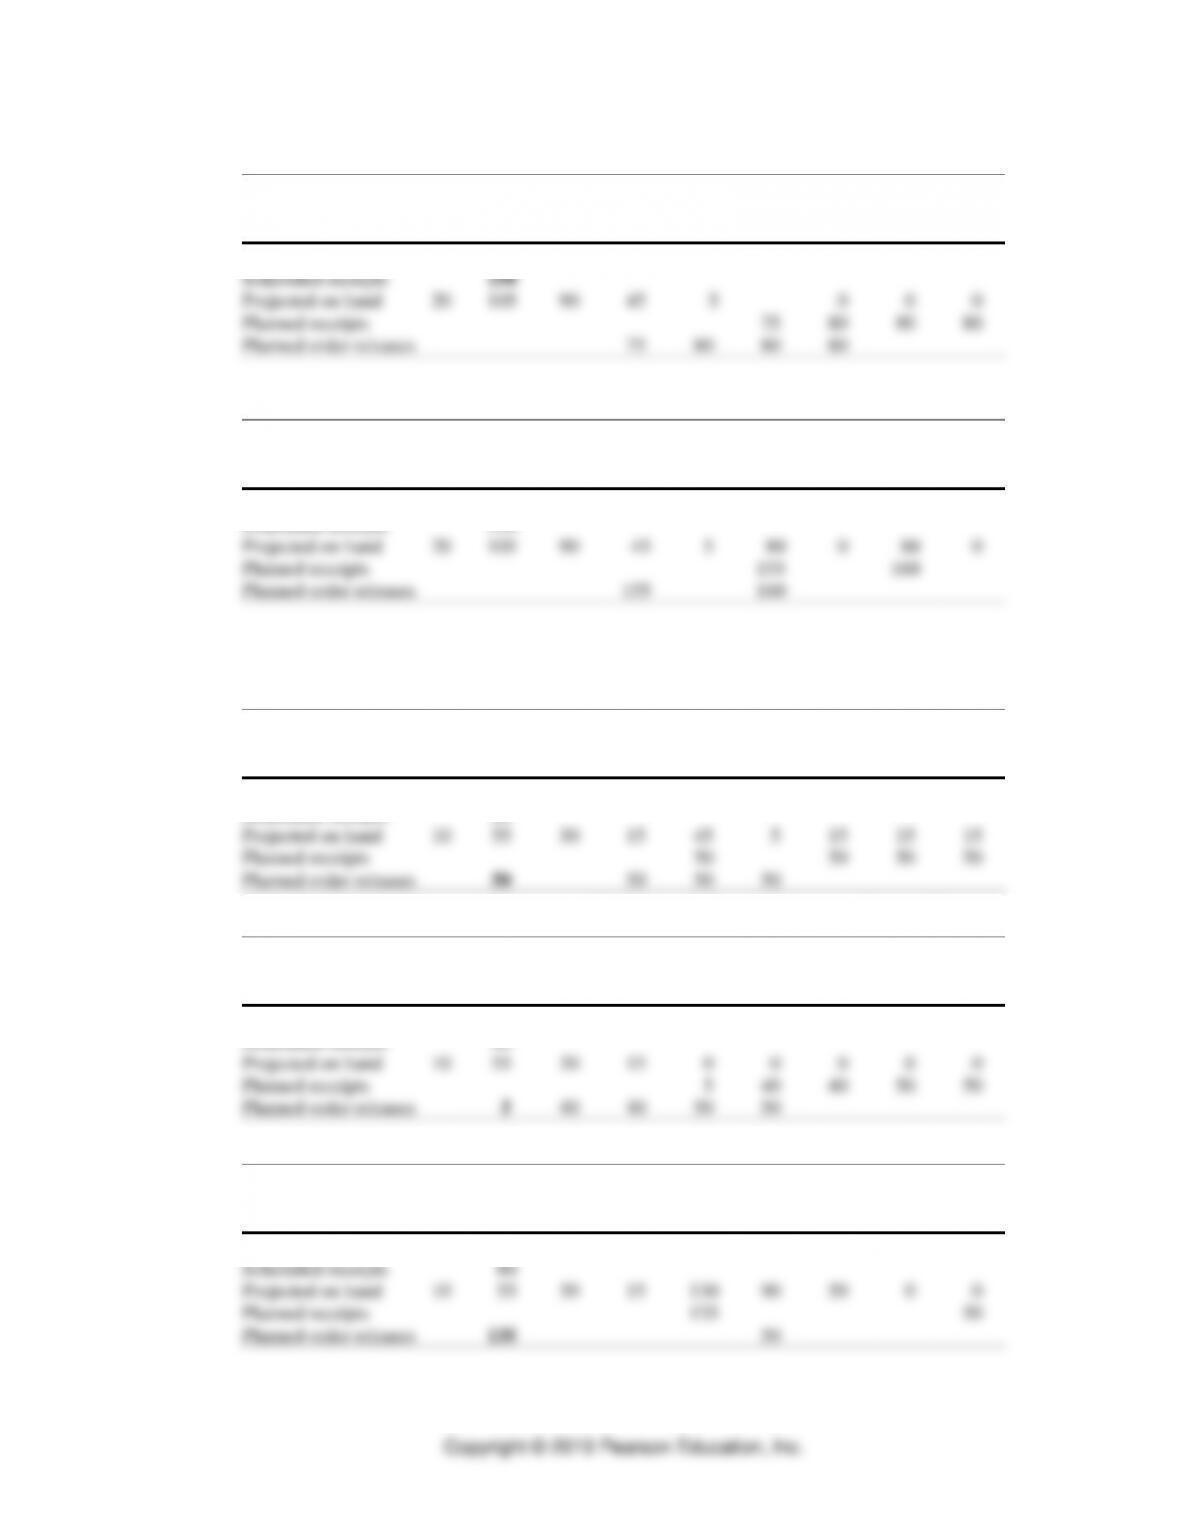
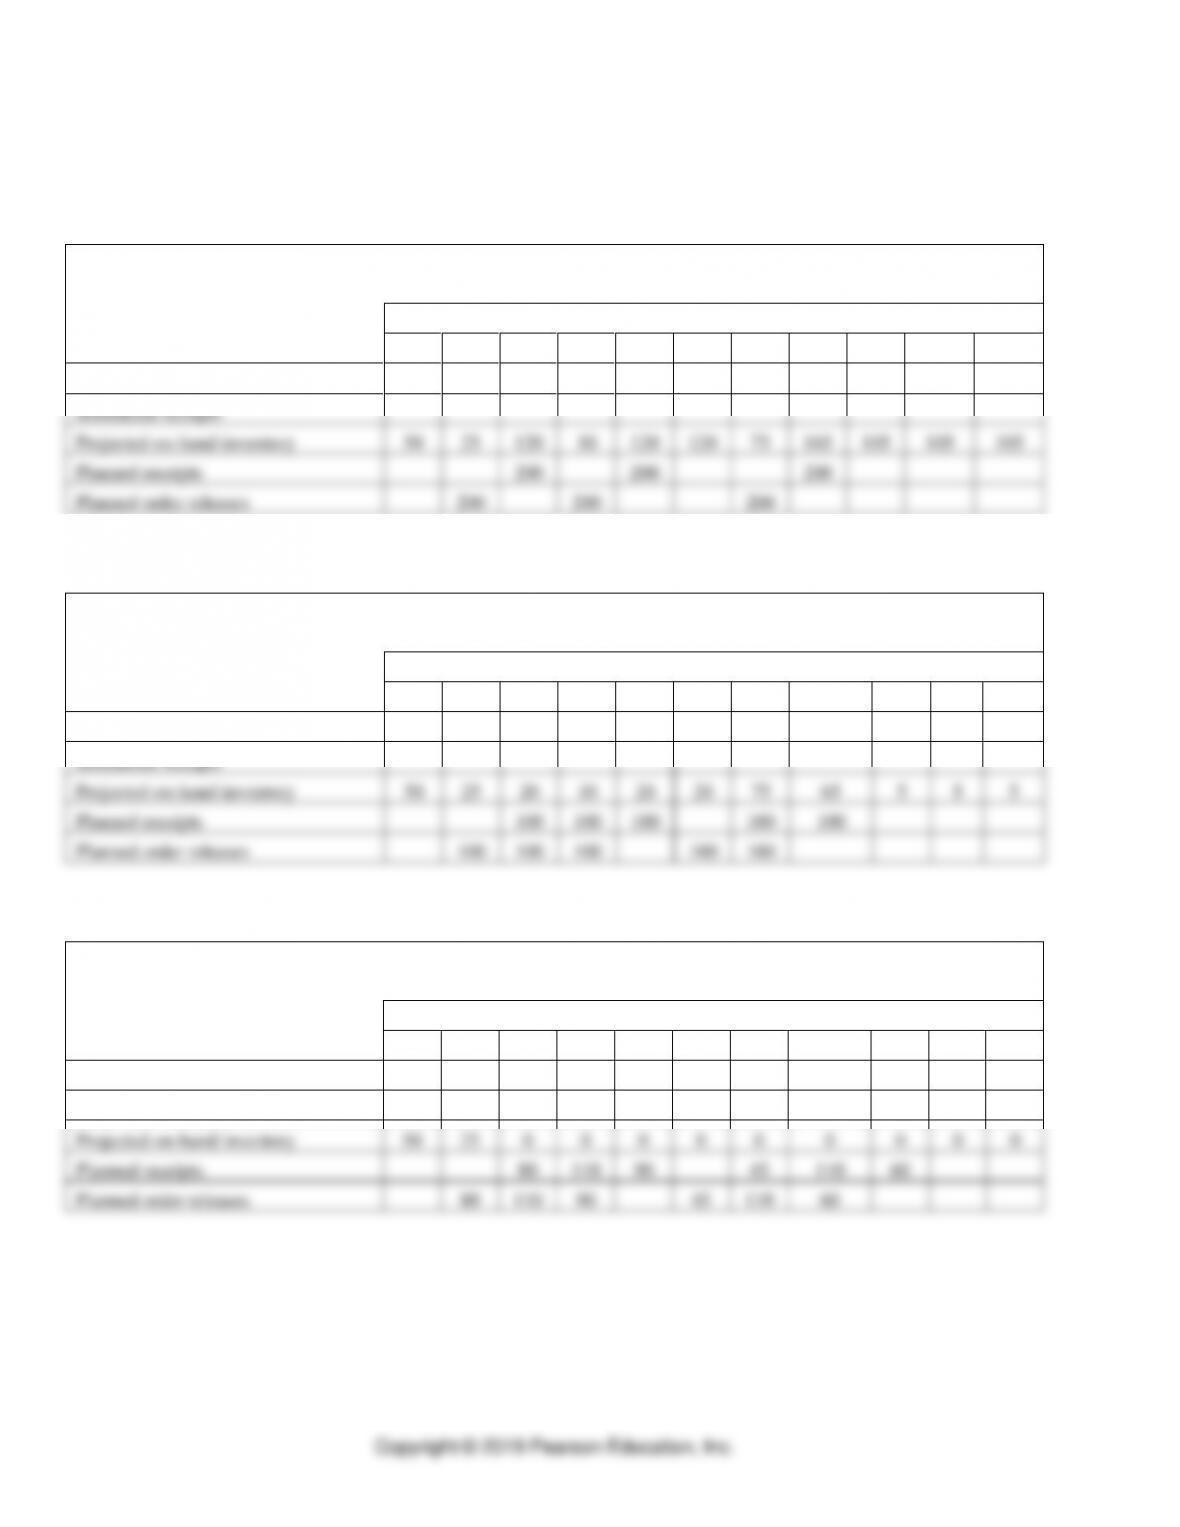
16. Inventory record.
The tables following were generated with the Single-Item MRP solver from OM
Explorer.
a. Fixed order quantity = 110
⚫ PART 2 ⚫ Managing Customer Demand
11–10
b. L4L
c. POQ, P = 2
17. Completed inventory records
a. FOQ of 150 units
Item: Rotor assembly
Lot Size:
150 units
Lead Time:
2 weeks
Week
1
2
3
4
5
6
7
8
Gross requirements
65
15
45
40
80
80
80
80
Scheduled receipts
150
Projected on hand 20
105
90
45
5
75
145
65
135
Planned receipts
150
150
150
Planned order releases
150
150
150
Resource Planning ⚫ CHAPTER 11
11–11
b. L4L
Item: Rotor assembly
Lot Size:
L4L
Lead Time:
2 weeks
Week
1
2
3
4
5
6
7
8
Gross requirements
65
15
45
40
80
80
80
80
Scheduled receipts
150
Projected on hand 20
105
90
45
5
0
0
0
Planned receipts
75
80
80
80
Planned order releases
75
80
80
80
c. POQ with P = 2
Item: Rotor assembly
Lot Size:
POQ, P = 2
Lead Time:
2 weeks
Week
1
2
3
4
5
6
7
8
Gross requirements
65
15
45
40
80
80
80
80
Scheduled receipts
150
Projected on hand 20
105
90
45
5
80
0
80
0
Planned receipts
155
160
Planned order releases
155
160
18. Completed inventory records
a. FOQ of 50 units
Item: Drive shaft
Lot Size:
50 units
Lead Time:
3 weeks
Week
1
2
3
4
5
6
7
8
Gross requirements
35
25
15
20
40
40
50
50
Scheduled receipts
80
Projected on hand 10
55
30
15
45
5
15
15
15
Planned receipts
50
50
50
50
Planned order releases
50
50
50
50
b. L4L
Item: Drive shaft
Lot Size:
L4L
Lead Time:
3 weeks
Week
1
2
3
4
5
6
7
8
Gross requirements
35
25
15
20
40
40
50
50
Scheduled receipts
80
Projected on hand 10
55
30
15
0
0
0
0
0
Planned receipts
5
40
40
50
50
Planned order releases
5
40
40
50
50
c. POQ with P = 4
Item: Drive shaft
Lot Size:
POQ, P = 4
Lead Time:
3 weeks
Week
1
2
3
4
5
6
7
8
Gross requirements
35
25
15
20
40
40
50
50
Scheduled receipts
80
Projected on hand 10
55
30
15
130
90
50
0
0
Planned receipts
135
50
Planned order releases
135
50
⚫ PART 2 ⚫ Managing Customer Demand
11–12
19. Rear wheel assembly
a. Completed inventory record with an FOQ of 200 units
Item: MQ-09
Lot Size: FOQ of 200 units
Description: Rear wheel subassembly
Lead Time: 1 week
Week
1
2
3
4
5
6
7
8
9
10
Gross requirements
25
105
110
90
45
110
60
Scheduled receipts
Projected on-hand inventory
50
25
120
10
120
120
75
165
105
105
105
Planned receipts
200
200
200
Planned order releases
200
200
200
b. Completed inventory record with an FOQ of 100 units
Item: MQ-09
Lot Size: FOQ of 100 units
Description: Rear wheel subassembly
Lead Time: 1 week
Week
1
2
3
4
5
6
7
8
9
10
Gross requirements
25
105
110
90
45
110
60
Scheduled receipts
Projected on-hand inventory
50
25
20
10
20
20
75
65
5
5
5
Planned receipts
100
100
100
100
100
Planned order releases
100
100
100
100
100
c. Completed inventory record with L4L
Item: MQ-09
Lot Size: L4L
Description: Rear wheel subassembly
Lead Time: 1 week
Week
1
2
3
4
5
6
7
8
9
10
Gross requirements
25
105
110
90
45
110
60
Scheduled receipts
Projected on-hand inventory
50
25
0
0
0
0
0
0
0
0
0
Planned receipts
80
110
90
45
110
60
Planned order releases
80
110
90
45
110
60
Resource Planning ⚫ CHAPTER 11
11–13
20. Motor subassembly
a. Completed inventory record with L4L
Item: MQ-09
Lot Size: L4L
Description: Motor subassembly
Lead Time: 2 week
Week
1
2
3
4
5
6
7
8
9
10
Gross requirements
80
50
35
20
55
15
30
25
10
Scheduled receipts
60
Projected on-hand inventory
20
80
0
0
0
0
0
0
0
0
0
Planned receipts
50
35
20
55
15
30
25
10
Planned order releases
50
35
20
55
15
30
25
10
b. Completed inventory record with POQ (P=2 weeks)
Item: MQ-09
Lot Size: POQ P=2 weeks
Description: Motor subassembly
Lead Time: 2 week
Week
1
2
3
4
5
6
7
8
9
10
Gross requirements
80
50
35
20
55
15
30
25
10
Scheduled receipts
60
Projected on-hand inventory
20
80
0
35
0
55
0
30
0
10
0
Planned receipts
85
75
45
35
Planned order releases
85
75
45
35
c. Completed inventory record with POQ (P=4 weeks)
Item: MQ-09
Lot Size: POQ P=4 weeks
Description: Motor subassembly
Lead Time: 2 week
Week
1
2
3
4
5
6
7
8
9
10
Gross requirements
80
50
35
20
55
15
30
25
10
Scheduled receipts
60
Projected on-hand inventory
20
80
0
110
75
55
0
65
35
10
0
Planned receipts
160
80
Planned order releases
160
80
⚫ PART 2 ⚫ Managing Customer Demand
11–14
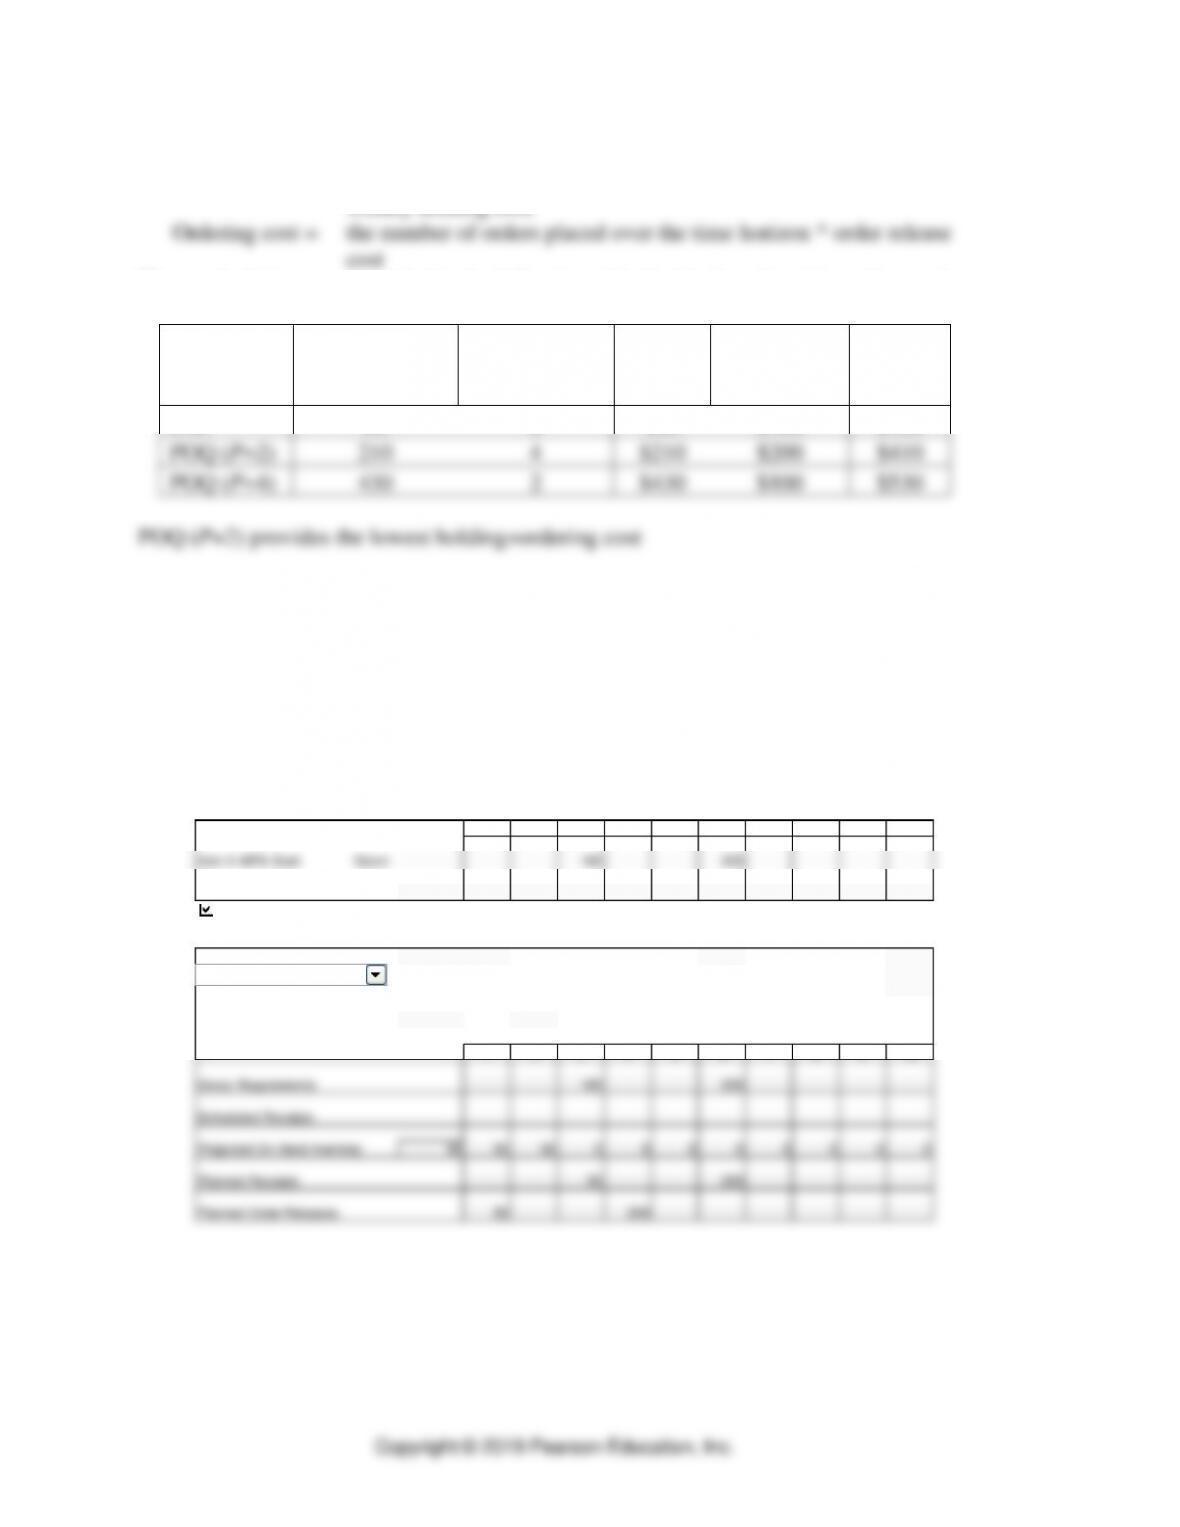
d. The total cost of each lot sizing rule is calculated as follows:
Holding cost = total number of units held for 1 week over the time horizon *
weekly holding cost
These calculations are provided in the following table for the three lot sizing rules used:
Lot size
rule
Total
Inventory units
held
Number of
Orders placed
Holding
cost
Ordering
cost
Total
cost
L4L
80
8
$80
$400
$480
POQ (P=2)
210
4
$210
$200
$410
POQ (P=4)
430
2
$430
$100
$530
21. MRP for Figure 11.40
a. This solution was developed using the Material Requirements Planning module in
OM Solver.
Inputs
Solver – Material Requirements Planning
Master Production Schedule
1 2 3 4 5 6 7 8 9 10
Item A MPS Start Descr: 100 200
Item B MPS Start Descr:
Material Requirements Planning
Item C Descr: Period (P) for POQ Lot Size (FOQ)
Lead Time 2
Safety Stock
Usage Quantity for Item: A 1 B
1 2 3 4 5 6 7 8 9 10
Gross Requirements 100 200
Scheduled Receipts
Projected On-Hand Inventory 50 50 50 0 0 0 0 0 0 0 0
Planned Receipts 50 200
Enter data in yellow shaded areas.
L4L Rule
Use second finished item
Resource Planning ⚫ CHAPTER 11
11–15
Item D Descr: Period (P) for POQ Lot Size (FOQ) 200
Lead Time 1
Safety Stock
Usage Quantity for Item: A 2 B C
1 2 3 4 5 6 7 8 9 10
Gross Requirements 200 400
Scheduled Receipts 200
Projected On-Hand Inventory 200 200 200 200 200 200 0 0 0 0 0
Planned Receipts 200
Planned Order Releases 200
Item E Descr: Period (P) for POQ 3 Lot Size (FOQ)
Lead Time 1
Safety Stock
Usage Quantity for Item: A 4 B C D
1 2 3 4 5 6 7 8 9 10
Gross Requirements 400 800
Scheduled Receipts 200
Projected On-Hand Inventory 0 0 0 0 0 0 0 0 0 0
Planned Receipts 200 800
Planned Order Releases 200 800
FOQ Rule
POQ Rule
b. In week 1, an order for 50 units of item C should be released.
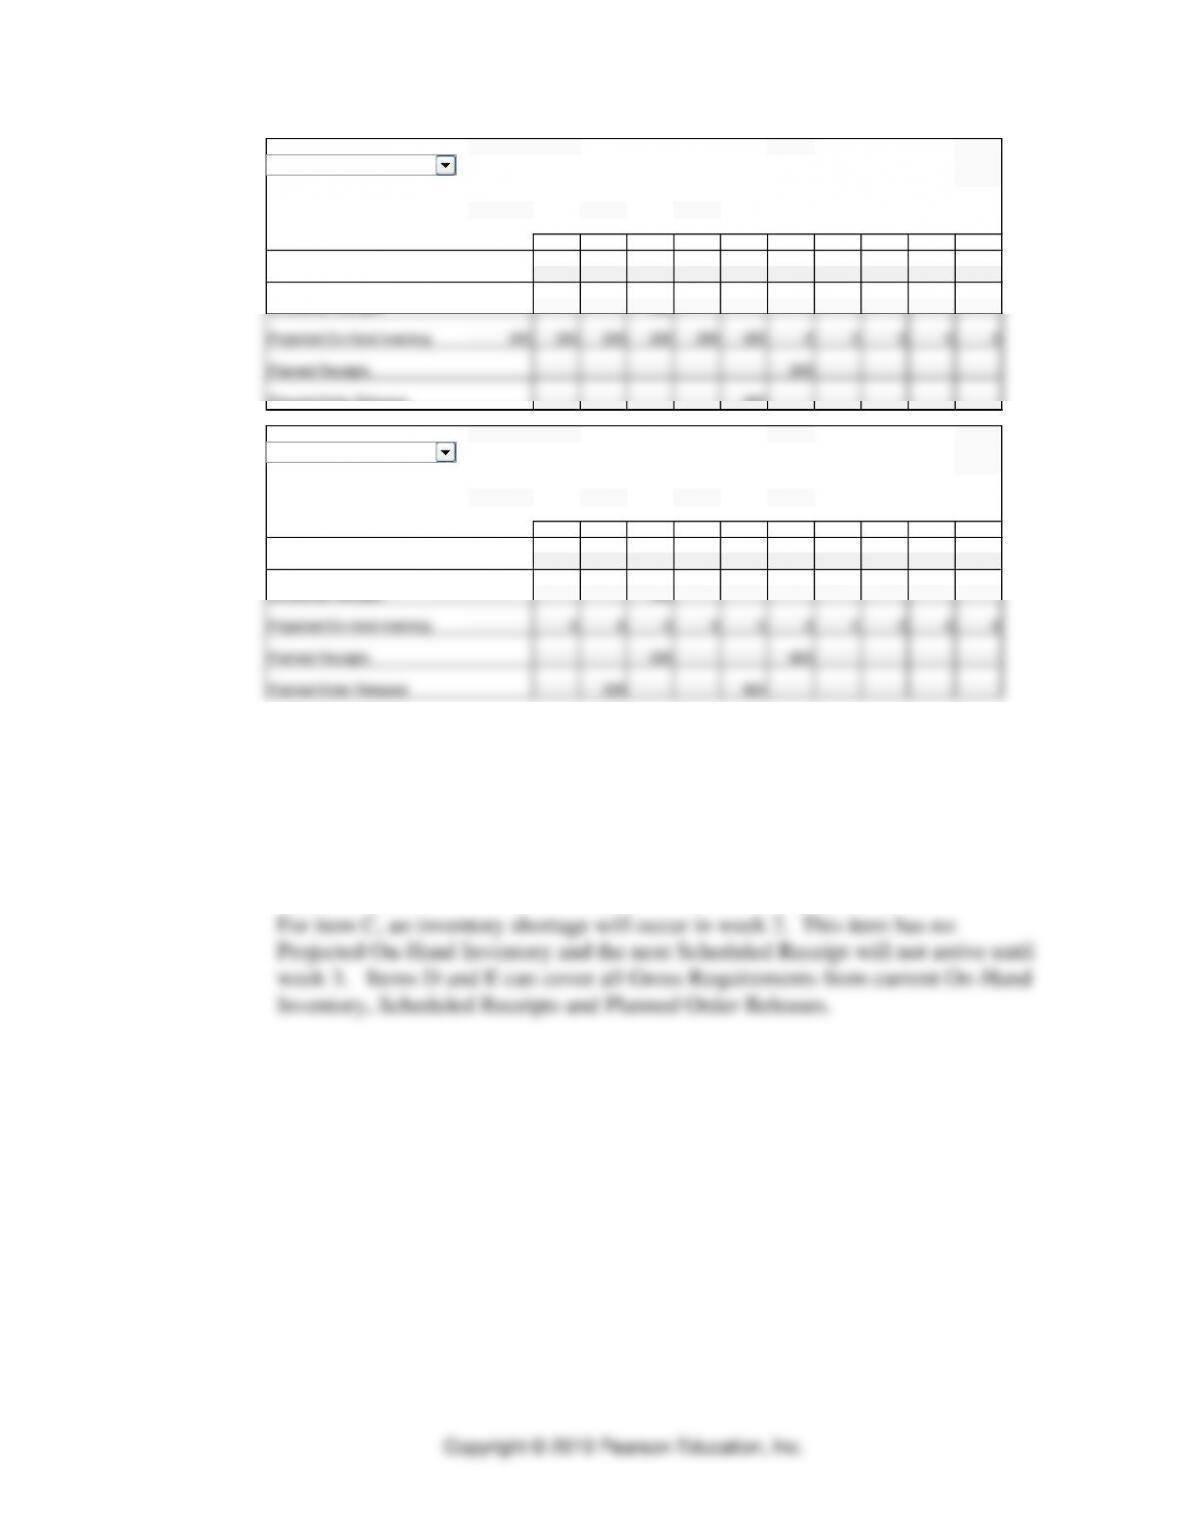
22. MRP for Figure 11.41
a. This solution was developed using the Material Requirements Planning module in
OM Solver.
⚫ PART 2 ⚫ Managing Customer Demand
11–16
Solver – Material Requirements Planning
Master Production Schedule
1 2 3 4 5 6 7 8 9 10
Item A MPS Start Descr: 85 200 50
Item B MPS Start Descr: 65 50 50 75
Material Requirements Planning
Item C Descr: Period (P) for POQ Lot Size (FOQ)
Lead Time 2
Safety Stock
Usage Quantity for Item: A 2 B 1
1 2 3 4 5 6 7 8 9 10
Gross Requirements 170 65 450 50 175
Scheduled Receipts 200
Projected On-Hand Inventory 0 –170 0 0 0 0 0 0 0 0
Planned Receipts 35 450 50 175
Planned Order Releases 35 450 50 175
Enter data in yellow shaded areas.
L4L Rule
Use second finished item
Item D Descr: Period (P) for POQ Lot Size (FOQ) 200
Lead Time 1
Safety Stock
Usage Quantity for Item: A 1 B 2 C
1 2 3 4 5 6 7 8 9 10
Gross Requirements 85 130 300 100 200
Scheduled Receipts
Projected On-Hand Inventory 0 115 185 85 185 185 185 185 185 185
Planned Receipts 200 200 200 200 200
Planned Order Releases 200 200 200 200 200
Item E Descr: Period (P) for POQ 2 Lot Size (FOQ)
Lead Time 1
Safety Stock
Usage Quantity for Item: A 4 B C D
1 2 3 4 5 6 7 8 9 10
Gross Requirements 340 800 200
Scheduled Receipts
Projected On-Hand Inventory 200 200 0 0 0 0 0 0 0 0 0
Planned Receipts 140 800 200
FOQ Rule
POQ Rule
Resource Planning ⚫ CHAPTER 11
11–17
b. This solution was developed using the Material Requirements Planning module in
OM Solver.
The inventory shortage for item C may not be alleviated by placing a larger order
in week 1. The best solution may be to expedite the Scheduled Receipt currently
scheduled to arrive in week 3 to week 2.
Inputs
Solver – Material Requirements Planning
Master Production Schedule
1 2 3 4 5 6 7 8 9 10
Item A MPS Start Descr: 85 200 50
Item B MPS Start Descr: 65 50 50 75
Material Requirements Planning
Item C Descr: Period (P) for POQ Lot Size (FOQ)
Lead Time 2
Safety Stock
Usage Quantity for Item: A 2 B 1
1 2 3 4 5 6 7 8 9 10
Gross Requirements 170 65 450 50 175
Scheduled Receipts 200
Projected On-Hand Inventory 0 30 0 0 0 0 0 0 0 0
Planned Receipts 35 450 50 175
Enter data in yellow shaded areas.
L4L Rule
Use second finished item
Item D Descr: Period (P) for POQ Lot Size (FOQ) 200
Lead Time 1
Safety Stock
Usage Quantity for Item: A 1 B 2 C
1 2 3 4 5 6 7 8 9 10
Gross Requirements 85 130 300 100 200
Scheduled Receipts
Projected On-Hand Inventory 0 115 185 85 185 185 185 185 185 185
Planned Receipts 200 200 200 200 200
Planned Order Releases 200 200 200 200 200
Item E Descr: Period (P) for POQ 2 Lot Size (FOQ)
Lead Time 1
Safety Stock
Usage Quantity for Item: A 4 B C D
1 2 3 4 5 6 7 8 9 10
Gross Requirements 340 800 200
Scheduled Receipts
Projected On-Hand Inventory 200 200 0 0 0 0 0 0 0 0 0
Planned Receipts 140 800 200
FOQ Rule
POQ Rule
⚫ PART 2 ⚫ Managing Customer Demand
11–18
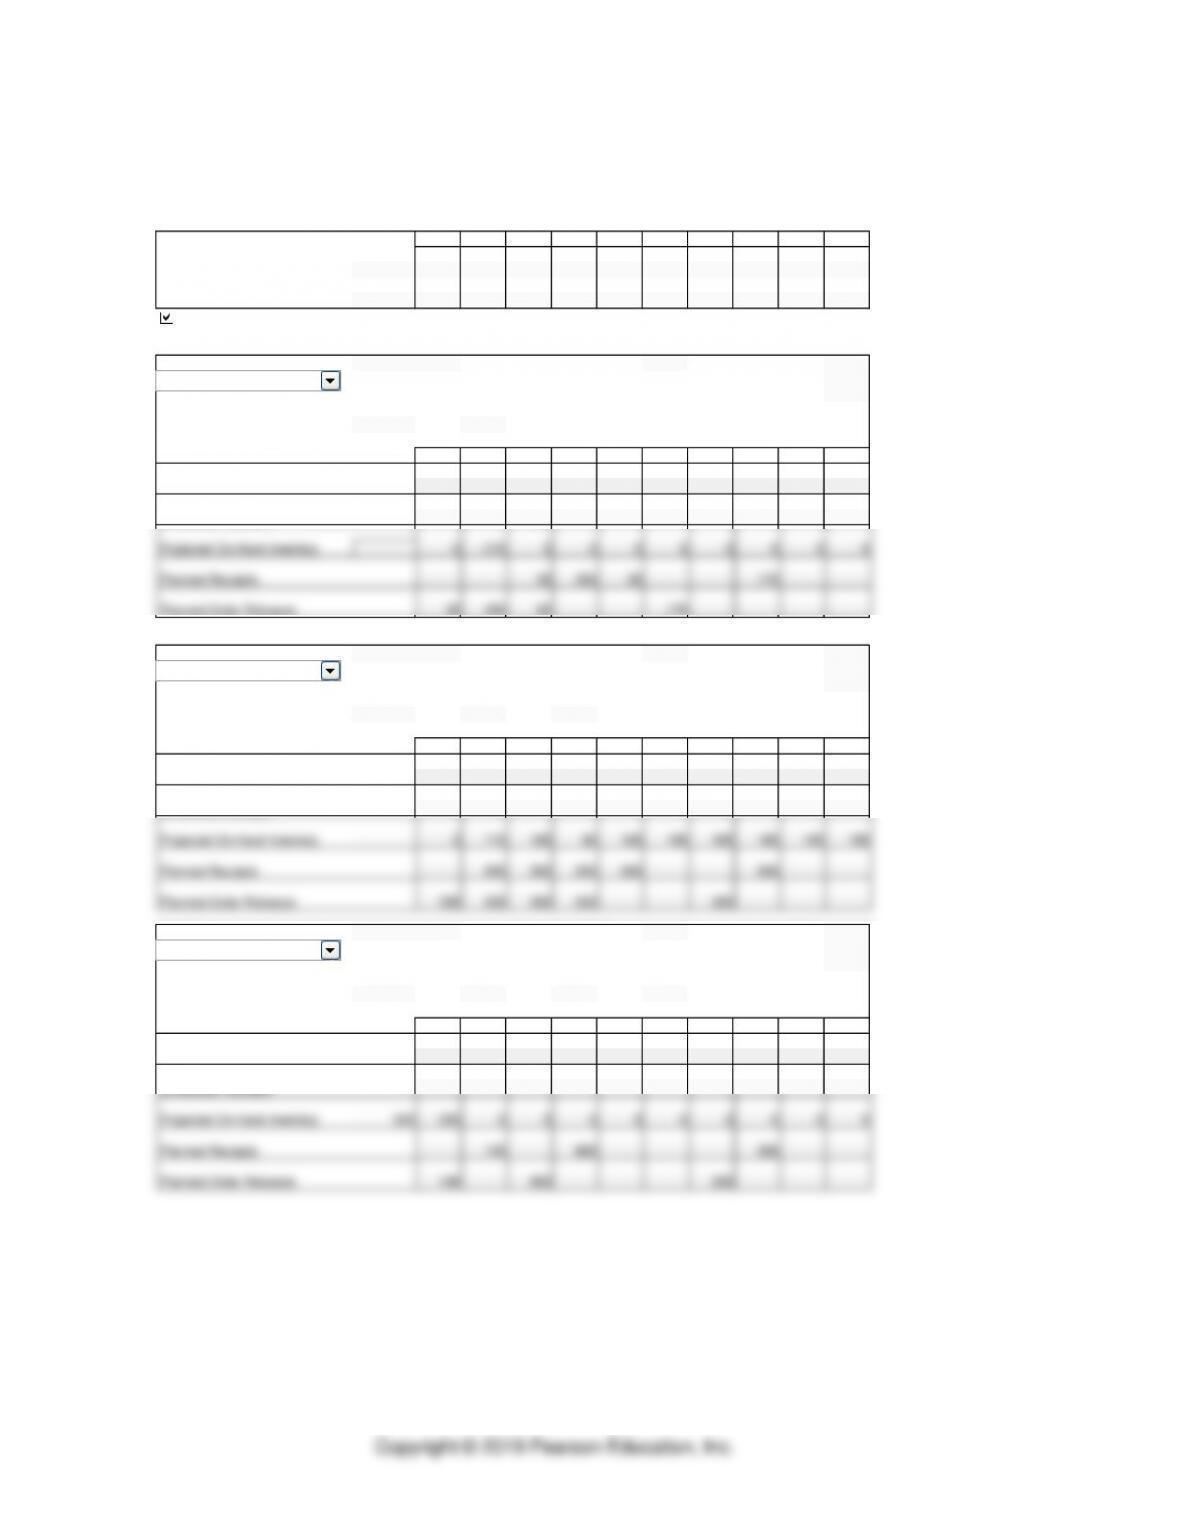
23. MRP for Figure 11.42
A
B(2) C(1) D(2)
E(2) F(1) E(1)
F(2)
Item: B
Lot Size:
L4L
Description:
Lead Time:
2 weeks
Week
1
2
3
4
5
6
7
8
Gross requirements
100
130
160
Scheduled receipts
50
Projected on hand 50
50
0
0
0
0
0
0
0
Planned receipts
130
160
Planned order releases
130
160
Item: C
Lot Size:
POQ = 3
Description:
Lead Time:
1 week
Week
1
2
3
4
5
6
7
8
Gross requirements
20
70
20
20
85
20
20
100
Scheduled receipts
Projected on hand 50
30
40
20
0
40
20
0
0
Planned receipts
80
125
100
Planned order releases
80
125
100
Item: D
Lot Size:
FOQ = 250
Description:
Lead Time:
2 weeks
Week
1
2
3
4
5
6
7
8
Gross requirements
100
130
160
Scheduled receipts
Projected on hand 120
120
20
20
20
140
140
140
230
Planned receipts
250
250
Planned order releases
250
250
Item: E
Lot Size:
FOQ = 600
Description:
Lead Time:
2 weeks
Week
1
2
3
4
5
6
7
8
Gross requirements
510
570
Scheduled receipts
Projected on hand 70
70
70
160
160
160
190
190
190
Planned receipts
600
600
Planned order releases
600
600
Resource Planning ⚫ CHAPTER 11
11–19
Item: F
Lot Size:
L4L
Description:
Lead Time:
1 week
Week
1
2
3
4
5
6
7
8
Gross requirements
160
130
250
160
200
Scheduled receipts
Projected on hand 250
90
90
0
0
0
0
0
0
Planned receipts
40
250
160
200
Planned order releases
40
250
160
200
Action notices signal the need to place orders for 80 Cs and 600 Es. Please note that
action notices were not asked for in the problem.
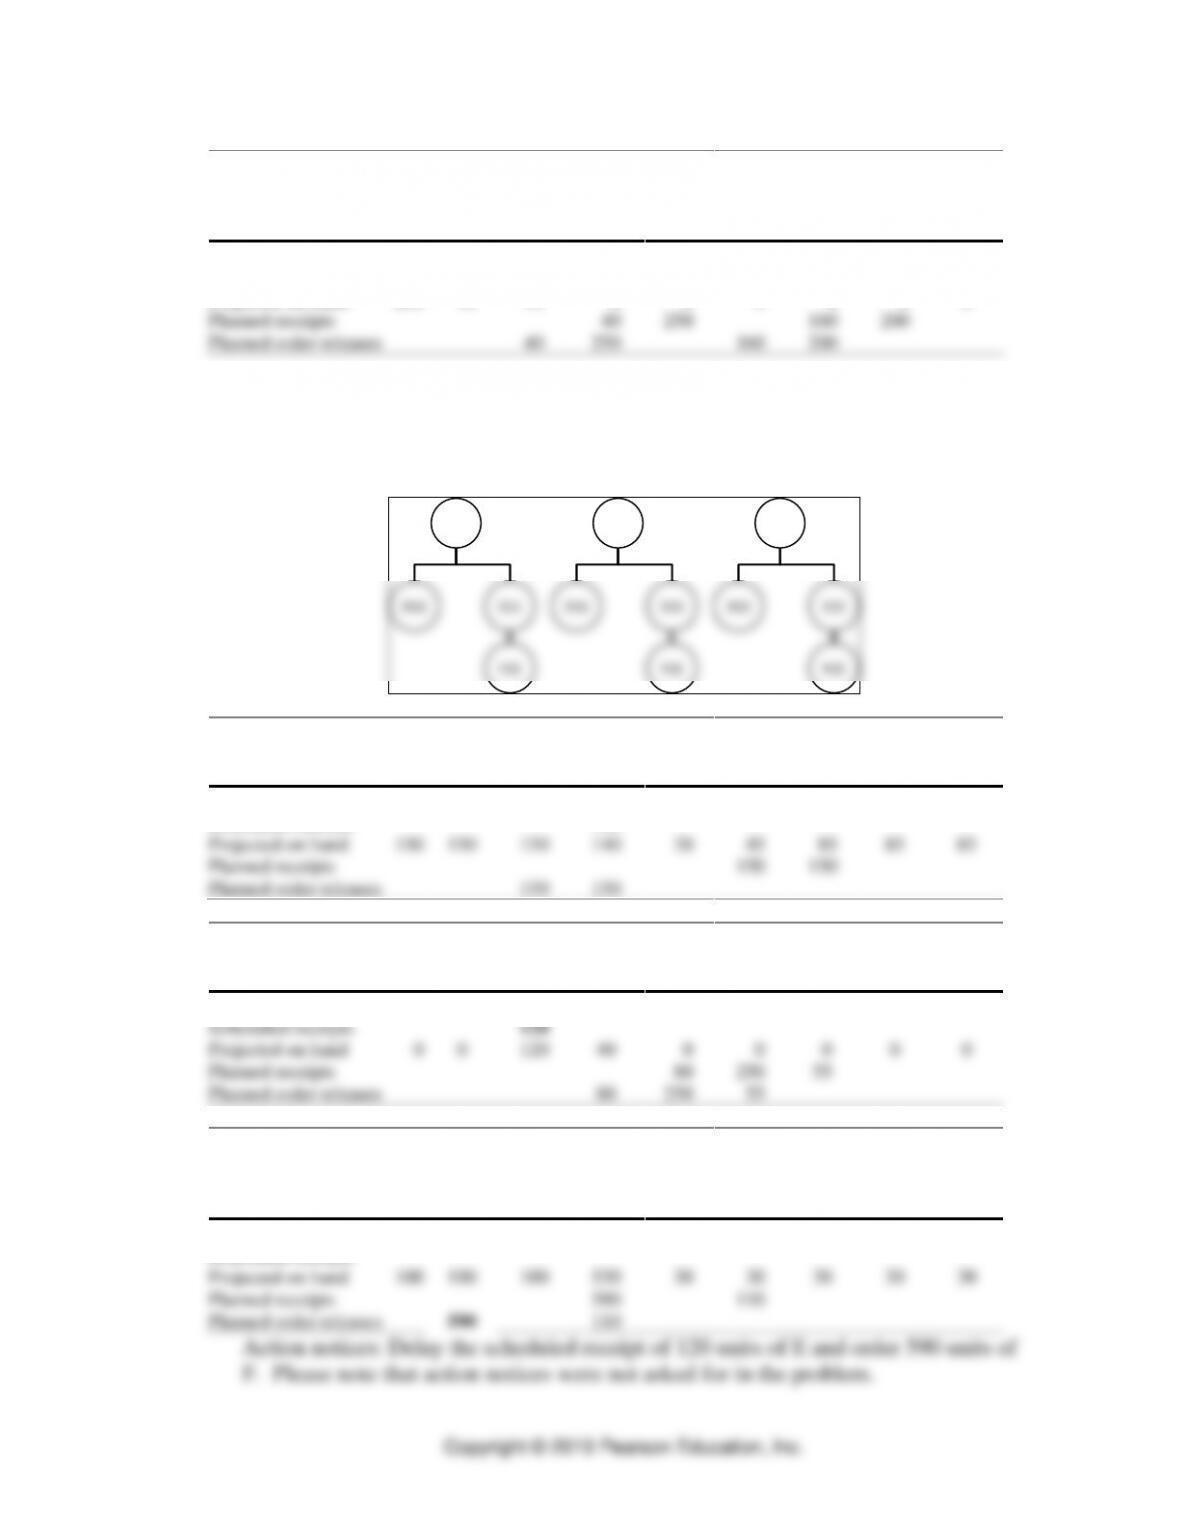
24. MRP for products A, B, and C in Figure 11.43
A
D(2)
F(2)
E(1)
B
D(1)
F(2)
E(2)
C
D(2)
F(2)
E(2)
Item: D
Lot Size:
FOQ = 150
Description:
Lead Time:
3 weeks
Week
1
2
3
4
5
6
7
8
Gross requirements
160
120
125
110
Scheduled receipts
150
Projected on hand 150
150
150
140
20
45
85
85
85
Planned receipts
150
150
Planned order releases
150
150
Item: E
Lot Size:
L4L
Description:
Lead Time:
1 week
Week
1
2
3
4
5
6
7
8
Gross requirements
80
120
250
55
Scheduled receipts
120
Projected on hand 0
0
120
40
0
0
0
0
0
Planned receipts
80
250
55
Planned order releases
80
250
55
Item: F
Lot Size:
POQ, P = 2
Description:
Lead Time:
2 weeks
Safety Stock:
30 units
Week
1
2
3
4
5
6
7
8
Gross requirements
160
500
110
Scheduled receipts
Projected on hand 100
100
100
530
30
30
30
30
30
Planned receipts
590
110
Planned order releases
590
110
⚫ PART 2 ⚫ Managing Customer Demand
11–20
25. MRP for Figure 11.44
a. This solution was developed using the Material Requirements Planning module in
OM Solver.
Solver – Material Requirements Planning
Master Production Schedule
1 2 3 4 5 6 7 8 9 10
Item A MPS Start Descr: 125 95 150 130
Item B MPS Start Descr: 80 70
Material Requirements Planning
Item C Descr: Period (P) for POQ Lot Size (FOQ)
Lead Time 3
Safety Stock
Usage Quantity for Item: A 2 B
1 2 3 4 5 6 7 8 9 10
Gross Requirements 250 190 300 260
Scheduled Receipts 200
Projected On-Hand Inventory 85 85 35 35 0 0 0 0 0 0 0
Planned Receipts 155 300 260
Enter data in yellow shaded areas.
L4L Rule
Use second finished item
Item D Descr: Period (P) for POQ 3 Lot Size (FOQ)
Lead Time 2
Safety Stock
Usage Quantity for Item: A 2 B 1 C 1
1 2 3 4 5 6 7 8 9 10
Gross Requirements 155 250 380 190 260 370 260
Scheduled Receipts
Projected On-Hand Inventory 625 470 220 450 260 0260 260 0 0 0
Planned Receipts 610 630
Planned Order Releases 610 630
Item E Descr: Period (P) for POQ Lot Size (FOQ) 800
Lead Time 1
Safety Stock
Usage Quantity for Item: A 2 B 2 C D 1
1 2 3 4 5 6 7 8 9 10
Gross Requirements 610 250 160 820 440 260
Scheduled Receipts 800
Projected On-Hand Inventory 350 540 290 130 110 110 470 470 210 210 210
Planned Receipts 800 800
Planned Order Releases 800 800
POQ Rule
FOQ Rule